-
海拔高度与昆虫的物种多样性关系密切,不同海拔高度的同类昆虫物种多样性各不相同[1]。鳞翅目Lepidopte蛾类昆虫经过长时间的协同进化,已成为维持生态平衡的重要指示类群之一,是具有重要科研价值的一类昆虫[2]。大蛾类作为翅展大于25 mm的蛾类,是重要的访花和传粉昆虫[3],同时大蛾类的部分昆虫也是主要的农林害虫,如枯叶蛾科Lasiocampidae的松毛虫属Dendrolimus昆虫每年对松林面积的破坏性大,已成为全世界森林中危害最严重的一类害虫[4−6]。鉴于此,本研究在浙江天目山国家级自然保护区内对不同海拔高度的大蛾类种群多样性及时间动态进行了研究,以期为天目山保护区昆虫资源数据提供参考。
-
浙江天目山国家级自然保护区位于杭州市临安区(30°18′~30°24′N,119°23′~119°29′E),最高峰仙人顶海拔为1 506.0 m。该区属亚热带季风气候,年均气温为8.1~14.3 ℃,年均降水量为1 100.0~1 900.0 mm。区内植被类型多样且随着海拔梯度的变化而发生显著变化[7]。
-
在研究区内,每隔200 m的海拔梯度设置1个样点,共设置8个样点,分别为海拔0~200、200~400、400~600、600~800、800~1 000、1 000~1 200、1 200~1 400、1 400~1 506 m。白天时段在各个海拔梯度通过网捕法捕捉大蛾类幼虫和成虫,幼虫放在室内饲养再根据成虫的形态特征进行鉴定。夜晚时段(20:00—24:00)在各个海拔梯度中选取距林缘50~100 m、地势相对平坦的空地,放置1个灯诱帐篷[规格大小为1.2 m×1.2 m×1.8 m,光源为2 000 W (12 000 mA)续航75 h的户外充电照明灯]进行灯诱,并收集大蛾类昆虫。从5月开始,每周对各个样点的大蛾类标本收集并统计,共持续4个月,以每个月为单位对该月所采集的大蛾类进行分析、鉴定和统计。
-
采用Simpson指数、Shannon指数、Pielou均匀度和Margalef丰富度指数进行大蛾类种群多样性分析,统计每个样地中出现的物种数和个体数。多样性指数计算参考文献[8−9]。
-
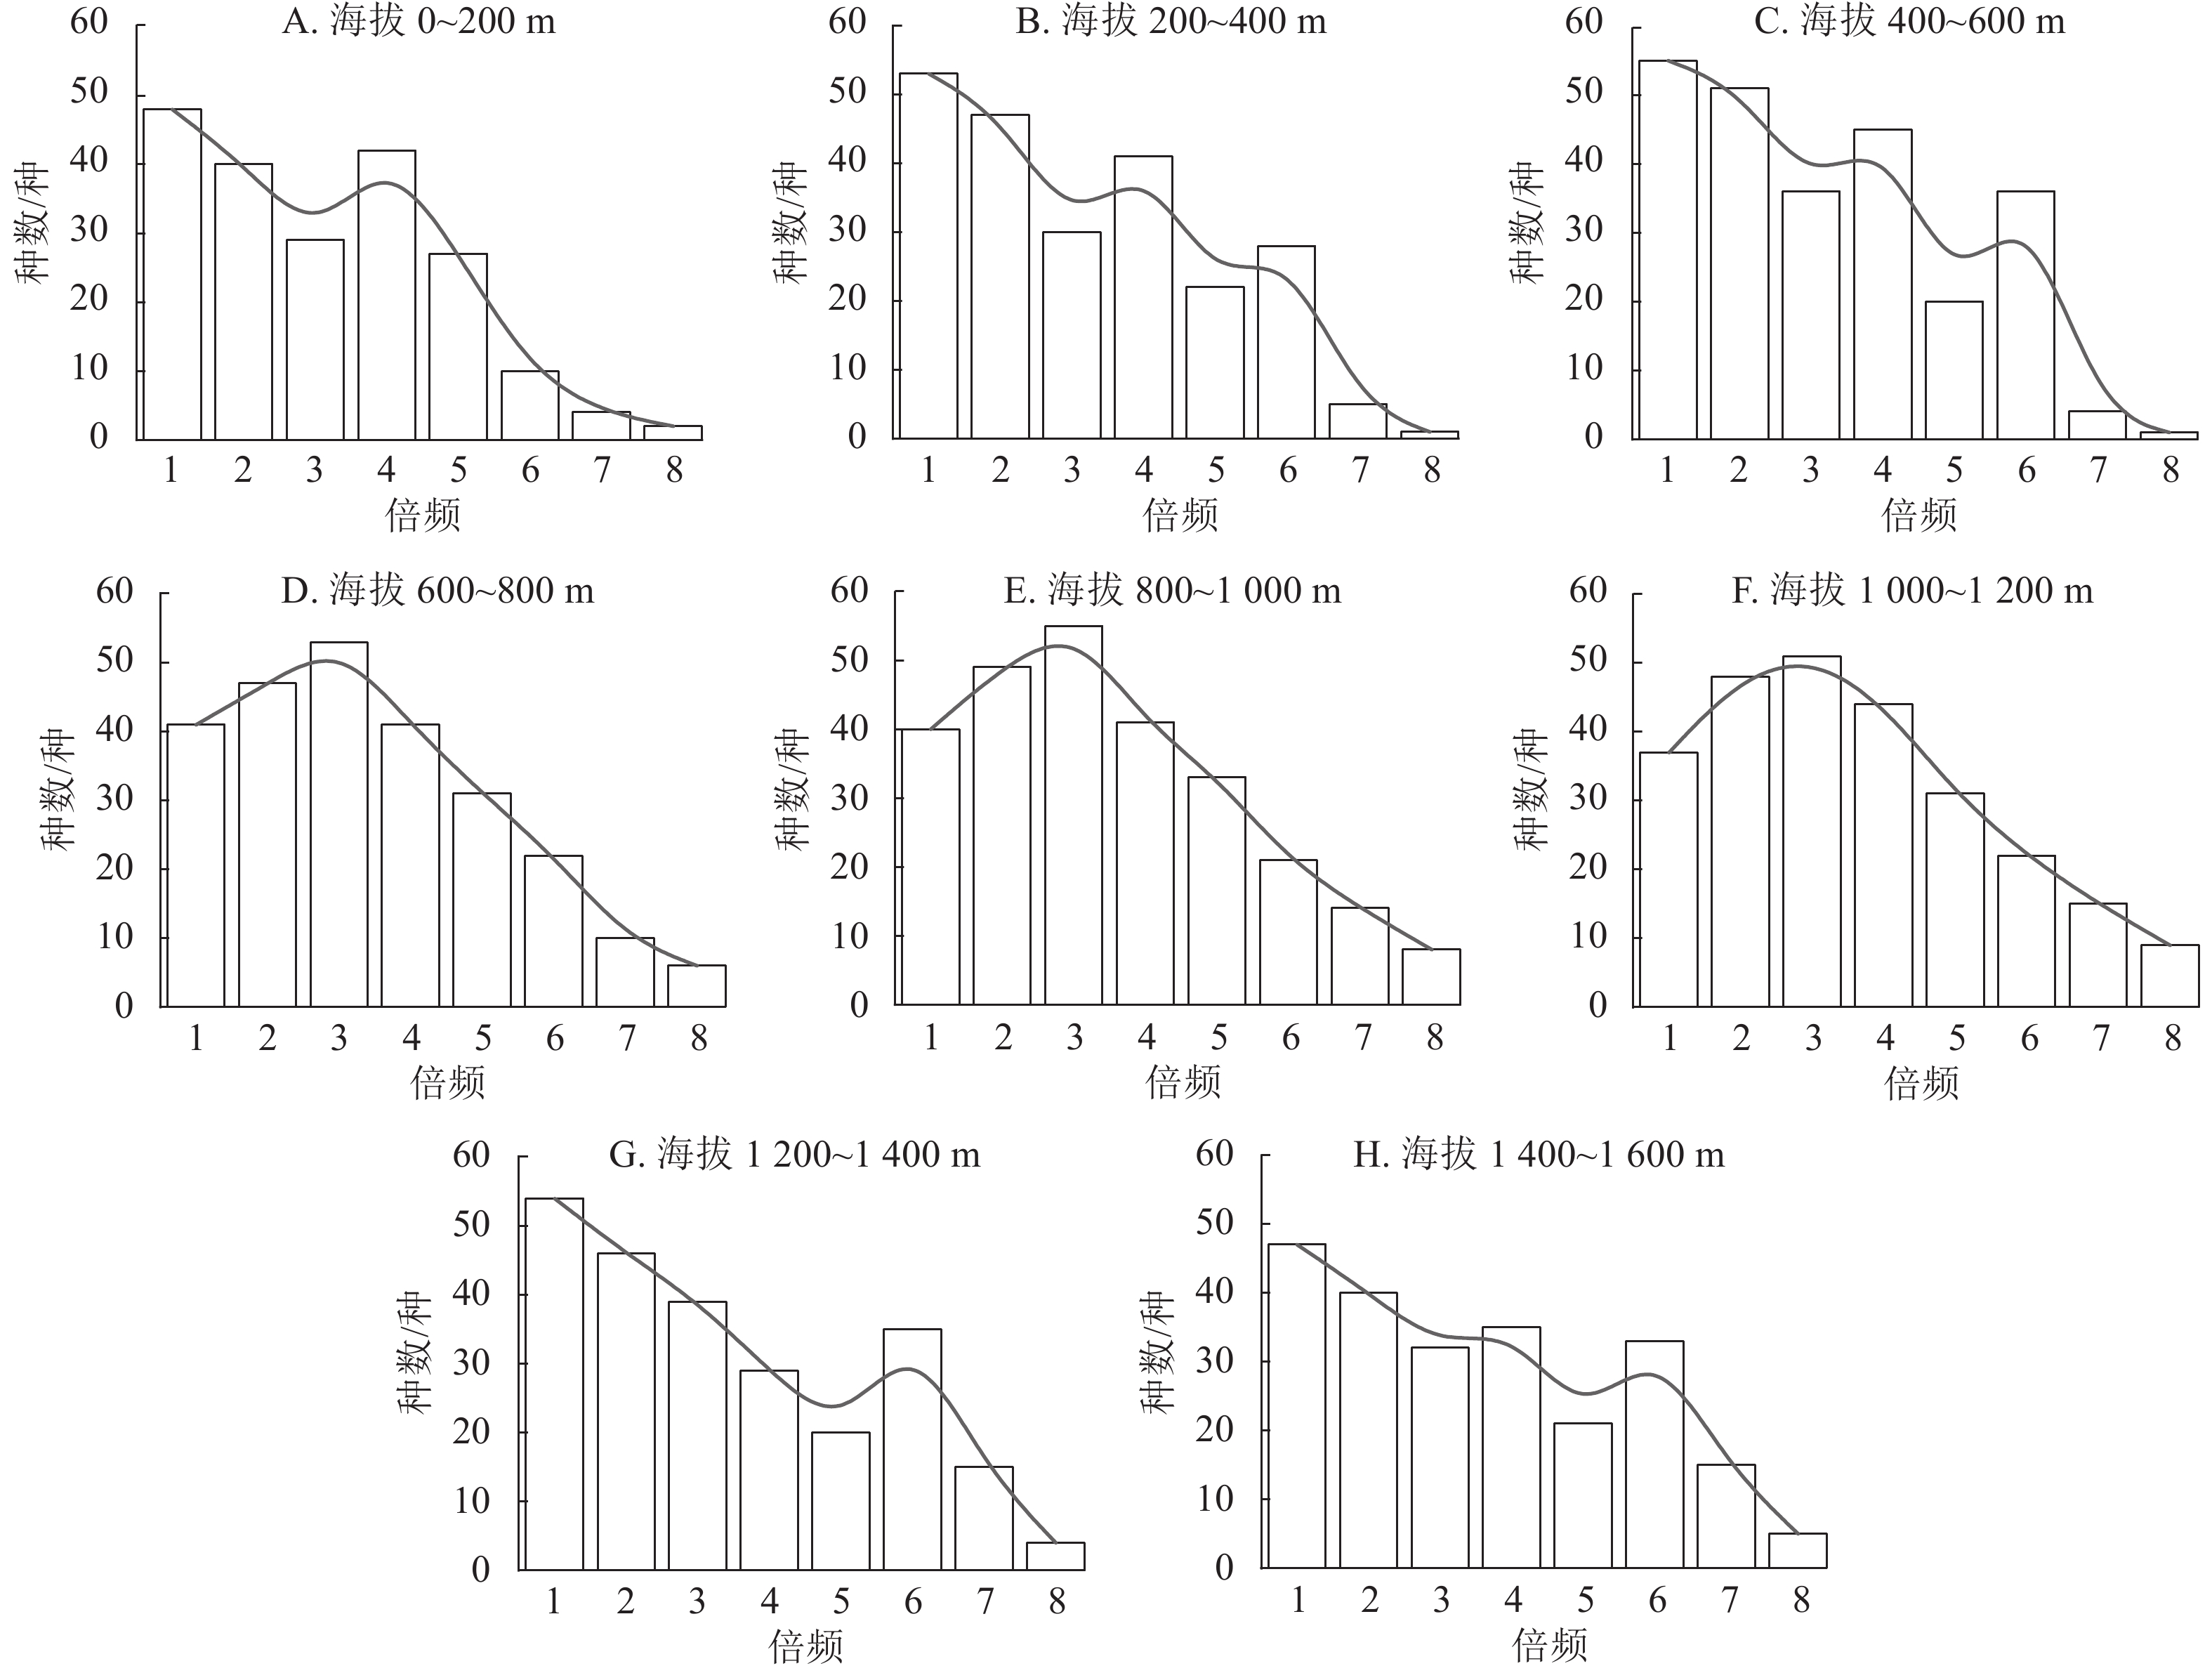
利用对数正态分布模型对不同海拔梯度上大蛾类种群的种-多度进行分析,模型表达式为${{{S}}_{{{(R)}}}} = {S _0}\exp ( - {\alpha ^2}{R^2})$。其中:S(R)是R倍程中的物种数量,S0是对数正态分布的众数倍程物种数,α是与分布有关的参数[10]。
-
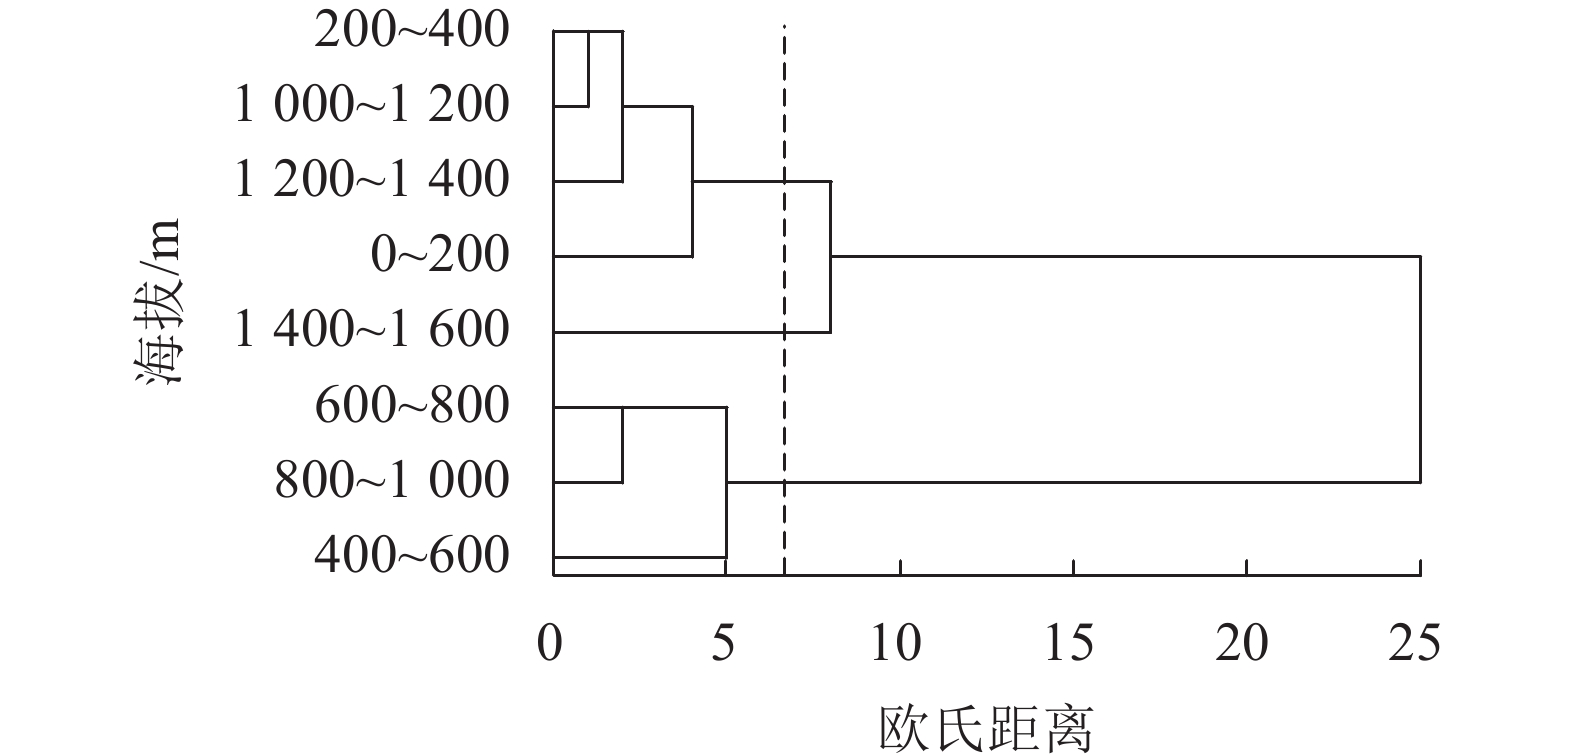
种群相似性用Jaccard相似性系数和系统聚类进行表征。①Jaccard相似性系数计算公式为C=c/(a+b+c)。其中:C为种群Jaccard相似性系数,a、b分别为2个生境所具有的物种数,c为2个生境中共有的物种数[11]。②系统聚类计算公式为${{d}}_{{ij}}=\sqrt{\left[{{\displaystyle \sum ({{X}}_{{ik}}-{{X}}_{{jk}})}}^{\text{2}}\right]}$。其中:dij为i种群与j种群之间的欧氏距离,Xik为i种群中第k个指标的值,Xjk为j种群中第k个指标的值[12]。
-
用Excel对大蛾类昆虫进行统计,并进行多样性分析,通过SPSS 21对大蛾类种群的物种数进行系统聚类和差异显著性检验,用Origin 2022对物种进行时间动态和种-多度关系分析。
-
从8个海拔梯度中共采集大蛾类昆虫标本3 367只,隶属25科269种。草螟科Crambidae、尺蛾科Geometridae、夜蛾科Noctuidae和天蛾科Sphingidae的个体数均超过总标本数的10%,其中尺蛾科个体数最多,有615只,占总个体数的18.3%。尺蛾科、天蛾科在每个海拔梯度上占总数比例都较多。箩纹蛾科Brahmaeidae的个体数量最少。
从表1可见:不同海拔的物种数各不相同,从低海拔到高海拔总体呈先增加后减小的趋势。随着海拔的升高,物种数和个体数逐渐增加,在800 m处达到最大值,随后随着海拔的升高,物种数和个体数逐渐减少。
科名 0~200 m 200~400 m 400~600 m 600~800 m 800~1 000 m 1 000~1 200 m 1 200~1 400 m 1 400~1 600 m 个体总
数/只S N S N S N S N S N S N S N S N 斑蛾科Zygaenidae 1 2 0 0 1 6 1 12 1 5 0 0 0 0 0 0 25 波纹蛾科Thyatiridae 1 9 1 11 2 10 2 25 2 20 1 6 1 1 0 0 82 蚕蛾科Bombycidae 1 3 1 8 1 3 2 12 1 4 1 5 1 1 0 0 36 草螟科Crambidae 15 29 16 43 25 53 26 69 23 71 15 44 7 21 3 8 338 尺蛾科Geometridae 19 49 20 65 31 89 53 116 57 122 34 93 22 53 11 28 615 刺蛾科Limacodidae 1 2 1 4 3 15 4 12 3 10 1 1 0 0 0 0 44 大蚕蛾科Saturniidae 2 8 4 15 7 30 8 45 7 30 4 14 5 14 0 0 156 带蛾科Thaumetopoeidae 0 0 1 2 1 4 1 9 1 7 0 0 0 0 0 0 22 灯蛾科Arctiidae 1 3 1 12 1 7 2 25 2 18 1 1 0 0 1 2 68 毒蛾科Lymantriidae 2 6 2 13 3 20 4 31 3 15 2 6 1 1 0 0 92 凤蛾科Epicopeiidae 1 2 0 0 1 1 1 1 1 4 0 0 0 0 0 0 8 钩蛾科Drepanidae 3 7 4 8 7 16 9 27 7 22 1 4 2 3 0 0 87 卷蛾科Tortricidae 1 9 1 7 0 0 1 7 1 3 0 0 0 0 0 0 26 枯叶蛾科Lasiocampidae 1 3 3 13 8 23 9 31 6 21 5 16 2 5 0 0 112 瘤蛾科Nolidae 1 3 2 6 3 13 3 22 3 13 2 4 0 0 0 0 61 箩纹蛾科Brahmaeidae 0 0 0 0 0 0 0 1 1 2 0 0 0 0 0 0 3 螟蛾科Pyralidae 2 7 4 15 5 23 6 56 5 47 6 27 2 8 3 8 191 木蠹蛾科Cossidae 2 10 1 2 2 8 3 9 1 8 1 1 0 0 0 0 38 裳蛾科Erebidae 2 7 4 15 7 25 11 40 9 27 6 13 1 3 0 0 130 苔蛾科Lithosiidae 1 2 1 10 1 20 1 43 1 28 1 34 1 6 0 0 143 天蛾科Sphingidae 12 28 13 35 24 56 31 112 30 113 26 80 8 20 5 13 457 网蛾科Thyrididae 1 4 2 11 3 20 3 20 2 14 1 4 1 1 0 0 74 燕蛾科Uraniidae 0 0 1 2 2 10 2 18 1 8 0 0 0 0 0 0 38 夜蛾科Noctuidae 5 16 7 22 11 47 35 79 40 78 23 59 17 36 2 11 348 舟蛾科Notodontidae 2 8 4 13 3 13 11 55 14 61 2 15 1 7 1 1 173 S合计 77 94 152 229 222 131 72 26 269 N合计 217 332 512 877 751 427 180 71 3367 S占比/% 28.62 34.94 56.51 85.13 82.53 49.44 26.77 9.67 N占比/% 6.44 9.86 15.21 26.05 22.30 12.68 5.35 2.10 说明:S. 物种数(种);N. 个体数(只)。各海拔梯度之间有相同物种。 Table 1. Composition of large moth species at different altitudes of Mount Tianmu
-
从表2可见:不同海拔梯度下,大蛾类种群的Simpson指数和Shannon指数从高到低依次为海拔600~800、400~600、800~1 000、200~400、0~200、1 000~1 200、1 200~1 400、1 400~1 600 m,在海拔 1 000 m以上差异显著(P<0.05)。Pielou均匀度在海拔800 m以上差异显著(P<0.05)。Margalef丰富度在海拔1 000 m以上差异显著(P<0.05)。
海拔/m Simpson指数 Shannon指数 Pielou均匀度 Margalef丰富度 0~200 0.869±0.040 bc 2.322±0.310 bc 0.345±0.040 b 3.903±0.400 a 200~400 0.901±0.010 abc 2.565±0.120 ab 0.381±0.010 a 3.617±0.160 a 400~600 0.910±0.010 ab 2.634±0.080 a 0.391±0.010 a 3.527±0.200 a 600~800 0.922±0.000 a 2.769±0.200 a 0.411±0.020 a 3.542±0.180 a 800~1 000 0.902±0.010 abc 2.605±0.090 ab 0.387±0.010 a 3.625±0.180 a 1 000~1 200 0.857±0.030 c 2.195±0.160 c 0.326±0.020 b 2.972±0.190 b 1 200~1 400 0.791±0.060 d 1.816±0.310 d 0.269±0.040 c 2.696±0.230 b 1 400~1 600 0.646±0.030 e 1.242±0.070 e 0.188±0.010 d 1.408±0.110 c 说明:数值为平均值±标准差。同列不同字母表示同一指数在不同海拔间差异显著(P<0.05)。 Table 2. Large moth population diversity index under different altitude gradients of Mount Tianmu
-
8个海拔梯度的种-多度曲线中,海拔600~800、800~1 000、1 000~1 200 m趋向于对数正态分布模型(图1),拟合以上3个海拔梯度,发现海拔在800~1 000 m处的拟合度最高,说明在海拔800~1 000 m处的环境条件最优越,即优势类群和稀有类群都较少,常见种较多。其他海拔梯度符合生态位优先占领假说。
-
从表3可见:8个海拔梯度下大蛾类种群呈现中等相似,且差异不显著。其中海拔600~1 000 m的大蛾类种群与其他海拔的大蛾类种群相似性最高,而海拔1 400~1 600 m的大蛾类种群与其他海拔大蛾类种群相似性低。表明高海拔地区对大蛾类种群的影响较明显。
海拔/m 0~200 m 200~400 m 400~600 m 600~800 m 800~1 000 m 1 000~1 200 m 1 200~1 400 m 1 400~1 600 m 0~200 1.000 0.833 0.875 0.880 0.880 0.864 0.682 0.318 200~400 1.000 0.875 0.880 0.880 0.864 0.682 0.318 400~600 1.000 0.657 0.657 0.826 0.652 0.304 600~800 1.000 0.900 0.760 0.600 0.280 800~1 000 1.000 0.760 0.600 0.280 1 000~1 200 1.000 0.789 0.368 1 200~1 400 1.000 0.467 1 400~1 600 1.000 Table 3. Similarity coefficients of large moth population at different altitudes of Mount Tianmu
-
从图2可见:海拔200~400、1 000~1 400 m的大蛾类种群聚为一类;海拔0~200、1 400~1 600 m的种群聚为一类;海拔400~1 000 m的种群聚为一类。可见,海拔400~1 000 m处的环境保护相对较好,种群结构稳定,不同海拔高度的大蛾类种群系统聚类与相似性分析结果类似。
-
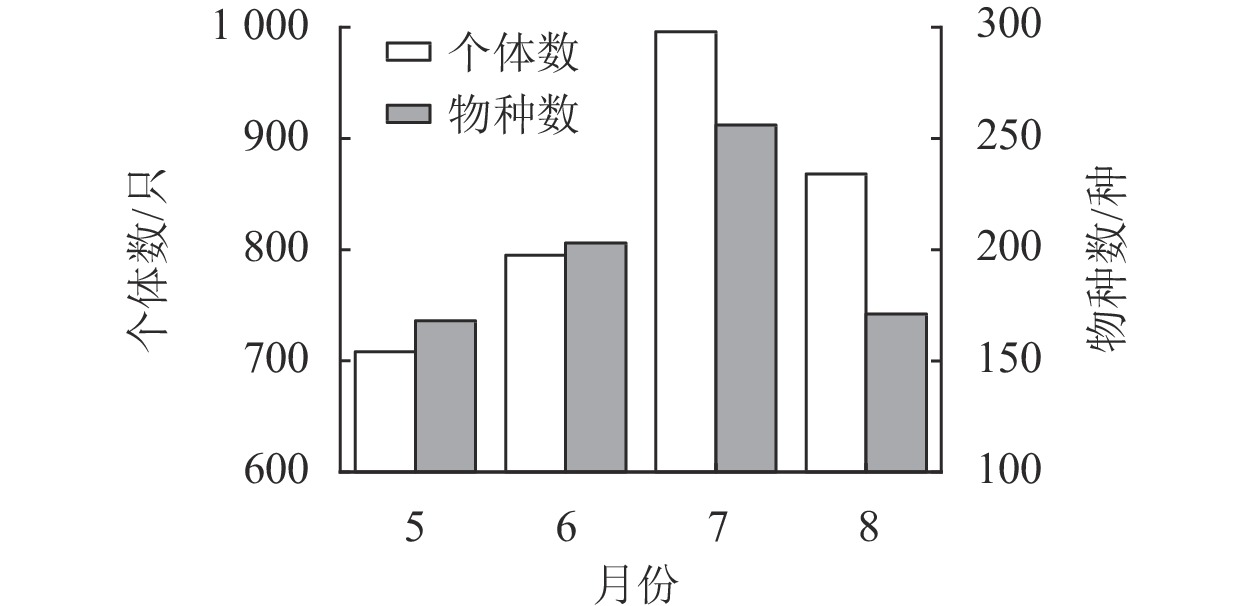
如图3所示:5月共采集大蛾类标本708只,隶属22科168种,6月共采集大蛾类标本795只,隶属24科203种,7月共采集大蛾类标本996只,隶属24科256种,8月共采集大蛾类标本868只,隶属23科171种。通过对比分析发现:7月大蛾类的物种数和个体数均最大,5月最小。其中,7和8月大蛾类种群的物种数和个体数存在差异。
-
如表4所示:天目山大蛾类种群的Simpson指数、Shannon指数、Pielou均匀度和Margalef丰富度的变化趋势一致,均在5和6月逐渐递增,7月最大,之后开始下降。说明大蛾类种群的物种数和个体数在均匀度指数上都是先增加后减少,均匀度越高则多样性越稳定,均匀度从大到小依次为7、6、5、8月。
月份 个体
数/只Simpson
指数Shannon
指数Pielou
均匀度Margalef
丰富度5 708 0.798 2.162 0.329 2.668 6 795 0.819 2.263 0.339 3.231 7 996 0.819 2.438 0.353 3.534 8 868 0.788 2.210 0.327 2.876 Table 4. New diversity of large moth species in different months
-
本研究表明:天目山大蛾类种群多样性随着海拔高度的上升呈先增加后减少的趋势,在海拔600~800 m达到最大值。这与张瀚文等[1]的研究结果不一致,但与孙儒泳[13]的研究结果类似。这可能与天目山不同海拔的森林环境效益有关[14]。海拔0~400 m由于在保护区外,人为干扰严重,导致天目山生物多样性降低。海拔400~1 000 m在保护区内,物种多样性增加[15]。海拔1 000~1 600 m由于人为防火道的设立,再加上高大乔木的植被类型逐渐转换为落叶矮林和毛竹Phyllostachys edulis林,大蛾类种群的生物多样性降低。
除此之外,本研究还发现许多西部以及中部地区分布的大蛾类,例如粉红边尺蛾Leptomiza crenularia、灰沙黄碟尺蛾Thinopteryx delectans和白肩天蛾Rhagastis mongoliana mongoliana等[16]。此外还发现了青球箩纹蛾Brahmaea hearseyi、胖夜蛾Orthogonia sera、修虎蛾Sarbanissa transiens、平背天蛾Cechenena minor、椴六点天蛾Marumba dyras、金双点螟Orybina regalis等常见且种群数较少的大蛾类种类,这些物种对生境质量要求较高,森林环境变化对该大蛾类多样性影响明显[17]。由此可见天目山大蛾类物种丰富,生态环境较好,为绝大多数生物提供了较好的栖息地[18]。
-
中度干扰假说是指中等条件有利于提高大蛾类种群稳定性[19],对天目山8个不同海拔梯度的大蛾类种群多样性分析发现:人为环境的干扰也是影响大蛾类种群稳定的重要因素。在海拔600~1 000 m的梯度上,由于受到轻度人为干扰,大蛾类个体数量、物种数和多样性指数较高,大蛾类种群较稳定。海拔0~600、1 200~1 600 m梯度上分别受到重度人为干扰和无人为干扰,大蛾类个体数、物种数和多样性指数较低,大蛾类种群不稳定,这也印证了中度干扰有利于提高大蛾类种群稳定性。
-
天目山大蛾类种群不同月份的个体数和物种数的变化趋势基本一致。这种现象可能与天目山气温变化和植被群落丰富度有关[20]。7月的物种数和个体数最多,其次是6、5、8月,这可能是7月是常绿阔叶林植被生长最为茂盛的阶段,此阶段更适宜大蛾类种群的发育繁殖。表明大蛾类种群对环境变化敏感,物种数差距大的同时多样性指数和均匀度指数也存在一定的差异,因此将大蛾类种群作为指示生物,对天目山海拔梯度的比较分析具有一定的代表性。
-
浙江天目山国家级自然保护区管理局杨淑贞教授级高级工程师对本研究给予大力支持,在此感谢!
Population diversity and temporal dynamics of large moths at different altitudes in Mount Tianmu
doi: 10.11833/j.issn.2095-0756.20230469
- Received Date: 2023-09-15
- Accepted Date: 2024-01-25
- Rev Recd Date: 2024-01-16
- Available Online: 2024-05-22
- Publish Date: 2024-05-22
-
Key words:
- altitude /
- large moth population /
- diversity analysis /
- temporal dynamics /
- Mount Tianmu
Abstract:
| Citation: | HU Ruiqi, FANG Weijun, WANG Yiping. Population diversity and temporal dynamics of large moths at different altitudes in Mount Tianmu[J]. Journal of Zhejiang A&F University, 2024, 41(3): 535-541. DOI: 10.11833/j.issn.2095-0756.20230469 |


 DownLoad:

