-
种群的年龄结构和空间分布格局是体现植物群落特征的2个重要参数,对种群的生长、发育、资源利用等有重要的影响[1]。通过分析种群的空间分布格局,有助于了解种群的生物学特性、生态学过程以及种群与环境因子之间的相互关系[1−3]。不同植物种群的空间分布格局各不相同,同一物种不同个体的分布也有明显区别[4]。例如1个物种在小范围内可能呈集群分布的格局,但从大范围上看,这一物种有可能为随机分布或者均匀分布;又例如不同物种之间的关系可能在某种空间尺度内是正相关,但在另一种空间尺度内则可能是负关联或者是无关联[5−6]。点格局分析方法是RIPLEY[7]在1977年提出的,该方法在拟合分析的过程中,最大限度利用种群内物种的空间位置信息,分析任意尺度下(空间范围内)的种群分布格局或不同对象之间的关联性。该方法的检验能力比传统的分析方法强,已广泛应用于种群空间分布格局的研究领域。近几十年来,许多学者采用点格局分析法,研究了内蒙古乌拉山[8]、华北关帝山[9]、东北长白山[10]、新疆天山[11]、北京东灵山[12]、山西灵空山[13]等地区的植物种群空间分布格局及其关联性。紫楠Phoebe sheareri群落的天然分布区地理位置跨度大,包括江苏、浙江、江西、湖南、贵州、广西等6个省份(自治区)的16个县(区),地理区划属于华东、华中、华南和西南地区,植被区划属于亚热带常绿阔叶林区域[14]。紫楠木材坚硬、耐腐;根、枝、叶可供医药或工用,经济价值甚高。叶大荫浓,外形端正且美观,适宜作为庭荫树、绿化树或者风景树,同时还有较好的防风、防火作用,可以作为防护林带使用。目前对紫楠在群落与种群数量以及空间分布等生态学上的研究甚少。因此,本研究分析了天目山自然保护区紫楠种群年龄结构、空间分布格局,并探讨了紫楠种群的动态规律及其影响机制,以期为天目山地区紫楠种群的保护与森林管理提供依据。
-
天目山国家级自然保护区(30°18′30″~30°24′55″N,119°24′11″~119°28′21″E)地处浙江省西北部,位于杭州市临安区境内。景区内天目山主峰——仙人顶海拔1 506 m,总面积约4 284 hm2。年平均降水量为1 390~1 870 mm,年平均气温为8.8~14.8 ℃。该自然保护区森林植被丰茂、生物多样性较高。天目山的紫楠种群主要分布在海拔800 m以下区域,由于保护区严格管理,人类活动的痕迹较少,生长状况接近自然状态。
-
2012年8月在浙江省天目山国家级自然保护区选择典型常绿阔叶林,建立1块1 hm2 (100 m×100 m)动态监测研究样地。样地地理位置位于30°19′48.360″N,119°26′9.546″E,海拔为588.98 m。将样地的西南角作为直角坐标系的原点,自西向东为坐标系的横轴,由南向北为坐标系的纵轴,使用南方测绘NTS-300R全站仪将整个样地划分为25个20 m×20 m的小样方,于2018年6月对样地内胸径≥1.0 cm的每株木本植物进行定位测量,记录物种名称、胸径、高度、冠幅、枝下高、生长状况等特征。调查发现,样地内共有木本植物90种,共计2 282株,主要树种见表1。
表 1 样地内主要物种重要值
Table 1. Important values of major species in the plot
物种 重要值 株数/株 比例/% 物种 重要值 株数/株 比例/% 紫楠 Phoebe sheareri 16.32 599 26.25 豹皮樟Litsea coreana 2.21 51 2.23 杉木 Cunninghamia lanceolata 12.31 134 5.87 香桂 Cinnamomum subavenium 2.00 61 2.67 榧树 Torreya grandis 6.56 176 7.71 窄基红褐柃 Eurya rubiginosa 1.78 74 3.24 青钱柳 Cyclocarya paliurus 6.06 67 2.94 紫弹树 Celtis biondii 1.75 24 1.05 细叶青冈 Cyclobalanopsis gracilis 5.85 212 9.29 小叶青冈 Cyclobalanopsis myrsinifolia 1.55 40 1.75 毛柄连蕊茶 Camellia fraterna 4.96 226 9.90 金钱松 Pseudolarix amabilis 1.23 5 0.22 糙叶树 Aphananthe aspera 3.51 63 2.76 枫香 Liquidambar formosana 1.15 10 0.44 微毛柃 Eurya hebeclados 3.37 128 5.61 华桑 Morus cathayana 1.10 13 0.57 柳杉 Cryptomeria fortunei 3.32 11 0.48 天目木兰 Magnolia amoena 1.10 13 0.57 短尾柯 Lithocarpus brevicaudatus 2.86 67 2.94 星毛稠李 Padus stellipila 1.05 11 0.48 -
以紫楠个体的胸径作为代表紫楠树龄的指标[15]。参照林木径级结构的划分标准,按胸径(DBH)定义为5个径级,即径级1、径级2、径级3、径级4、径级5。样地内紫楠种群结构特征见表2。
表 2 样地内紫楠种群结构特征
Table 2. Population structure characteristics of P. sheareri in the plot
径级 胸径(DBH) 株数/株 平均胸径/cm 平均树高/m 平均冠幅(东西)/m 平均冠幅(南北)/m 1 1.0 cm≤DBH<2.5 cm 84 1.8 2.3 1.5 1.5 2 2.5 cm≤DBH<10.0 cm 329 5.9 5.5 2.8 2.7 3 10.0 cm≤DBH<20.0 cm 142 13.7 9.7 4.3 4.3 4 20.0 cm≤DBH<30.0 cm 27 24.1 12.4 6.0 5.7 5 DBH≥30.0 cm 17 38.4 16.1 6.2 6.5 -
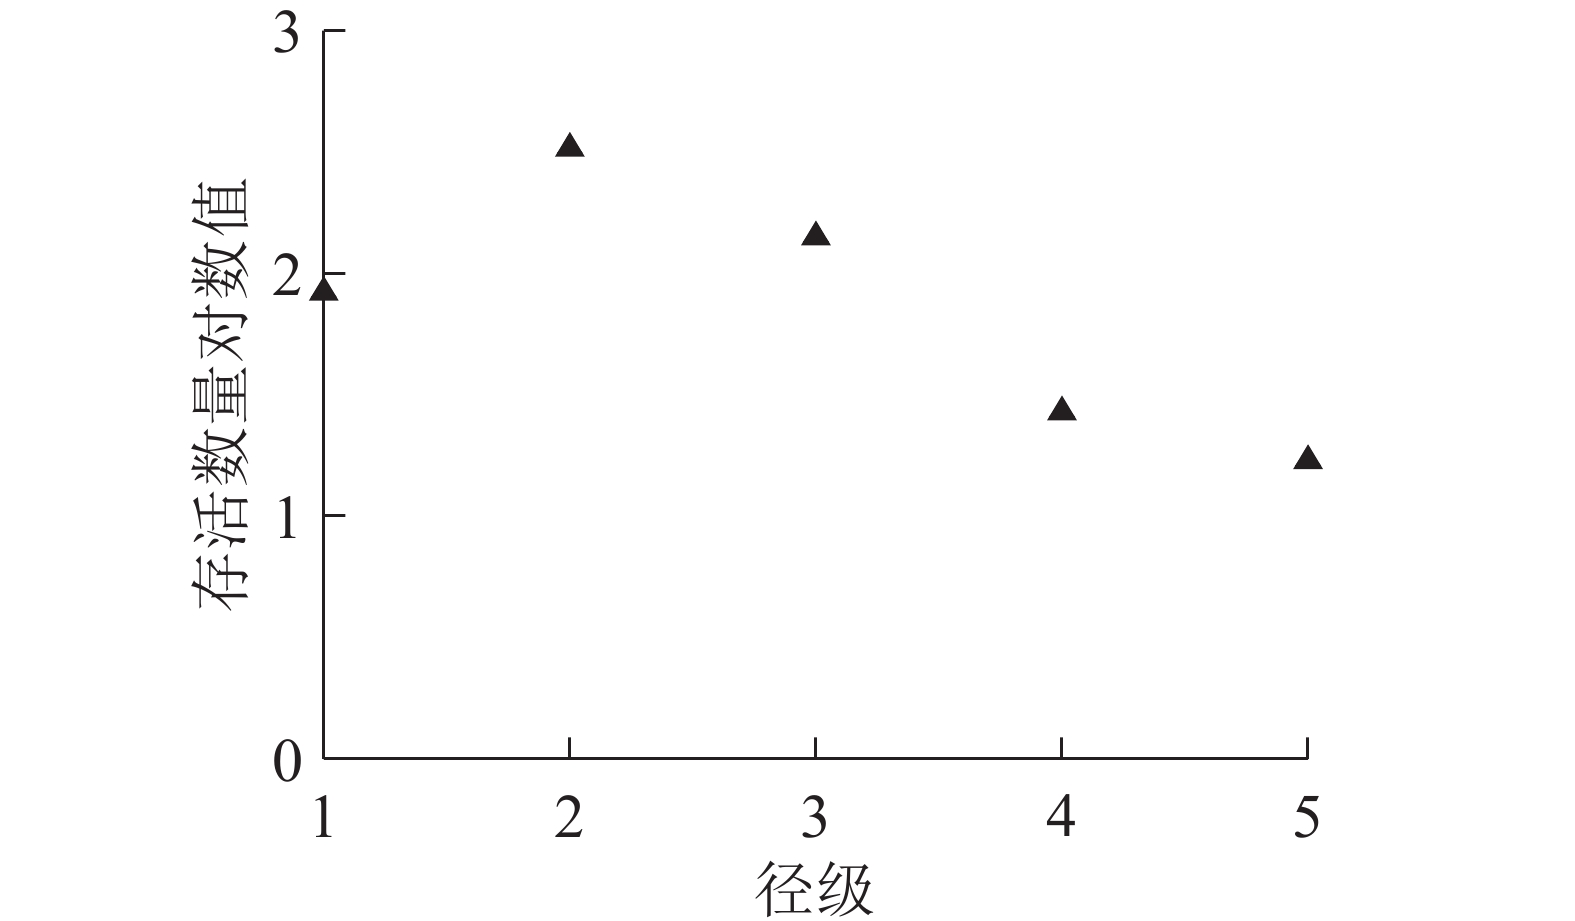
存活曲线是以种群存活数量的对数值为纵坐标,以年龄为横坐标,把每个种群的死亡和存活情况绘成1条曲线,反映物种个体从幼体到老年所能存活的比率。一般可分为3种基本类型:①DeeveyⅠ型。曲线凸型,表示该种群幼体存活率高,老年个体存活率低,生命周期结束前只有少数个体死亡;②DeeveyⅡ型。曲线呈对角线型,表示该种群在整个生存周期中保持了稳定的死亡率;③DeeveyⅢ型。曲线凹型,表示该种群幼体死亡率较高[16]。
-
1977年RIPLEY[7]第1次使用统计学理论描述点格局分析法。1983年DIGGLE[17]将点格局分析归纳总结为函数K(t):
$$ K(t) = {\lambda ^{ - 1}}\text{。} $$ (1) 式(1)中:t表示空间尺度;
$\lambda $ 表示某一植物个体数在单位面积上的均值;K(t)表示从某一点起,距离t内的期望点数。DIGGLE[17]在实践中,提出了K(t)的估计值$\hat K(t)$ :$$ \hat K(t) = \left(\frac{A}{{{n^2}}}\right)\sum\limits_{i = 1}^n {\sum\limits_{j = 1}^n {\frac{1}{{{W_{i,j}}}}} } I({u_{i,j}}), \; (i \ne j)\text{。} $$ (2) 式(2)中:A表示样地平面面积;n为总点数(某径级的植物立木个体数);
${u_{i,j}}$ 表示i、j 2个不同个体之间的直线距离,${u_{i,j}} {\text{≤} }t$ 时,$I({u_{i,j}})$ =1;${u_{i,j}} $ >t时,$I({u_{i,j}})$ =0;${W_{i,j}}$ 表示以某株植物$i$ 为圆心,${u_{i,j}}$ 为半径的圆在样地中的圆弧与整个圆周长的比例。在式(2)中引入${W_{i,j}}$ 来消除样地边界带来的影响。在随机分布情况下,
$\sqrt {\hat K(t)/{\text{π}} } $ 和$t$ 呈正比,故引入新的参数$H(t)$ :$$ H(t) = \sqrt {\hat K(t)/{\text{π}} } - t\text{。} $$ (3) 式(3)中:
$H(t)$ 表示点格局与空间尺度$t$ 的关系。在随机分布下,任何空间尺度t下的$H(t)$ 恒等于0;$H(t)$ >0表示植物种群在空间内集群分布;$H(t) $ <0表示植物种群在空间内均匀分布。在众多零假设模型中,本研究使用完全空间随机模型(CSR)对函数
$H(t)$ 的值进行检验。用蒙特卡洛方法可以拟合出一组随机分布的植物种群空间分布坐标,以此计算在任意$t$ 下的$H(t)$ 。重新拟合一组坐标,可以得到一组新的$H(t)$ 值。拟合次数达到一定次数时,从多种$H(t)$ 中选出不同$t$ 下$H(t)$ 的最大值和最小值。分别将最大值和最小值连接成2条曲线,包迹线曲线所包含的区域即为随机分布的置信区间。若$H(t)$ 在包迹线内,则表明物种是随机分布的;若$H(t)$ 在包迹线外,则物种是明显偏离了随机分布。大量的实践表明,若要置信区间的可信度大于95%时,则至少需要拟合20次;若要大于99%,则至少需要拟合100次。 -
考虑不同径级的植物个体在
$t$ 内的数目,${\hat K_{p,q}}(t)$ 的计算原理与式(2)相似,为:$$ {\hat K_{p,q}}(t) = \frac{A}{{{n_p}{n_q}}}\sum\limits_{i = 1}^{{n_1}} {\sum\limits_{j = 1}^{{n_2}} {\frac{1}{{{W_{i,j}}}}} } I({u_{i,j}})\text{。} $$ (4) 式(4)中:
${\hat K_{p,q}}(t)$ 表示径级$p$ 和径级$q$ 之间的K(t)估计值($p$ =1,2,3,4,5;$q$ =1,2,3,4,5,且$p \ne q$ );${n_p}$ 表示径级$p$ 的植物个体数;${n_q}$ 表示径级$q$ 的植物个体数,如果下标为2, 3,则表示径级2与径级3之间的K(t)估计值,依次类推;其他参数的含义与式(2)相同。则${H_{p,q}}(t)$ 为:$$ {H_{p,q}}(t) = \sqrt {{{\hat K}_{p,q}}(t)/\text{π} } - t\text{。} $$ (5) 式(5)中:
${H_{p,q}}(t)$ 表示径级$p$ 与径级$q$ 之间的点格局与空间尺度$t$ 之间的关系,其他同理类推。本研究使用蒙特卡洛方法检验不同径级之间的关联性。首先,分别拟合出2组随机分布的植物种群空间分布坐标,植株数量与同一径级所包含的植株数量相同;其次,通过式(4)和式(5)计算任意t下的
${H_{p,q}}(t)$ ;然后,再次拟合出2组坐标,重复计算任意t下的${H_{p,q}}(t)$ ,共拟合20次;最后,从20条曲线中选取不同尺度t下的最大值(最小值),连接全部最大值(最小值),得到上(下)包迹线。假设2个径级之间的曲线大于上包迹线,则为显著正关联;小于上包迹线,则无显著关联。假设2个径级之间的曲线小于下包迹线,则为显著负关联;大于下包迹线,则无显著关联。由大量的实践经验可知:使用蒙特卡洛方法拟合20次的置信区间可信度大于95%。
-
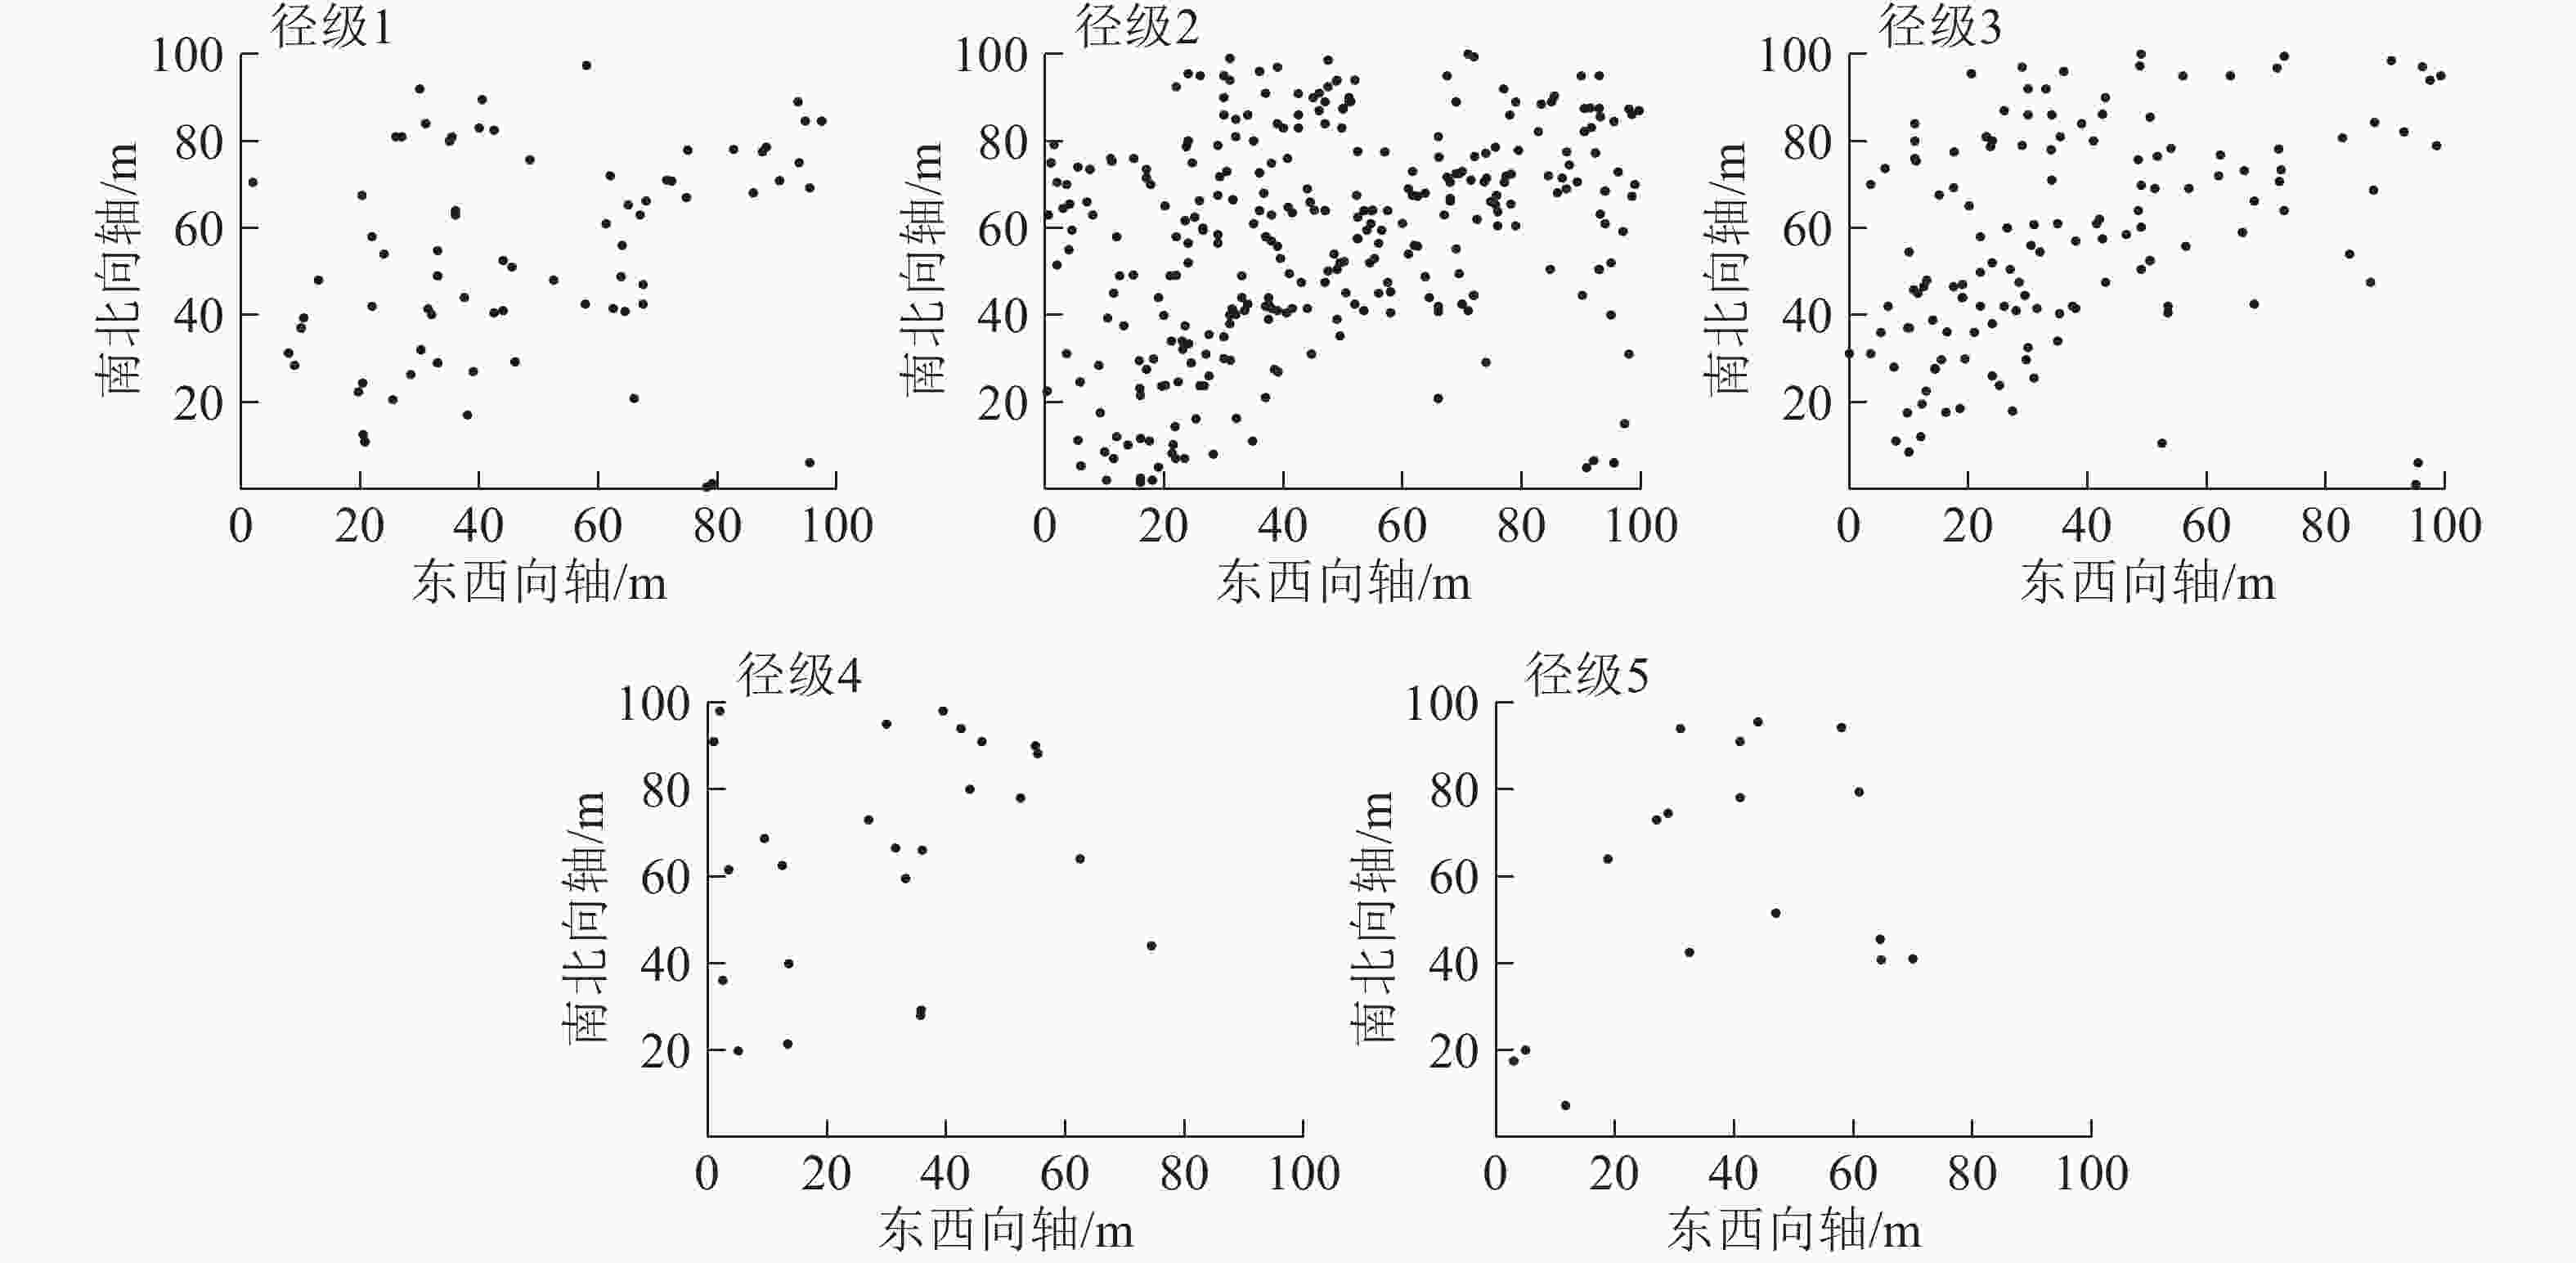
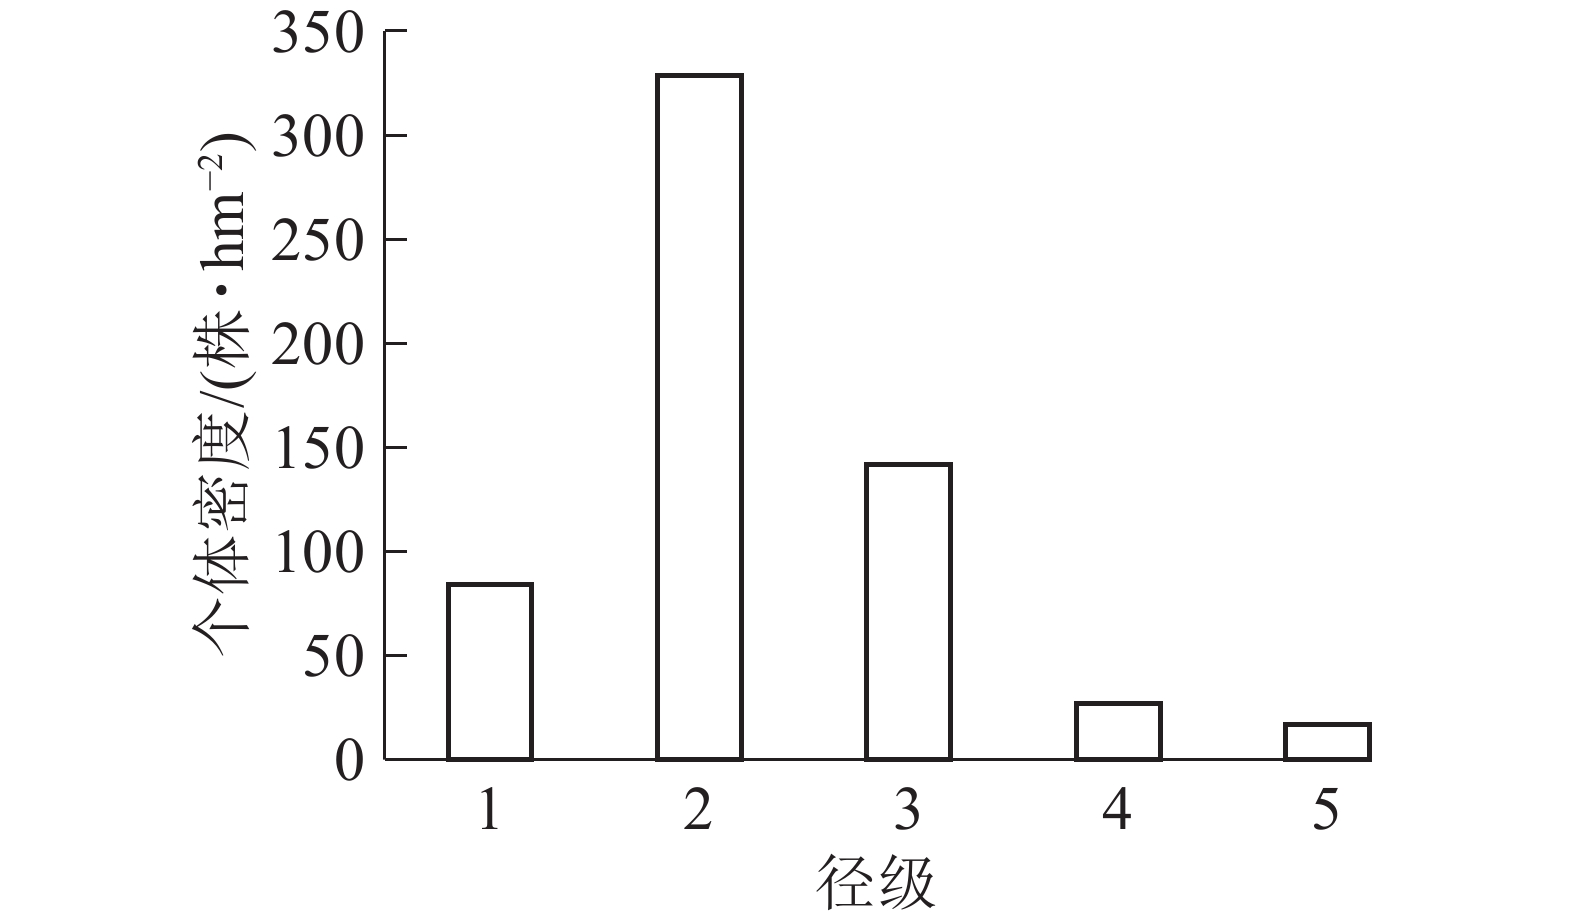
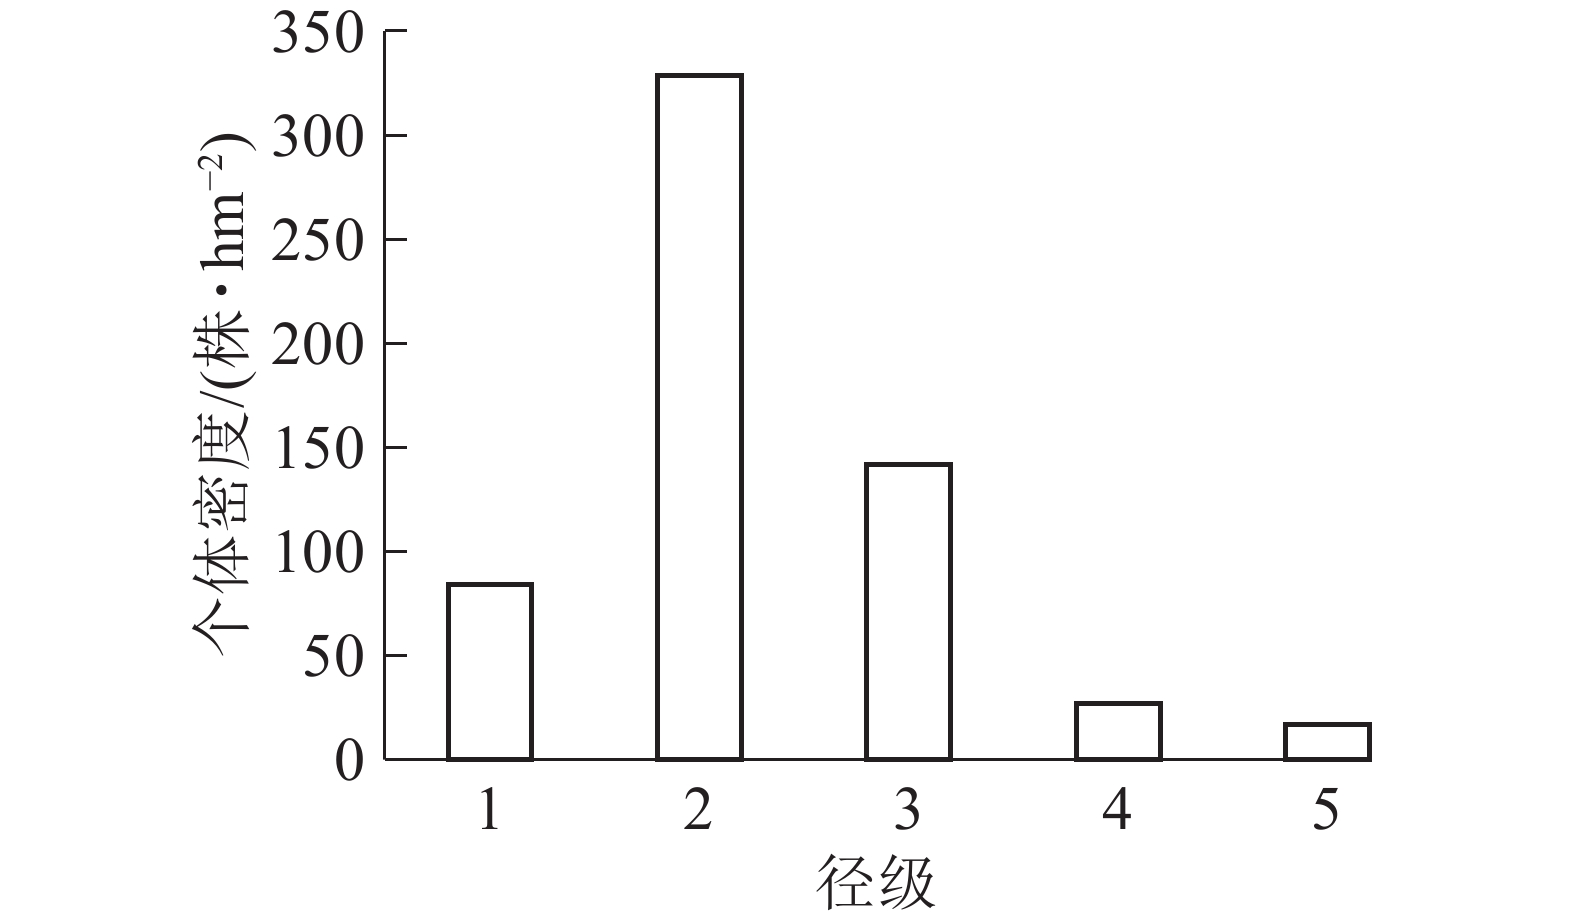
样地内紫楠合计599株,占调查木本植物总数的26.25%。如图1所示:个体密度径级1为84株·hm−2,占14.02%;径级2为329株·hm−2,占54.92%;径级3为142株·hm−2,占25.40%;径级4为27株·hm−2,占4.83%;径级5为17株·hm−2,占3.04%。
从图2可见:5个径级紫楠个体在100 m×100 m样地内的空间分布密度,从大到小依次为径级2、径级3、径级1、径级4、径级5。
-
制作紫楠种群的存活曲线(图3)时,以径级为横轴,存活数量对数值为纵轴。参照Deevey存活曲线与紫楠种群的存活曲线比较发现:紫楠种群的存活曲线介于Deevey Ⅰ和Ⅱ型曲线之间,靠近Deevey Ⅰ型。说明紫楠种群在接近生理寿命之前只有少数个体死亡。
-
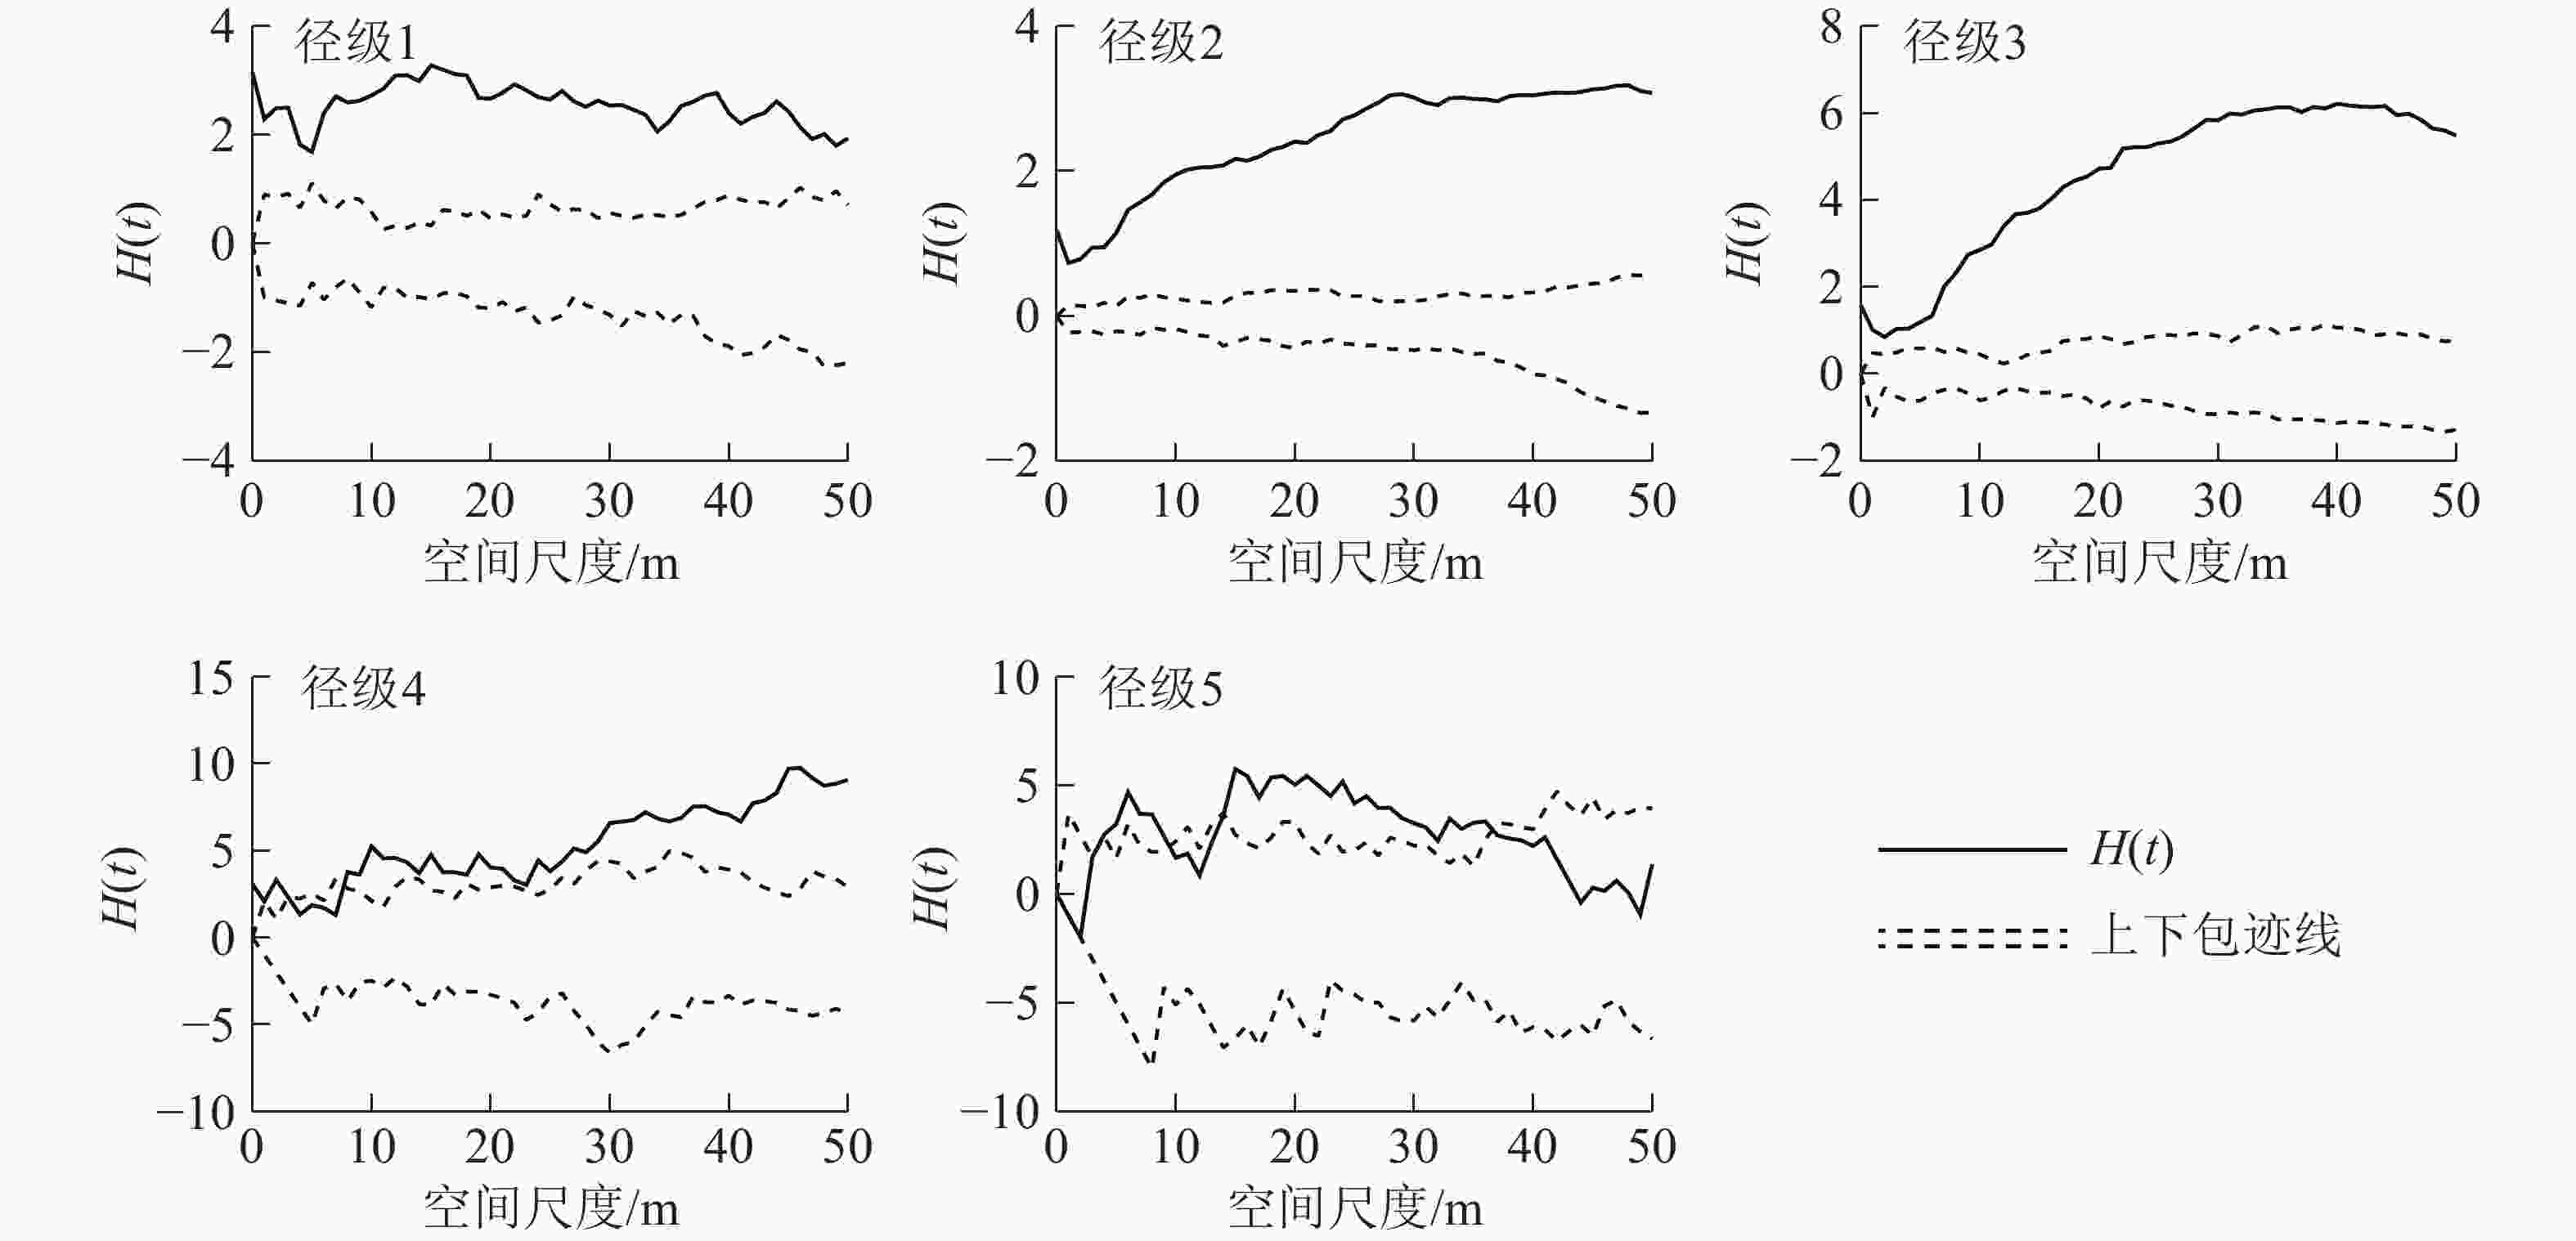
如图4所示:使用CSR假设模型对样地内紫楠种群进行点格局分析,径级2、径级3、径级4阶段植株的H(t)函数取值在整个尺度内呈增长趋势。径级1和径级5阶段植株的H(t)函数取值在大尺度内减小。
-
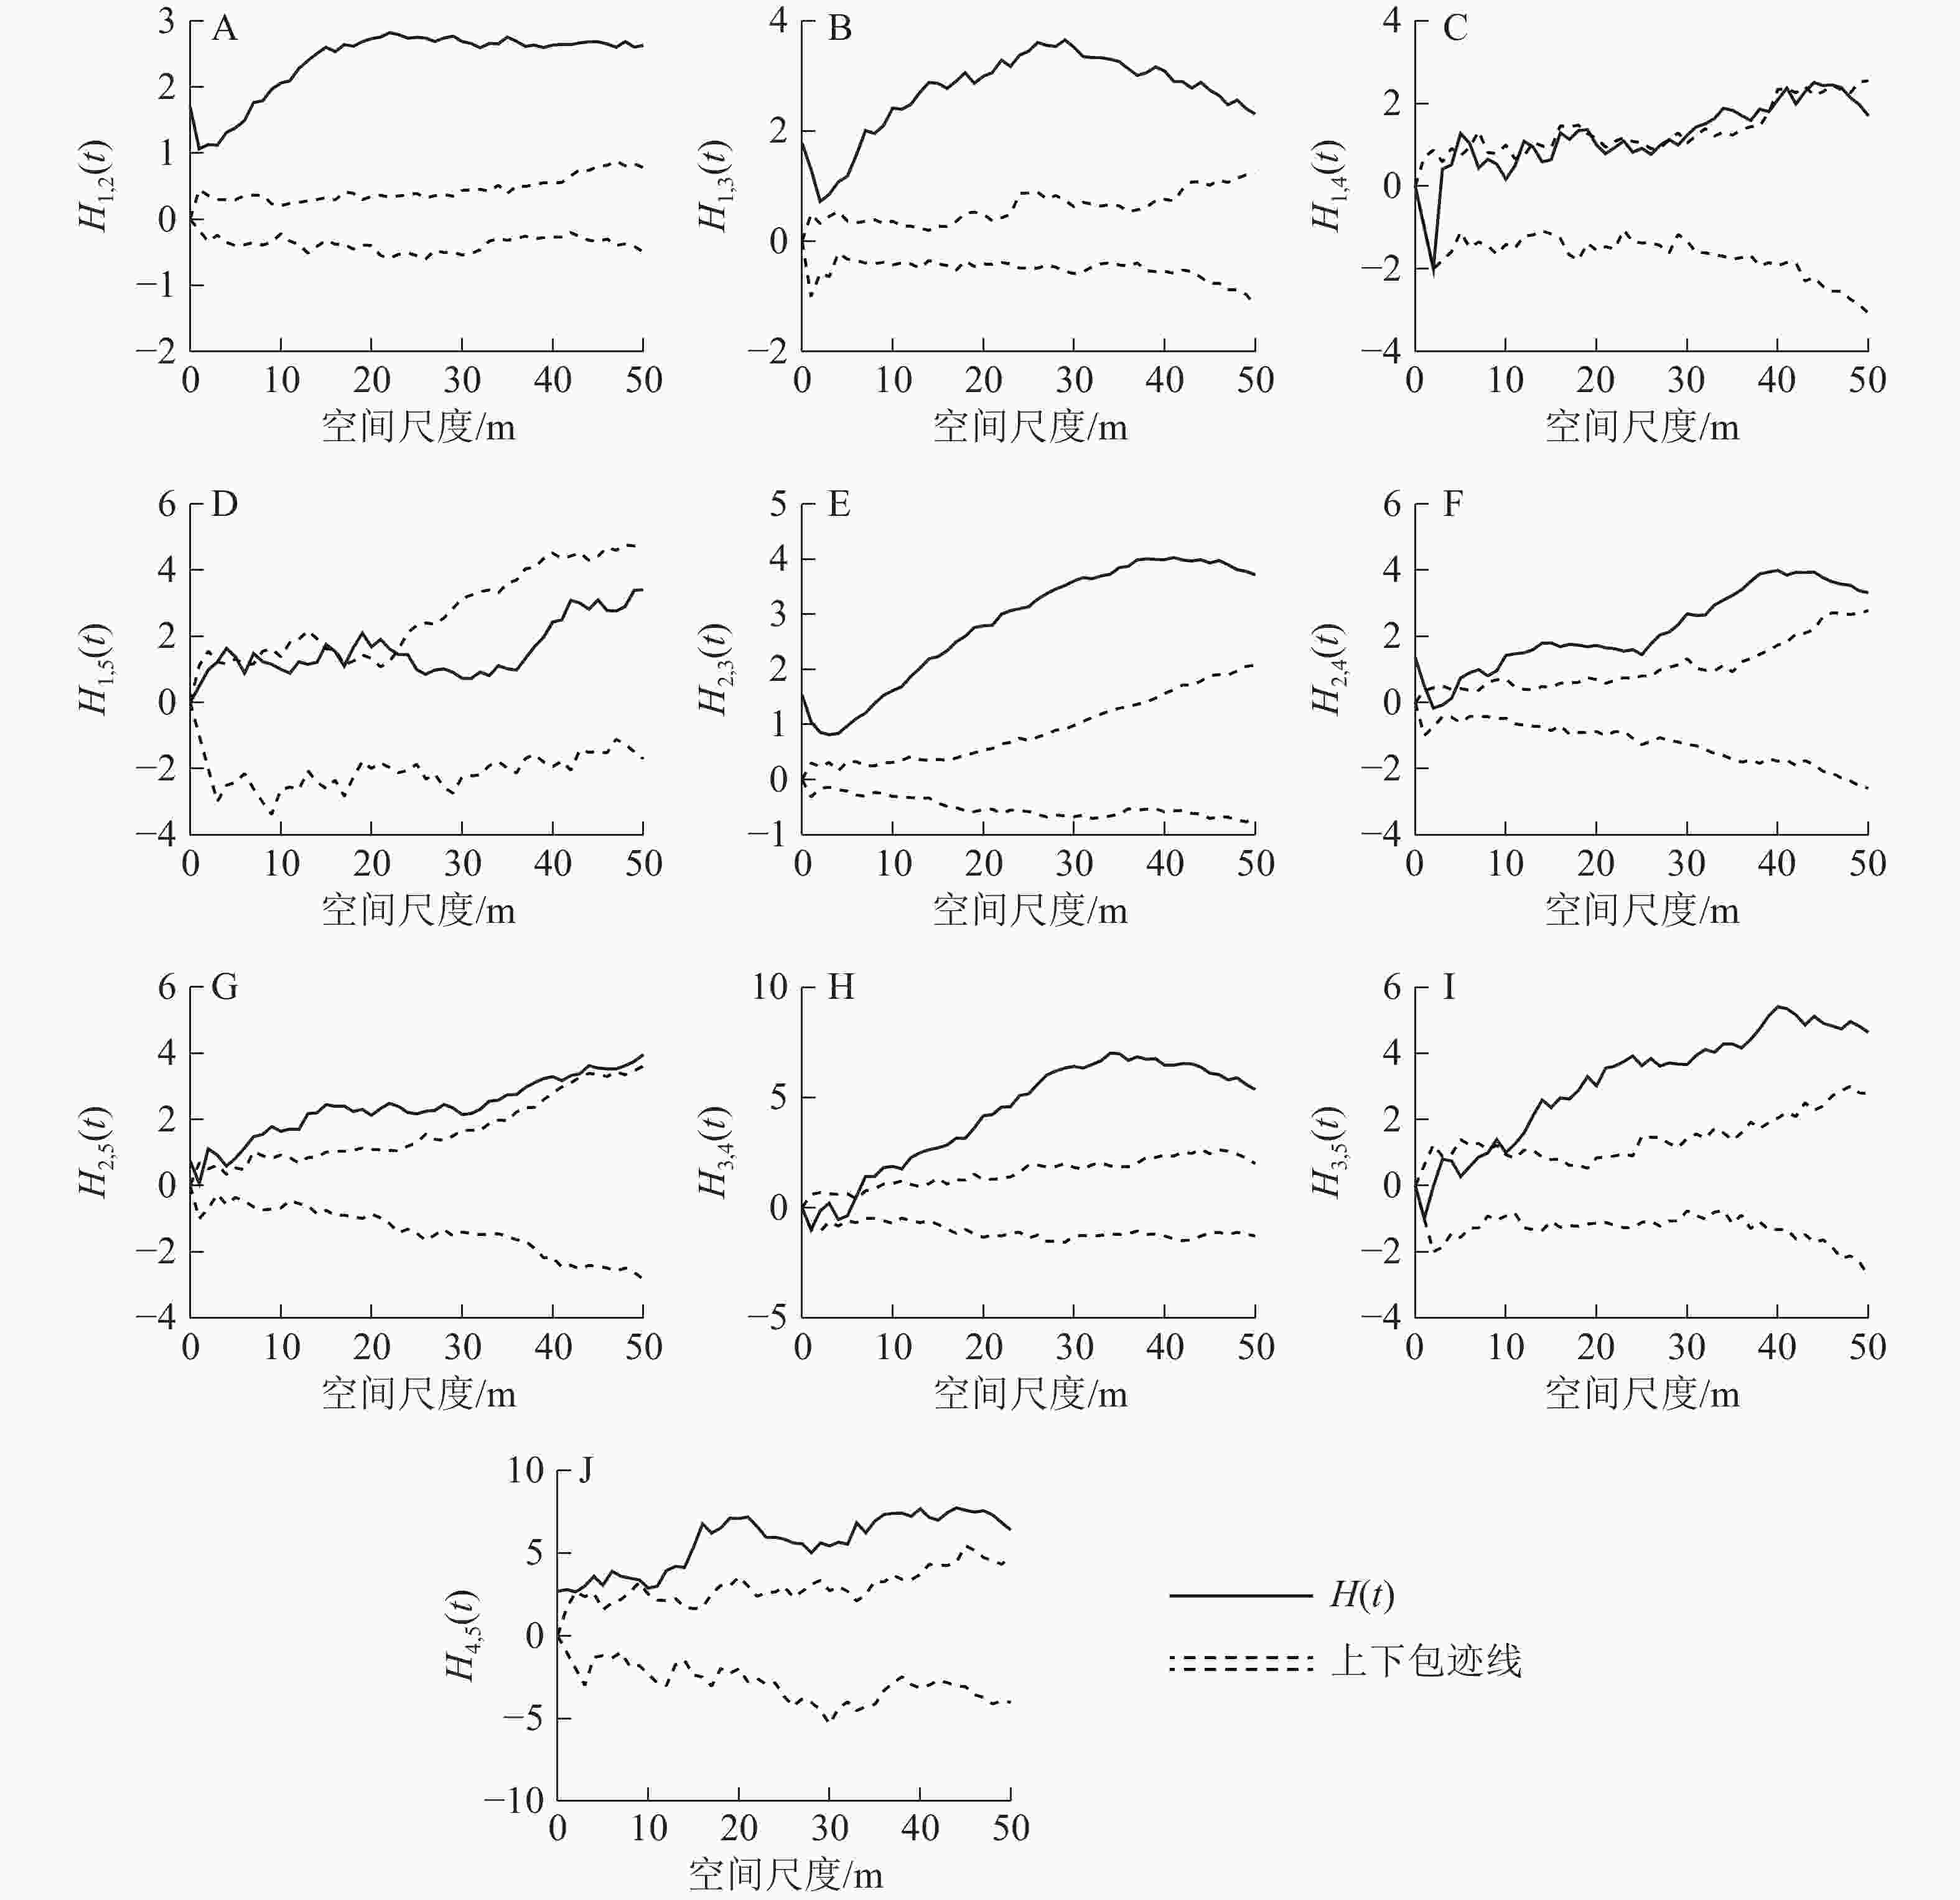
径级1和径级2之间呈显著的正关联关系(图5A)。径级1和径级3个体在小尺度接近显著的正关联水平,之后随着尺度的增大,正关联性也越大(图5B)。径级1和径级4个体随着尺度由小到大从接近显著负关联水平逐渐过渡到无关联,再到接近显著正关联水平(图5C)。两者在0~3 m尺度下达显著负关联水平,在3~6 m尺度下两者无关联,在6~50 m尺度内两者达到或者接近显著正关联水平。径级1和径级5个体在小尺度内两者接近显著正关联水平,在大尺度内两者无显著关联(图5D)。在所有尺度下,径级2和径级3的正关联性十分显著(图5E)。在小尺度内,径级2和径级4无显著关联;在9~50 m尺度内,两者为显著正关联关系(图5F)。在小尺度内,径级2和径级5之间的关系达到或者接近显著正关联水平;随着尺度增大,两者的正关联度越大,在35~50 m大尺度内正关联度又下降,恢复到接近显著正关联水平(图5G)。在小尺度内,径级3和径级4接近显著负关联水平;在尺度2~6 m内,两者无显著关联;在尺度6~50 m内,两者为显著正关联(图5H)。在小尺度内,径级3和径级5同样接近显著负关联水平;在2~4 m尺度内,则无显著关联性;在尺度4~14 m内的关联曲线与上包迹线在大部分尺度下互相交错,关联达到或者接近显著正关联水平,在尺度14~50 m之内,两者为显著正关联(图5I)。径级4和径级5在0~12 m尺度下达到或者接近显著正关联水平;在尺度12~50 m内为显著正关联(图5J)。
-
从天目山紫楠种群年龄结构来看,低龄(即径级1、径级2)个体数占样方内紫楠总统计量的68.95%。其次是中龄个体(径级3),占23.71%,高龄(即径级4、径级5)个体树木比较少,占7.34%。各径级比例符合增长性种群的年龄结构变化规律,种群内存在着大量可以用来更新换代的幼苗和幼树,且靠近Deevey I型的存活曲线也说明了其大多数个体能活到平均的生理寿命。因此,天目山紫楠种群属于增长型的发展模式。
-
天目山紫楠种群各径级都呈集群分布,其中径级1、径级2、径级3尤其明显。主要原因如下:①紫楠属耐阴树种。健康的紫楠种子呈圆润的椭圆形状,有一定的质量,主要通过重力和动物传播。种子成熟后掉落,通常都聚集在以母株为中心的范围内,或是聚集在动物巢穴周围。除此之外,老年个体也会通过根部萌孽产生新个体。②植物为了提高种群的生存和竞争力,低龄个体在水分、阳光、土壤等生态因子以及与别的种群的竞争中处于劣势地位,聚集可以提高其竞争能力和对不良环境的抵御能力。③小生境的异质作用,如环境因子的差异,包括局部的土壤、地形、植被等。同一物种不同个体对生长所需要的环境条件要求在大体上是具有一致性的。所以小生境的异质性也会致使幼树相对集群分布。
随着树龄的增长,紫楠个体聚集度逐渐降低,并趋向随机分布。引起这种变化主要是受到生物学特征以及环境资源限制使种内和种间竞争日益凸显的影响。例如径级4、径级5个体树冠基本定型,根系已足够发达,对各种资源(阳光、水分、土壤等)的需求也愈大。随着个体的不断成熟,出现自疏效应,因此高龄个体集群分布显著度逐渐降低。
-
同一物种不同生长阶段的个体在空间分布上的相互关联性,是对一定时期内组成植物种群个体之间相互关系的描述。这种关系不仅是指空间分布关系,也包含了个体间的功能关系,反映种群内个体间的相互作用[18−19]。
天目山紫楠径级1、径级2、径级3在所有尺度内都呈显著正关联,并且随着尺度的增大关联性愈大。由于紫楠主要以种子和高龄个体根部萌孽繁殖,但低龄、中龄个体在生长过程中与高龄个体在资源的获取上出现竞争。大径级紫楠个体的树荫不利于小径级幼龄紫楠个体的生长,尤其在小尺度下阻碍作用更明显。因此低龄、中龄与高龄个体在小尺度上无显著关联,甚至出现负关联,但在大尺度上多数个体仍然为正关联,例如径级2和径级4,径级1和径级5等。
高龄个体为了争夺生存空间,存在着相互排斥的生态关系,因此在一定范围内无显著关联。虽然高龄个体存在竞争关系,但对环境的要求具有一致性。空间上的交错分布有利于充分利用资源,也有利于整个种群在种间竞争中取得优势,因此高龄个体在大尺度上处于正关联状态。综上所述,种群不同生长阶段个体的分布格局、关联性是种群和群落与环境长期相互作用的结果,是种群结构、群落结构合理性的体现[20−21]。
种群空间分布格局具有尺度变异性,这种性质受到多种因素的制约,例如种内或种间竞争[13]、生境的异质性和斑块性等[22−24]。在本研究中天目山紫楠种群低龄和中龄个体主要呈现集群分布特征;高龄个体从集群分布逐渐趋向于随机分布。这一现象主要与紫楠的生物学特性还有种内种间竞争有关。天目山自然保护区环境的均匀性、干扰程度、历史等因素差异都不突出,因此紫楠各径级间关系密切,以正关联为主。
Age structure and spatial point pattern of Phoebe sheareri population in Mount Tianmu
-
摘要:
目的 研究天目山紫楠Phoebe sheareri种群年龄结构和空间分布格局,有利于更好地保护天目山紫楠种群,为森林管理提供依据。 方法 基于浙江省天目山常绿阔叶林1 hm2(100 m×100 m)样地调查数据,分析了优势种紫楠种群的年龄结构,并按胸径(DBH)将其分为5个径级,分别为径级1(1.0 cm≤DBH<2.5 cm)、径级2(2.5 cm≤DBH<10.0 cm)、径级3(10.0 cm≤DBH<20.0 cm)、径级4(20.0 cm≤DBH<30.0 cm)、径级5(DBH≥30.0 cm)。同时,应用点格局方法分析了不同径级个体的空间分布格局以及空间关联性。 结果 ①径级1和径级2低龄个体较多,占总统计量的68.95%,径级3个体占23.71%,径级4和径级5高龄个体较少,占7.34%。种群的存活曲线接近DeeveyⅠ型,属于增长型发展模式。②径级1、径级2、径级3、径级4个体以聚集型分布为主,且随着研究尺度的增大,聚集性也越显著,径级5以随机分布为主。③各径级间关系密切,以正关联为主。从小尺度观察,径级1与径级4个体在0~5 m尺度内是负关联,径级3与径级4个体在0~8 m尺度内是负关联,径级3与径级5个体在0~4 m尺度内是负关联。除此之外,其他径级个体之间皆为正关联。从大尺度观察,天目山紫楠种群各径级个体之间基本都呈显著正关联。 结论 天目山紫楠种群属于增长型的发展模式,各径级都呈集群分布,不同径级间的关系密切,以正关联为主。图5表2参24 Abstract:Objective This research aims to study the age structure and spatial pattern of Phoebe sheareri population in Mount Tianmu, so as to better protect the population and provide basis for forest management. Method Based on the survey data of 1 hm2 (100 m×100 m) of evergreen broad-leaved forests in Mount Tianmu of Zhejiang Province, the age structure of dominant species P. sheareri population was analyzed. According to the diameter at breast height(DBH), the population was divided into five diameter classes: diameter class 1 (1.0 cm≤DBH<2.5 cm), diameter class 2 (2.5 cm≤DBH<10.0 cm), diameter class 3 (10.0 cm≤DBH<20.0 cm), diameter class 4 (20.0 cm≤DBH<30.0 cm), diameter class 5 (DBH≥30.0 cm). The point pattern method was used to analyze the spatial distribution pattern of P. sheareri and spatial correlation of individuals of different diameter classes. Result (1) 68.95% were young individuals in diameter class 1 and diameter class 2, 23.71% in diameter class 3, 7.34% in diameter class 4 and diameter class 5. The survival curve of the population was close to Deevey type I, belonging to the growth-oriented development model. (2) The individuals of diameter class 1, diameter class 2, diameter class 3 and diameter class 4 were mainly distributed in clusters, and with the increase of research scale, the aggregation was more significant, and diameter class 5 was mainly of random distribution. (3) There existed a close relationship between diameter classes, displaying a dominant positive correlation. In small scale observation, diameter class 1 and diameter class 4 were negatively correlated in the scale of 0−5 m, diameter class 3 and diameter class 4 were negatively correlated in the scale of 0−8 m, and diameter class 3 and diameter class 5 were negatively correlated in the scale of 0−4 m. All other diameter individuals were positively correlated. From the large-scale observation, there was a significant positive correlation between individuals of different sizes in P. sheareri population. Conclusion The population of P. sheareri in Mount Tianmu belongs to the growth-oriented development model, and each diameter class is distributed in clusters. The relationship between different diameter classes is close, displaying a dominant positive correlation. [Ch, 5 fig. 2 tab. 24 ref.] -
表 1 样地内主要物种重要值
Table 1. Important values of major species in the plot
物种 重要值 株数/株 比例/% 物种 重要值 株数/株 比例/% 紫楠 Phoebe sheareri 16.32 599 26.25 豹皮樟Litsea coreana 2.21 51 2.23 杉木 Cunninghamia lanceolata 12.31 134 5.87 香桂 Cinnamomum subavenium 2.00 61 2.67 榧树 Torreya grandis 6.56 176 7.71 窄基红褐柃 Eurya rubiginosa 1.78 74 3.24 青钱柳 Cyclocarya paliurus 6.06 67 2.94 紫弹树 Celtis biondii 1.75 24 1.05 细叶青冈 Cyclobalanopsis gracilis 5.85 212 9.29 小叶青冈 Cyclobalanopsis myrsinifolia 1.55 40 1.75 毛柄连蕊茶 Camellia fraterna 4.96 226 9.90 金钱松 Pseudolarix amabilis 1.23 5 0.22 糙叶树 Aphananthe aspera 3.51 63 2.76 枫香 Liquidambar formosana 1.15 10 0.44 微毛柃 Eurya hebeclados 3.37 128 5.61 华桑 Morus cathayana 1.10 13 0.57 柳杉 Cryptomeria fortunei 3.32 11 0.48 天目木兰 Magnolia amoena 1.10 13 0.57 短尾柯 Lithocarpus brevicaudatus 2.86 67 2.94 星毛稠李 Padus stellipila 1.05 11 0.48 表 2 样地内紫楠种群结构特征
Table 2. Population structure characteristics of P. sheareri in the plot
径级 胸径(DBH) 株数/株 平均胸径/cm 平均树高/m 平均冠幅(东西)/m 平均冠幅(南北)/m 1 1.0 cm≤DBH<2.5 cm 84 1.8 2.3 1.5 1.5 2 2.5 cm≤DBH<10.0 cm 329 5.9 5.5 2.8 2.7 3 10.0 cm≤DBH<20.0 cm 142 13.7 9.7 4.3 4.3 4 20.0 cm≤DBH<30.0 cm 27 24.1 12.4 6.0 5.7 5 DBH≥30.0 cm 17 38.4 16.1 6.2 6.5 -
[1] DALE M R T. Spatial Pattern Analysis in Plant Ecology[M]. Cambridge: Cambridge University Press, 1999. [2] DRUCKENBROD D L, SHUGART H H, DAVIES I. Spatial pattern and process in forest stands within the Virginia piedmont [J]. J Veg Sci, 2005, 16(1): 37 − 48. [3] 张金屯. 数量生态学[M]. 北京: 科学出版社, 2004: 264 − 268. [4] 李帅锋, 刘万德, 苏建荣, 等. 云南兰坪云南红豆杉种群年龄结构与空间分布格局分析[J]. 西北植物学报, 2013, 33(4): 792 − 799. LI Shuaifeng, LIU Wande, SU Jianrong, et al. Age structure and spatial distirbution patterns of Taxus yunnanensis population in Lanping County, Yunnan Province [J]. Acta Bot Boreali-Occident Sin, 2013, 33(4): 792 − 799. [5] 张金屯. 植物种群空间分布的点格局分析[J]. 植物生态学报, 1998, 22(4): 344 − 349. ZHANG Jintun. Analysis of spatial point pattern for plant species [J]. Acta Phytoecol Sin, 1998, 22(4): 344 − 349. [6] STERNER R W. Testing for life historical changes in spatial patterns of four tropical tree species [J]. J Ecol, 1986, 74(3): 621 − 633. [7] RIPLEY B D. Modeling spatial patterns [J]. J Royal Stat Soc Ser B, 1977, 39(2): 172 − 212. [8] 胡尔查, 王晓江, 张文军, 等. 乌拉山自然保护区白桦种群的年龄结构和点格局分析[J]. 生态学报, 2013, 33(9): 2867 − 2876. HU Ercha, WANG Xiaojiang, ZHANG Wenjun, et al. Age structure and point pattern of Butula platyphylla in Wulashan Natural Reserve of Inner Mongolia [J]. Acta Ecol Sin, 2013, 33(9): 2867 − 2876. [9] 闫海冰, 韩有志, 杨秀清, 等. 华北山地典型天然次生林群落的树种空间分布格局及其关联性[J]. 生态学报, 2010, 30(9): 2311 − 2321. YAN Haibing, HAN Youzhi, YANG Xiuqing, et al. Spatial distribution patterns and associations of tree species in typical natural secondary mountain forest communities of northern China [J]. Acta Ecol Sin, 2010, 30(9): 2311 − 2321. [10] 王蕾, 张春雨, 赵秀海. 长白山阔叶红松林的空间分布格局[J]. 林业科学, 2009, 45(5): 54 − 59. WANG Lei, ZHANG Chunyu, ZHAO Xiuhai. Spatial pattern of Korean pine broadleaved forests in Changbai Mountains [J]. Sci Silv Sin, 2009, 45(5): 54 − 59. [11] 张毓涛, 李吉玫, 常顺利, 等. 天山中部天山云杉种群空间分布格局及其与地形因子的关系[J]. 应用生态学报, 2011, 22(11): 2799 − 2806. ZHANG Yutao, LI Jimei, CHANG Shunli, et al. Spatial distribution pattern of Picea schrenkiana var. tianshanica population and its relationships with topographic factors in middle part of Tianshan Mountain [J]. Chin J Appl Ecol, 2011, 22(11): 2799 − 2806. [12] 张育新, 马克明, 祁建, 等. 北京东灵山海拔梯度上辽东栎种群结构和空间分布[J]. 生态学报, 2009, 29(6): 2789 − 2796. ZHANG Yuxin, MA Keming, QI Jian, et al. Size structure and spatial pattern of Quercus liaotungensis population along elevation gradient in Dongling Mountain, Beijing [J]. Acta Ecol Sin, 2009, 29(6): 2789 − 2796. [13] 伊力塔, 韩海荣, 程小琴, 等. 灵空山林区辽东栎(Quercus liaotungensis)种群空间分布格局[J]. 生态学报, 2008, 28(7): 3254 − 3261. Yilita, HAN Hairong, CHENG Xiaoqin, et al. Spatial distribution patterns of Quercus liaotungensis population in Lingkong Mountains [J]. Acta Ecol Sin, 2008, 28(7): 3254 − 3261. [14] 李军, 陆云峰, 杨安娜, 等. 紫楠天然群落物种多样性对不同干扰强度的响应[J]. 浙江农林大学学报, 2019, 36(2): 279 − 288. LI Jun, LU Yunfeng, YANG Anna, et al. Species diversity of natural Phoebe sheareri communities with different disturbance intensities [J]. J Zhejiang A&F Univ, 2019, 36(2): 279 − 288. [15] FROST I R H. Spatial pattern and size distribution of the animal-dispersed tree Quercus robur in two spruce-dominated forests [J]. Ecoscience, 2000, 7(1): 38 − 44. [16] 牛翠娟, 娄安如, 孙儒泳, 等. 基础生态学[M]. 2版. 北京: 高等教育出版社, 2007. [17] DIGGLE P J. Statistical Analysis of Spatial Point Patterns[M]. New York: Academic Press, 1983. [18] 王磊, 孙启武, 郝朝运, 等. 皖南山区南方红豆杉种群不同龄级立木的点格局分析[J]. 应用生态学报, 2010, 21(2): 272 − 278. WANG Lei, SUN Qiwu, HAO Chaoyun, et al. Point pattern analysis of different age-class Taxus chinensis var. mairei individuals in mountainous area of southern Anhui Province [J]. Chin J Appl Ecol, 2010, 21(2): 272 − 278. [19] 高福元, 赵成章, 卓马兰草. 高寒退化草地不同海拔梯度狼毒种群分布格局及空间关联性[J]. 生态学报, 2014, 34(3): 605 − 612. GAO Fuyuan, ZHAO Chengzhang, ZHUOMA Lancao. Spatial distribution and spatial association of Stellera chamaejasme population in the different altitude in in degraded alpine grassland [J]. Acta Ecol Sin, 2014, 34(3): 605 − 612. [20] 张金屯, 孟东平. 芦芽山华北落叶松林不同龄级立木的点格局分析[J]. 生态学报, 2004, 24(1): 35 − 40. ZHANG Jintun, MENG Dongping. Spatial pattern analysis of individuals in different age-classes of Larix principis-rupprechtii in Luya Mountain Reserve, Shanxi, China [J]. Acta Ecol Sin, 2004, 24(1): 35 − 40. [21] 钮峥洋, 张晓晨, 祁奇, 等. 江苏宝华山自然保护区紫楠群落基本特征[J]. 浙江农林大学学报, 2019, 36(6): 1134 − 1141. NIU Zhengyang, ZHANG Xiaochen, QI Qi, et al. Phoebe sheareri community in the Jiangsu Baohuashan Nature Reserve [J]. J Zhejiang A&F Univ, 2019, 36(6): 1134 − 1141. [22] 缪宁, 刘世荣, 史作民, 等. 青藏高原东缘林线杜鹃-岷江冷杉原始林的空间格局[J]. 生态学报, 2011, 31(1): 1 − 9. MIAO Ning, LIU Shirong, SHI Zuomin, et al. Spatial pattern analysis of a Rhododendron-Abies virginal forest near timberline on the eastern edge of Qinghai-Tibetan Plateau, China [J]. Acta Ecol Sin, 2011, 31(1): 1 − 9. [23] 杨华, 李艳丽, 沈林, 等. 长白山云冷杉针阔混交林主要树种空间分布及其关联性[J]. 生态学报, 2014, 34(16): 4698 − 4706. YANG Hua, LI Yanli, SHEN Lin, et al. Spatial distributions and associations of main tree species in a sprucefir forest in the Changbai Mountains area in northeastern China [J]. Acta Ecol Sin, 2014, 34(16): 4698 − 4706. [24] 樊登星, 余新晓. 北京山区栓皮栎林优势种群点格局分析[J]. 生态学报, 2016, 36(2): 318 − 325. FAN Dengxing, YU Xinxiao. Spatial point pattern analysis of Quercus variabilis and Pinus tabulaeformis populations in a mountainous area of Beijing [J]. Acta Ecol Sin, 2016, 36(2): 318 − 325. -

-
链接本文:
https://zlxb.zafu.edu.cn/article/doi/10.11833/j.issn.2095-0756.20190631


 下载:
下载:
