-
林分密度是评定林分内林木间拥挤程度的指标,林分密度不仅影响木材的产量和质量[1],还会影响林分稳定性[2]。在影响林分生长的几个因素中,林分密度是营林工作中能够有效控制的因子。同时,在建立林分生长收获模型时,林分密度也是主要的考虑因素之一。评定林分密度的常用指标中,Reineke的林分密度指数、Beekhuis的相对植距,因为测定容易、与年龄或立地条件关系不密切、有实际经营意义等,近年来被越来越多的人所采用[3-6]。但是,Reineke的林分密度指数、Beekhuis的相对植距存在过度依赖现存数学模型,且对林分要求苛刻。目前,人工神经网络(ANN)在森林生长模型建模方面已有少量应用。谢鹏芳等[7]对马尾松Pinus massoniana直径分布模型进行了研究,认为神经网络建模具有较强的适应性。廖世涛[8]对杉木Cunninghamia lanceolata人工林密度效应进行研究,认为采用人工神经网络建立的密度效应模型科学合理,预测精度优于以往传统模型。马翔宇等[9]以白桦Betula platyphlla人工林为研究对象,建立了单木生长神经网络模型。金星姬等[10]以大兴安岭落叶松Larix gemelinii为研究对象建立了神经网络全林分生长模型。陈晨等[11]对伏牛山栓皮栎Quercus variabilis天然次生林地位指数进行了研究,认为神经网络建模技术具有过度拟合数据的缺点,使用时必须定性定量相结合。由于人工神经网络具有无限逼近非线性系统的能力,且拟合速度快,不依赖于现存的函数[12-13],是目前解决复杂对象建模的最佳手段。林分的生长过程是一个复杂的非线性过程,适合采用人工神经网络来建模。本研究以薄山林场马尾松人工林为研究对象,采用人工神经网络建模技术建立密度指数ANN模型,并与Reineke的林分密度指数进行比较,建立密度指数模型,旨在为提高木材产量和质量,实现马尾松人工林科学抚育经营提供参考。
-
研究区为河南省驻马店薄山林场,薄山林场为伏牛山东段余脉浅山丘陵区,地理坐标为32°36′~32°44′N,113°50′~113°58′E。山势平缓,坡度为15°~30°,海拔为150~250 m,最高的山峰狠头寨高为430.5 m。土壤为黄棕壤,厚度为30~70 cm,pH 5~6,为弱酸性土壤。该林场位于中国南北气候过渡带,水资源充足,土壤肥沃湿润,物种资源丰富。该地区在气候地理区划中属亚热带向暖温带过渡区,年极端最高气温36.7°,年极端最低气温-11.3°,年均气温为15.5°,年降水多分布在6-8月,年降水量为808~1 206 mm,雨季明显。林场土地总面积为6 017 hm2,林业用地面积5 212 hm2,马尾松人工林和栎类Quercus为该林场的主要树种。
-
于2015年6-8月进行外业调查,并在2016年6-8月做了补充调查。马尾松立地类型有下坡阴坡、下坡阳坡、中坡阴坡、中坡阳坡、上坡阴坡、上坡阳坡等6个。依据立地类型设置不同的标准地。共设147块标准地,标准地面积为20 m × 30 m。标准地主要林分调查因子特征:年龄4~40 a,平均胸径4.2~26.4 cm,平均高3.4~22.7 m。由年龄范围可知,标准地林分年龄组涵盖了幼龄林、中龄林、近熟林、成熟林等。由立地类型、龄组划分、平均高分布等情况可知,所选标准地具有代表性,可以用来建立模型。标准地数据见表 1。
表 1 林分密度统计结果
Table 1. Statistical results of stand density
径阶/cm 平均胸径/cm 林分密度/(株·hm-2) 疏密度 样地数 4 4.25 9 900 0.9 1 6 6.23 6 285 1.0 10 8 7.85 4 680 1.1 3 10 10.34 3 450 1.0 3 12 12.04 2 520 1.0 16 14 13.87 1 860 1.1 31 16 15.75 1 590 1.0 25 18 17.50 1 275 1.1 25 20 19.36 1 125 1.0 24 22 21.53 1 050 1.1 6 24 23.70 870 0.9 2 26 25.64 600 1.1 1 -
Reineke的林分密度指数的建立是假设在完满立木度(疏密度为1.0的林分),未经间伐的同龄林中,林分单位面积株数与林分平均胸径遵从幂函数关系。本研究所用标准地的马尾松为未经间伐的人工同龄纯林,林分的郁闭度采用样点法测定,依据郁闭度与疏密度的关系确定疏密度。由表 1可以看出:各组的平均疏密度近似为1.0,因此可认为所用数据符合林分密度指数的完满立木度概念。
-
林分密度指数(ISDI)是Reineke在1933年提出的,指林分在标准平均胸径处应具有的单位面积株数。Reineke所采用标准平均胸径为25.4 cm,中国林业生产中,平均胸径通常取20 cm。本研究采用拐点法确定标准平均胸径D0[13]。N=ISDI(Dg/D0)b;ISDI=N(D0/Dg)b。其中:N为单位面积株数,即林分密度(株·hm-2);Dg为林分平均胸径(cm);D0为标准平均胸径(cm);b为模型参数。
-
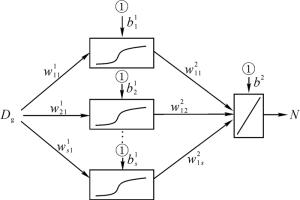
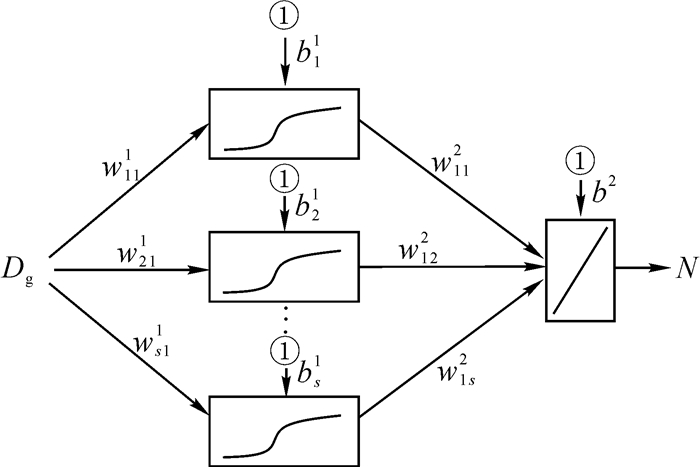
在Matlab软件中,应用nntool工具箱,以平均胸径Dg为输入变量,以单位面积株数N为输出变量,建立林分密度指数的ANN模型,中间层为隐层,隐层神经元个数为待定的s个。神经元个数的确定采用由少到多逐步训练的方式确定。图 1中,ws11(s=1, 2, 3…)为输入层节点Dg至隐层神经元的权值,bs1(s=1, 2, 3…)为隐层神经元的阈值,①为输入值为1的输入节点,w1s2(s=1, 2, 3…)为隐层至输出层节点N的权值,b2为输出层阈值,“S”形符号表示神经元的传递函数为对数sigmoid函数,即Matlab软件中的的logsig函数。“/”符号表示神经元的传递函数为线性函数,即Matlab软件中的purelin函数。
-
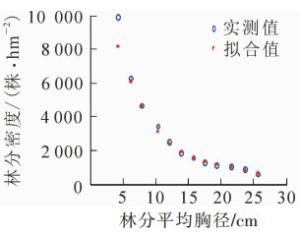
依据表 1数据,经回归分析可得幂函数模型参数,N=677 9Dg-1.516 3。最大密度线斜率b=-1.516 3,与Reineke研究的斜率-1.605很接近。图 2可知:在林分发育初期,林分密度随着林分平均胸径的增大而减小,到后期,随着平均胸径的增大,林分密度逐渐趋于平缓或略微下降。平均胸径14 cm处为拐点,因此马尾松人工林标准平均胸径D0为14 cm。除第1个点外,实测值与拟合值拟合效果很好,拟合精度为92.11%。t检验的P常数项为3.78 × 10⁻¹⁴,线性项为7.87 × 10⁻¹⁰,均小于0.05,说明在回归方程中常数项与线性项均是显著的。将b=-1.516 3,D0=14 cm代入林分密度指数计算式:ISDI=N(14/Dg)-1.516 3。
-
以平均胸径为输入变量,以单位面积株数为输出变量,依表 1数据为训练样本,对图 1所建ANN模型,在Matlab系统里,经反复训练,同时结合林分密度随林分平均直径的变化规律,即随着林分平均直径的增大,林分密度曲线呈反“S”型,并逐渐趋于平稳,最终确定薄山林场马尾松人工林密度指数模型为1:2:1的ANN模型,模型拟合精度为92.57%,均方误差为0.001 469 7,所得ANN模型共3层,包括输入层1个节点Dg,隐层有2个神经元,输出层有1个节点N。将该模型命名为network2,network2里面包含了所有的模型参数。模型结构为:
$$ N=\text { purelin }\left(-0.095 \;403 D_{\mathrm{gl}}-4.706\;9 D_{\mathrm{g} 2}+3.767\;2\right); $$ (1) $$ D_{\mathrm{g}}=\log \operatorname{sig}\left(7.917\;2 D_{\mathrm{g}}-7.379\;2\right); $$ (2) $$ D_{\mathrm{g} 2}=\log \operatorname{sig}\left(2.574\;5 D_{\mathrm{g}}+3.267\;6\right)。 $$ (3) 式(1)~(3)中:Dg1、Dg2分别为隐层2个神经元的输出值。也可将模型简单写为:
$$ N=\operatorname{sim}\left(\text { network } 2, D_{\mathrm{g}}\right)。 $$ (4) 拟合效果如图 3,林分密度随平均胸径的增大逐渐减小,达14 cm之后,林分密度逐渐稳定,这与Reineke的林分密度指数曲线变化趋势是一致的。在平均胸径达6 cm之后,ANN能很好地拟合林分密度随林分平均胸径的变化趋势,但在林分发育初期,却未能更好地拟合林分的生长发育过程,这可能与数据的处理有关。若能增加幼龄林组的数据,可能会进一步提升拟合的精度。在式(4)中,当Dg为林分标准平均胸径D0时,公式可写为:
$$ I_{\mathrm{SDI}}=\operatorname{sim}\left(\text { network } 2, D_{0}\right)。 $$ (5) 由式(4)、式(5)可得林分密度指数表达式:
$$ I_{\mathrm{SDI}}=N \operatorname{sim}\left(\text { network } 2, D_{0}\right) / \operatorname{sim}\left(\text { network } 2, D_{\mathrm{g}}\right); $$ (6) $$ N=I_{\mathrm{SDI}} \operatorname{sim}\left(\text { network } 2, D_{\mathrm{g}}\right) / \operatorname{sim}\left(\text { network } 2, D_{0}\right)。 $$ (7) 将D0=14 cm代入式(6)和式(7)可得:
$$ I_{\mathrm{SDI}}=125.287\;6 \;{N} / \mathrm{sim}\left(\text { network } 2, D_{\mathrm{g}}\right); $$ (8) $$ N=0.007\;98 I_{\mathrm{SDI}} \operatorname{sim}\left(\text { network } 2, D_{\mathrm{g}}\right)。 $$ (9) 依据式(9)可绘制林分密度指数曲线簇(图 4)。当林分平均胸径相同时,随着林分密度指数的增加,林分密度也在增加。当林分密度相同时,随着林分密度指数的增加,林分的平均胸径在增大。
-
本研究数据来自不同立地类型、不同龄级、未经间伐的同龄林标准地,经数据可行性分析,所用标准地具有代表性,运用标准地数据建立的Reineke林分密度指数模型和人工神经网络密度指数模型能够准确反映林分密度的变化情况。采用147块标准地的林分密度—平均胸径数据,以Reineke的林分密度指数曲线为数学模型,拟合林分株数密度与平均胸径的关系曲线。经过回归分析,求得最大密度线斜率b为-1.516 3,模型精度为92.11%,t检验结果显著。用拐点法求得马尾松标准平均胸径为14 cm,林分密度与平均胸径的关系为N=6 779Dg-1.516 3。采用147块标准地的林分密度—平均胸径数据,以林分平均胸径为输入向量,以林分密度为输出向量,构建了人工神经网络密度指数模型,结构为1:2:1。人工神经网络密度指数模型简写为N=sim(network2, Dg),模型拟合精度为92.57%,均方误差为0.001 469 7。模型精度及均方误差检验结果表明:采用标准地数据所建立的人工神经网络林分密度指数模型精度高,能够客观反映该地区林分密度变化情况。
人工神经网络建模技术与Reineke的林分密度指数模型拟合精度均达92%以上,都有较好的拟合效果。与Reineke的林分密度指数曲线相比,人工神经网络密度指数模型具有不依赖于现存数学函数,建模简单、拟合精度高等优势,在幼龄林组数据较少的情况下,人工神经网络具有更好的拟合效果。Reineke林分密度指数模型要求林分为未经间伐的同龄林且平均疏密度近似为1.0,相对于Reineke的林分密度指数,人工神经网络对林分要求不高,适用范围更宽。2种方法在拟合株数密度随林分平均胸径的变化趋势时,幼龄林组拟合效果都不理想,这与幼龄林组数据数量有关,后期研究需增加幼龄林的数量,进一步提高林分密度指数精度。
Density index model of the Pinus massoniana plantation based on artifical neural network (ANN)
-
摘要:
目的 通过对马尾松Pinus massoniana人工林密度指数模型的研究,为制定木材产量及质量的提升决策提供参考。 方法 以河南省薄山林场马尾松人工林为研究对象,采用147块标准地数据,以林分平均胸径为输入向量,以林分密度为输出向量,建立了林分密度指数人工神经网络(ANN)模型,并与Reineke的林分密度指数模型进行比较。 结果 ① 薄山林场马尾松人工林最大密度线斜率b为-1.516 3,马尾松标准平均胸径为14 cm,Reineke的林分密度指数模型精度为92.11%,t检验结果显著;②构建了网络结构为1:2:1的林分密度指数ANN模型,模型拟合精度为92.57%,均方误差为0.001 469 7。③无论采用Reineke林分密度指数还是人工神经网络技术,在拟合株数密度随林分平均胸径的变化趋势时,幼龄林组拟合效果都不理想,这与幼龄林组数据数量偏少有关。 结论 所建模型可为薄山林场马尾松抚育经营决策提供依据。 Abstract:Objective To provide reference for wood production and quality improvement management measures, a study was conducted of the density index model of the Pinus massoniana plantation. Method Taking the P. massoniana plantation in the Boshan Forest Form in Henan Province as the research object with data collected of 147 standard plots, artifical neural network (ANN) model of the stand density index was established taking stand DBH as input vector and the plant number density as output vector and compared with Reineke's stand density index model. Result (1) The maximum density slope b of the P. massoniana plantation in the Boshan Forest Form was -1.516 3, the standardized mean DBH was 14 cm, the fitting accuracy of Reineke's stand density index model was 92.11%, and the effect of t test was significant. (2) The fitting accuracy of ANN model was 92.57% and the mean square error (MSE) was 0.001 469 7. (3)Either with Reineke density index or ANN technique employed, the young forest group demonstrate lower accuracy in fitting the variation trends of number density against that of stand DBH, which attributes to the smaller data of the young forest group. Conclusion The above established model was expected to provide reference for the operational decisions of the P. massoniana plantation in the Boshan Forest Form in Henan Province. -
表 1 林分密度统计结果
Table 1. Statistical results of stand density
径阶/cm 平均胸径/cm 林分密度/(株·hm-2) 疏密度 样地数 4 4.25 9 900 0.9 1 6 6.23 6 285 1.0 10 8 7.85 4 680 1.1 3 10 10.34 3 450 1.0 3 12 12.04 2 520 1.0 16 14 13.87 1 860 1.1 31 16 15.75 1 590 1.0 25 18 17.50 1 275 1.1 25 20 19.36 1 125 1.0 24 22 21.53 1 050 1.1 6 24 23.70 870 0.9 2 26 25.64 600 1.1 1 -
[1] 孟宪宇.测树学[M]. 3版.北京:中国林业出版社, 2012:54 - 55. [2] 张柳华, 齐锦秋, 柳萍玉, 等.林分密度对桉树人工林群落结构和生物多样性的影响[J].西北植物学报, 2018, 38(1):166 - 175. ZHANG Liuhua, QI Jinqiu, LIU Pingyu, et al. Effects of stand density on community structure and species diversity of Eucalyptus robusta plantation[J]. Acta Bot Boreal Occident Sin, 2018, 38(1): 166 - 175. [3] ZEIDE B. The mean diameter for stand density index[J]. Can J For Res, 1983, 25(13): 1023 - 1024. [4] 刘平, 王玉涛, 马履一, 等.油松人工林林分生长过程动态预测及检验[J].东北林业大学学报, 2010, 38(1):40 - 43. LIU Ping, WANG Yutao, MA Lüyi, et al. Dynamic prediction and verification of growth process of Pinus tabulaeformis plantation in mountain[J]. J Northeast For Univ, 2010, 38(1): 40 - 43. [5] 杜纪山, 唐守正, 刘玉明.马尾松造纸原料材生长收获预估模型的研究[J].福建林学院学报, 2001, 21(1):1 - 5. DU Jishan, TANG Shouzheng, LIU Yuming. A study on the growth and yield model of prediction for papermaking and raw material stand of Masson[J]. J Fujian Coll For, 2001, 21(1): 1 - 5. [6] 唐继新, 雷渊才, 曾冀, 等.米老排人工林皆伐迹地种子天然更新林密度调控效应[J].浙江农林大学学报, 2018, 35(3):459 - 466. TANG Jixin, LEI Yuancai, ZENG Ji, et al. Tree dengsity and growth of Mytilaria laosensis stands with natural seed regeneration on clearcut land[J]. J Zhejiang A&F Univ, 2018, 35(3): 459 - 466. [7] 谢鹏芳, 谢敏, 裴志涛, 等.林分直径分布的Weibull参数估计系统研制[J].河南农业大学学报, 2016, 50(1):45 - 49. XIE Pengfang, XIE Min, PEI Zhitao, et al. Compilation of stand diameter distribution of Weibull parameters estimation system[J]. J Henan Agric Univ, 2016, 50(1): 45 - 49. [8] 廖世涛.杉木人工林神经网络密度效应模型[J].西南林业大学学报, 2012, 35(2):54 - 57. LIAO Shitao. Neural network density effect model of Cunninghamia lanceolata plantation[J]. J Southwest For Univ, 2012, 35(2): 54 - 57. [9] 马翔宇, 段文英, 崔金刚.白桦人工林单木生长的人工神经网络模型研究[J].森林工程, 2009, 25(3):30 - 38. MA Xiangyu, DUAN Wenying, CUI Jingang. Study on the artificial neural network model of individual tree growth in the Betula platyphlla plantation[J]. For Eng, 2009, 25(3): 30 - 38. [10] 金星姬, 贾炜玮, 李凤日.基于BP人工神经网络的兴安落叶松天然林全林分生长模型的研究[J].植物研究, 2008, 28(3):370 - 374. JIN Xingji, JIA Weiwei, LI Fengri. Whole stand growth model for natural dahurian larch forests based on BP ANN[J]. Bull Bot Res, 2008, 28(3): 370 - 374. [11] 陈晨, 刘光武, 陈涛, 等.伏牛山区栓皮栎天然次生林地位指数ANN模型构建[J].西北林学院学报, 2019, 34(1):206 - 210. CHEN Chen, LIU Guangwu, CHEN Tao, et al. Site index simulation for Quercus variabilis natural secondary forest in Funiu mountainous area based on ANN[J]. J Northwest For Univ, 2019, 34(1): 206 - 210. [12] 黄家荣.森林生长的人工神经网络建模[M].北京:中国农业出版社, 2006:25 - 26. [13] 朱伟杰, 高光芹, 黄家荣, 等.毛白杨农田防护林林分密度指数模型[J].西北林学院学报, 2011, 26(1):151 - 154. ZHU Weijie, GAO Guangqin, HUANG Jiarong, et al. Density index model of Populus shelterbelts[J]. J Northwest For Univ, 2011, 26(1): 151 - 154. -

-
链接本文:
https://zlxb.zafu.edu.cn/article/doi/10.11833/j.issn.2095-0756.2020.01.013


 下载:
下载:


