Volume 31 Issue 1
Jan.  2014
Turn off MathJax
Article Contents

XU Gaiping, LIU Fang, WU Xingbo, WEN Guosheng, WANG Yukui, GAO Yan, GAO Rongfu, ZHANG Rumin. Pigment content correlated to reflectance spectrums in Phyllostachys edulis leaves stressed by low temperature[J]. Journal of Zhejiang A&F University, 2014, 31(1): 28-36. doi: 10.11833/j.issn.2095-0756.2014.01.005
Citation: XU Gaiping, LIU Fang, WU Xingbo, WEN Guosheng, WANG Yukui, GAO Yan, GAO Rongfu, ZHANG Rumin. Pigment content correlated to reflectance spectrums in Phyllostachys edulis leaves stressed by low temperature[J]. Journal of Zhejiang A&F University, 2014, 31(1): 28-36. doi: 10.11833/j.issn.2095-0756.2014.01.005

Pigment content correlated to reflectance spectrums in Phyllostachys edulis leaves stressed by low temperature

doi: 10.11833/j.issn.2095-0756.2014.01.005
  • Received Date: 2013-01-09
  • Rev Recd Date: 2013-04-28
  • Publish Date: 2014-02-20
  • The reflectance spectrum for photosynthetic pigments of Phyllostachys edulis,a widely distributed,important bamboo with high economic value in China,has a close relationship to the growth process of P. edulis leaves. To evaluate the relationship between reflectance spectra characteristics and pigment content,and to seek sensitive spectral parameters for exact estimations of damage in P. edulis leaves stressed by low temperature, pigment content and reflectance spectra indexes,such as spectral reflectance index wavelength of 705 nm(SR705),modified spectral ratio(mSR),pigment-specific simple ratio(PSSR), normalized difference vegetation index(NDVI),red NDVI(rNDVI),memory carotenoid reflectance index (Mcri),and photochemical reflectance index(PRI),in P. edulis leaves under low temperature stress were tested and a correlation analysis was used for comparison. Results showed that as temperature deceased, chlorophyll a content and carotenoids in the leaves significantly decreased(P<0.01). As the stress level increased,reflectance spectrum parameters(SR705,mSR,PSSR,NDVI,rNDVI,Mcri,and PRI)significantly decreased(P<0.01). The red-edge area(Sred)decreased,and the red-edge inflection(λred)position moved toward the short-wave direction with increasing stress. Significant correlations(P<0.05) were found for chlorophyll a content, carotenoids in the leaves and reflectance spectra characteristics, and first derivative of reflectance spectra at the wavelength regions for blue edge and red edge. Moreover, correlations were significant(P<0.01) between pigment content and spectral characteristic parameters of SR705(r=0.709),rNDVI(r=0.724),Mcri (r=0.706),and Sred(r=0.706). These reflectance spectrum parameters(PSSR,NDVI,rNDVI,and Sred)could be used to evaluate leaf pigment content.
  • [1] WANG Shuwei, ZHOU Mingbing.  Genome-wide identification of the ICE gene family in moso bamboo and its expression pattern under low temperature stress . Journal of Zhejiang A&F University, 2024, 41(): 1-9. doi: 10.11833/j.issn.2095-0756.20230445
    [2] WANG Jie, CHEN Keyi, JIN Hai, LI Zhaona, CHENG Minmin, YANG Haiyun.  Reflection spectrum and photochemical characteristics of different colors’ leaves in Pseudosasa japonica . Journal of Zhejiang A&F University, 2021, 38(2): 271-279. doi: 10.11833/j.issn.2095-0756.20200360
    [3] LI Chengcheng, WU Qichao, MA Yan, LI Yuhao, ZANG Dekui.  Physiological responses and evalution of cold resistance of six Osmanthus fragrans cultivars under low temperature stress . Journal of Zhejiang A&F University, 2021, 38(4): 828-836. doi: 10.11833/j.issn.2095-0756.20200606
    [4] BU Keli, FU Lucheng, WANG Lingjie, LI Qingli, WANG Keyang, MA Yuandan, GAO Yan, ZHANG Rumin.  Analysis of PeATG1/PeATG4 gene expression in Phyllostachys edulis during rapid growth . Journal of Zhejiang A&F University, 2020, 37(1): 43-50. doi: 10.11833/j.issn.2095-0756.2020.01.006
    [5] LI Nan, LI Hepeng, JIANG Bo, YE Bihuan, CHEN Youwu, LI Haibo.  Physiological response to low temperature stress in Casuarina equisetifolia seedlings . Journal of Zhejiang A&F University, 2019, 36(4): 678-686. doi: 10.11833/j.issn.2095-0756.2019.04.007
    [6] ZHAO Lihua, HUANG Chengpeng, WANG Yueyue, HUANG Zhangting.  Stability of Phyllostachys edulis phytolith by scanning electron microscopy . Journal of Zhejiang A&F University, 2018, 35(6): 1177-1181. doi: 10.11833/j.issn.2095-0756.2018.06.023
    [7] ZHOU Zheyu, XU Chao, HU Ce, WANG Haixiang, LIANG Xieen, ZHANG Rumin, WEN Guosheng.  Chlorophyll fluorescence characteristics of Phyllostachys edulis during its fast growth period . Journal of Zhejiang A&F University, 2018, 35(1): 75-80. doi: 10.11833/j.issn.2095-0756.2018.01.010
    [8] LI Xiuyun, CHEN Xiaopei, XU Yingwu, CAO Youzhi.  Temporo-spatial expressions and prediction of cellulose synthase gene functions with growth of Phyllostachys edulis . Journal of Zhejiang A&F University, 2017, 34(4): 565-573. doi: 10.11833/j.issn.2095-0756.2017.04.001
    [9] WEN Xing, CHENG Luyun, LI Dandan, XU Xinlu, GAO Yan, ZHANG Rumin.  Photosynthetic characteristics in the development process of Phyllostachys edulis . Journal of Zhejiang A&F University, 2017, 34(3): 437-442. doi: 10.11833/j.issn.2095-0756.2017.03.008
    [10] LI Gaozhi, ZHU Yajun, ZHOU Shengcai, LU Yunfeng, ZHANG Junhong, TONG Zaikang.  Physiological indices at low temperature stress for two types of Phoebe zhennan . Journal of Zhejiang A&F University, 2017, 34(2): 310-318. doi: 10.11833/j.issn.2095-0756.2017.02.015
    [11] WU Xingbo, CHEN Dengju, MA Yuandan, GAO Yan, WEN Guosheng, ZHANG Rumin.  Chloromycetin effects on pigment content and chlorophyll fluorescence in Phyllostachys edulis seedlings . Journal of Zhejiang A&F University, 2016, 33(2): 209-215. doi: 10.11833/j.issn.2095-0756.2016.02.004
    [12] WANG Chaoli, ZHANG Zhijun, QU Yaping, WANG Lei.  Cloning, expression and purification of pyruvate, orthophosphate dikinase regulatory proteins from Phyllostachys edulis . Journal of Zhejiang A&F University, 2015, 32(5): 749-755. doi: 10.11833/j.issn.2095-0756.2015.05.014
    [13] GAO Peijun, QIU Yonghua, ZHOU Ziqiu, HE Renhua, XU Jia.  Productivity and photosynthetic ability of Phyllostachys edulis with nitrogen fertilization . Journal of Zhejiang A&F University, 2014, 31(5): 697-703. doi: 10.11833/j.issn.2095-0756.2014.05.006
    [14] GAO Yan, LI Houhua, LI Ling, WANG Yajie, XU Man.  Chromogenic pigments in Prunus cerasifera leaves . Journal of Zhejiang A&F University, 2014, 31(3): 481-487. doi: 10.11833/j.issn.2095-0756.2014.03.023
    [15] ZHANG Shanshan, YU Fei, GUO Huiyuan, SHEN Weidong, WANG Junlong, GAO Rongfu, ZHANG Rumin, HOU Ping.  Pigment content and reflectance spectrum of Cryptomeria fortunei with acid rain and litter treatments . Journal of Zhejiang A&F University, 2014, 31(2): 254-263. doi: 10.11833/j.issn.2095-0756.2014.02.014
    [16] ZHANG Li-yang, WEN Guo-sheng, ZHANG Ru-min, WANG Dian-jie, ZHANG Jun.  Climate change response using a simulation study of photosynthetic physiology on Phyllostachys pubescens . Journal of Zhejiang A&F University, 2011, 28(4): 555-561. doi: 10.11833/j.issn.2095-0756.2011.04.006
    [17] LIU Ying-kun, CAI Sha-yi, YU Wei-wu, LENG Hua-nan, GUI Ren-yi.  Organic acid exudates from roots of Phyllostachys pubescens with aluminum stress . Journal of Zhejiang A&F University, 2011, 28(4): 533-537. doi: 10.11833/j.issn.2095-0756.2011.04.002
    [18] DONG Da-chuan, KONG Zhen, YANG Wei-xi, LI Shuang-shuang, GAO Rong-fu, GAO Pei-jun.  Spectral reflectance of leaves for Phyllostachys pubescens at different canopy layers using a 4th order derivative . Journal of Zhejiang A&F University, 2011, 28(6): 893-899. doi: 10.11833/j.issn.2095-0756.2011.06.009
    [19] LIN Qiong-ying, CHEN Jian-xin, YANG Shu-zhen, WEN Guo-sheng.  Gas exchange with Phyllostachys pubescens on Mount Tianmu,Zhejiang Province . Journal of Zhejiang A&F University, 2008, 25(4): 522-526.
    [20] TIAN Hai-tao, GAO Pei-jun, WEN Guo-sheng.  Comparative study of cold resistance characteristics in seven Indocalamus spp . . Journal of Zhejiang A&F University, 2006, 23(6): 641-646.
  • [1]
    RICHARDSON A D,DUIGAN S P,BERLYN G P. An evaluation of noninvasive methods to estimate foliar chlorophyll content[J]. New Phytol,2002,153(1):185-194.
    [2]
    SIMS D A,GAMON J A. Relationships between leaf pigment content and spectral reflectance across a wide range of species,leaf structures and developmental stages[J]. Remote Sens Environ,2002,81(2/3):337-354.
    [3]
    GITELSON A A,GITZT Y,MERZLYYAK M N. Relationships between leaf chlorophyll content and spectral reflectance and algorithms for nondestructive chlorophyll assessment in higher plant leaves[J]. J Physiol,2003,160(3):271-282.
    [4]
    CASTRO K L,SANCHEZ-AZOFEIFA G A. Changes in spectral properties,chlorophyll content and internal mesophyll structure of senescing Populus balsamifera and Populus tremuloides leaves[J]. Sensors,2008,8(1):51-69.
    [5]
    MOORTHY I, MILLER J R,NOLAND T L. Estimating chlorophyll concentration in conifer needles with hyperspectral data:an assessment at the needle and canopy level[J]. Remote Sens Environ,2008,112(6):2824-2838.
    [6]
    NIEMANN K O. Remote sensing of forest stand age using airborne spectrometer date[J]. Photogr Eng Remote Sens,1995,61(9):1119-1127.
    [7]
    CARTER G A,KNAPP A K. Leaf optical properties in higher plants:linking spectral characteristics to stress and chlorophyll concentration[J]. Am J Bot,2001,88:677-684.
    [8]
    JULIO O,LEONOR O M,ANABELA R. Reflectance indices as nondestructive indicators of the physiological status of Ceratonia siliqua seedlings under varying moisture and temperature regimes[J]. Funct Plant Biol,2012,39(7):588-597.
    [9]
    CHENG Gaofeng,ZHANG Jiahua,LI Bingbai,et al. Hyperspectral and red edge characteristics for rice under different temperature stress levels[J]. Jiangsu J Agric Sci,2008,24(5):573-580.
    [10]
    GUAN Fengying,DENG Wanghua,FAN Shaohui,et al. Spectral characteristics of Phyllostachys pubescens stand and its differential analysis with typical vegetation[J]. J Beijing For Univ,2012,34(3):31-35.
    [11]
    GAO Peijun,DONG Dachuan,HE Renhua,et al. Effact of diffrent fertilizer supplies on relectance spectrum in leaves Phyllostachys pubescens[J]. J Beijing For Univ,2011,33(6):53-57.
    [12]
    LICHTENTHALER H K. Chlorophylls and cartenoids:pigments of photosynthetic biomembranes[J]. Methods Enzymol,1987,148:350-382.
    [13]
    GITELSON A A,MERZLYAK M N. Spectral reflectance changes associated with autumn senescence of Aesculus hippocastanum L. and Acer Platanoides L. leaves spectral features and relation to chlorophyll estimation[J]. J Plant Physiol,1994,143:286-292.
    [14]
    BLACKBURN G A. Quantifying chlorophylls and caroteniods at leaf and canopy scales:an evaluation of some hyperspectral approaches[J]. Remote Sens Environ,1998,66(3):273-285.
    [15]
    BLACKBURN G A. Spectra lindices for estimating photosynthetic pigment cincentrations:a test using senescent tree leaves[J]. Int J Remote Sens,1998,19(4):657-675.
    [16]
    BLACKBURN G A. Relationships between spectral reflectance and pigment concentrations in stacks of deciduous broadleaves[J]. Remote Sens Environ,1999,70(2):224-237.
    [17]
    CHAPPELLE E W,KIM M S,MCMURTREY Ⅲ J E. Ratio analysis of reflectance spectra(RARS):an algorithm for the remotely estimation of the concentration of chlorophyll a,chlorophyll b,and carotenoids in soybean leaves[J]. Remote Sens Environ,1992,39(3):239-247.
    [18]
    GAMON J A,SERRANO L,SURFUS J S. The photochemical reflectance index:an opdicator of photosyntheticradiation use efficiency across species,functional types and nutrient levels[J]. Oecologia,1997,112:492-501.
    [19]
    GAMON J A,SURFUS J S. Assessing leaf pigment content and activity with a reflectometer[J]. New Phytiologost,1999,143:105-117.
    [20]
    MERZLYAK M N,GITELSON A A,CHIVKUNOVA O B,et al. Non-destructive optical detection of pigment changes during leaf senescence and fruit ripening[J]. Physiol Plantarum,1999, 106:135-141.
    [21]
    GITELSON A A,KEYDAN G P,MERZLYAK M N. Three-band model for noninvasive estimation of chlorophyll, carotenoids,and anthocyanin contents in higher plant leaves[J]. Geophys Res Letters,2006,33:L11402.
    [22]
    GAMON J A,PENUELAS J,FIELD C B. A narrow-waveband spectral index that tacks diurnal changes in photosynthetic efficiency[J]. Remote Sens Environ,1992,41(1):35-44.
    [23]
    XUE Lihong,CAO Weixing,LUO Weihong,et al. Correlation between leaf nitrogen status and canopy spectral characteristics in wheat[J]. Chin J Plant Ecol,2004,28(2):172-177.
    [24]
    OSORIO M L,OSORIO J,VIEIRA A C,et al. Influence of enhanced temperature on photosynthesis,photooxidative damage,and antioxidant strategies in Ceratonia siliqua L. seedlings subjected to water deficit and rewatering[J]. Photosynthetica,2011,49:3-12.
    [25]
    SUN Fu,YANG Litao,XIE Xiaona,et al. Effect of chilling stress on physiological metabolism in chloroplasts of seedlings of sugarcane varieties with different chilling resistance[J]. Acta Agron Sin,2012,38(4):732-739.
    [26]
    RICHARDSON A D,DUIGAN S P,BERLYN G P. An evaluation of noninvasive methods to estimate foliar chlorophyll content[J]. New Phytologist,2002,153(1):185-194.
    [27]
    NAIDU R A,PERRY E M, PIERCE F J,et al. The potential of spectral reflectance technique for the detection of Grapevine leafroll-associated virus-3 in two red-berricd wine grape culrivars[J]. Computer Electron Agric,2009,66(1):38-45.
    [28]
    HORLER D N H,DOCKRAY M, BARBER J. The red edge of plant leaf reflectance[J]. Int J Remote Sens 1983,4(2):273-288.
    [29]
    CHAPPELLE E W,KIM M S,McMURTREY III J E,et al. Ratio analysis of reflectance spectra (RARS):an algorithm for the remotely estimation of the concentration of chlorophyll a,chlorophyll b,and carotenoids in soybean leaves[J]. Remote Sens Environ,1992,39(3):239-247.
    [30]
    MUTANGA O,SKIDMORE A K. Red edge shift and biochemical content in grass canopies[J]. ISPRS J Photogr Remote Sen,2007,62(1):34-42.
    [31]
    FENG Wei,ZHU Yan,TIAN Yongchao,et al. Monitoring leaf nitrogen accumulation with hyperspectral remote sensing in wheat[J]. Acta Ecol Sin,2008,28(1):23-32.
    [32]
    BLACKBURN G A,FERWERDA J G. Retrieval of chlorophyll concentration from leaf reflectance spectra using wavelet analysis[J]. Remote Sens Environ,2008,112(4):1614-1632.
    [33]
    GITELSON A A,MERZLYAK M N. Signature analysis of leaf reflectance spectra:algorithm development for remote sensing of chlorophyll[J]. J Plant Physiol,1996,148(3/4):494-500.
    [34]
    GARBULSKY M F,PENUELAS J,GAMON J,et al. The photochemical reflectance index (PRI) and the remote sensing of leaf,canopy and ecosystem radiation use efficiencies:a review and meta-analysis[J]. Remote Sens Environ, 2011,115(2):281-297.
    [35]
    FENG Rui,ZHANG Yushu,YU Wenying,et al. Spectral characteristics of Pinus tabulaeformis canopy with different damaged rates of needle leaf in western Liaoning Province,Northeast China[J]. Chin J Appl Ecol,2012,23(7):1774-1780.
    [36]
    BUSCH F,HUNER N P A,ENSMINGER I. Biochemical constrains limit the potential of the photochemical reflectance index as a predictor of effective quantum efficiency of photosynthesis during the winter spring transition in Jack pine seedlings[J]. Funct Plant Biol,2009,36:1016-1026.
    [37]
    XUE Zhongcai,GAO Huiyuan,PENG Tao,et al. Application of spectral reflectance on research of plant eco-physiology[J]. Plant Physiol J,2011,47(4):313-320.
    [38]
    DU Huaqiang,GE Hongli,FAN Wenyi,et al. Study on relationships between total chlorophyll with hyperspectral features for leaves of Pinus massoniana forest[J]. Spectr Spectr Anal, 2009,29(11):3033-3037.
    [39]
    BLACKBURN G A. Wavelet decomposition of hyperspectral data:a novel approach to quantifying pigment concentrations in vegetation[J]. Int J Remote Sens,2007,28(12):2831-2855.
    [40]
    WANG Xiuzhen,HUANG Jingfeng,LI Yunmei,et al. Correlation between chemical contents of leaves and characteristic variables of hyperspectra on rice field[J]. Transe Chin Soc Agric Eng,2003,19(2):144-148.
  • 加载中
通讯作者: 陈斌, bchen63@163.com
  • 1. 

    沈阳化工大学材料科学与工程学院 沈阳 110142

  1. 本站搜索
  2. 百度学术搜索
  3. 万方数据库搜索
  4. CNKI搜索

Figures(4)  / Tables(5)

Article views(2826) PDF downloads(617) Cited by()

Related
Proportional views

Pigment content correlated to reflectance spectrums in Phyllostachys edulis leaves stressed by low temperature

doi: 10.11833/j.issn.2095-0756.2014.01.005

Abstract: The reflectance spectrum for photosynthetic pigments of Phyllostachys edulis,a widely distributed,important bamboo with high economic value in China,has a close relationship to the growth process of P. edulis leaves. To evaluate the relationship between reflectance spectra characteristics and pigment content,and to seek sensitive spectral parameters for exact estimations of damage in P. edulis leaves stressed by low temperature, pigment content and reflectance spectra indexes,such as spectral reflectance index wavelength of 705 nm(SR705),modified spectral ratio(mSR),pigment-specific simple ratio(PSSR), normalized difference vegetation index(NDVI),red NDVI(rNDVI),memory carotenoid reflectance index (Mcri),and photochemical reflectance index(PRI),in P. edulis leaves under low temperature stress were tested and a correlation analysis was used for comparison. Results showed that as temperature deceased, chlorophyll a content and carotenoids in the leaves significantly decreased(P<0.01). As the stress level increased,reflectance spectrum parameters(SR705,mSR,PSSR,NDVI,rNDVI,Mcri,and PRI)significantly decreased(P<0.01). The red-edge area(Sred)decreased,and the red-edge inflection(λred)position moved toward the short-wave direction with increasing stress. Significant correlations(P<0.05) were found for chlorophyll a content, carotenoids in the leaves and reflectance spectra characteristics, and first derivative of reflectance spectra at the wavelength regions for blue edge and red edge. Moreover, correlations were significant(P<0.01) between pigment content and spectral characteristic parameters of SR705(r=0.709),rNDVI(r=0.724),Mcri (r=0.706),and Sred(r=0.706). These reflectance spectrum parameters(PSSR,NDVI,rNDVI,and Sred)could be used to evaluate leaf pigment content.

XU Gaiping, LIU Fang, WU Xingbo, WEN Guosheng, WANG Yukui, GAO Yan, GAO Rongfu, ZHANG Rumin. Pigment content correlated to reflectance spectrums in Phyllostachys edulis leaves stressed by low temperature[J]. Journal of Zhejiang A&F University, 2014, 31(1): 28-36. doi: 10.11833/j.issn.2095-0756.2014.01.005
Citation: XU Gaiping, LIU Fang, WU Xingbo, WEN Guosheng, WANG Yukui, GAO Yan, GAO Rongfu, ZHANG Rumin. Pigment content correlated to reflectance spectrums in Phyllostachys edulis leaves stressed by low temperature[J]. Journal of Zhejiang A&F University, 2014, 31(1): 28-36. doi: 10.11833/j.issn.2095-0756.2014.01.005
  • 叶片色素质量分数与其光合能力和营养状况有较好的相关性,通常是植物环境胁迫的良好指示器[1],叶片光谱反射率测定是一种快捷无损估测叶片色素质量分数的方法[2]。研究表明,近红外波段反射率(>750 nm)与700 nm和550 nm的比值(R750/R700R750/R550)与植物叶片中叶绿素a和叶绿素a+b质量分数具有良好的相关性;绿度归一化光谱指数(gNDVI)对叶绿素a的质量分数变化非常敏感[3]。修正型光谱指数(mSR705)和叶片衰老指数(PSRI)能够很好地反应叶片结构和色素质量分数[4]。北美短叶松 Pinus banksiana高光谱观测显示,光谱指数R750/R710对叶绿素敏感,可用于估测总叶绿素质量分数[5]。当植物在受到胁迫时,叶片色素质量分数降低,色素质量分数与光谱反射率有显著的相关性[6]。可见光部分光谱反射率的变化主要是由叶片的叶绿素质量分数对胁迫异常敏感所致,且对胁迫敏感的波段范围主要集中在550 nm附近的绿光反射峰及700 nm附近的红边附近[7]。温度水分双重胁迫综合作用于光谱反射率的光化学反射指数(PRI),叶片总叶绿素质量分数与红边位置(λred)显著相关[8]。温度胁迫使叶片叶绿素降解,近红外区域光谱反射率随温度胁迫程度的加剧而降低,λred向短波方向移动[9]。这些研究表明:植物胁迫程度与其叶片中色素质量分数及光谱特征均有紧密的联系。毛竹 Phyllostachys edulis林是中国南方重要的森林资源,具有较高的社会、经济和生态效益,在竹产业中具有极其重要的地位。研究显示:绿峰(Rg),红谷(Rr),λred,红边振幅(Dλred)等可作为毛竹林光谱识别的主要参数[10]。毛竹叶片绿光区的光谱反射率随叶绿素a、叶绿素b和类胡萝卜素质量分数增加而逐渐降低,且色素与红边参数有极显著的相关性[11]。低温胁迫是毛竹生长过程中最为常见的胁迫类型,然而,在低温胁迫下,毛竹叶片光合色素质量分数与反射光谱及相关参数的相关性研究未见报道。因此,本研究以3年生毛竹实生苗为研究对象,综合分析低温胁迫条件下叶片色素质量分数与反射光谱的相互关系,以探究毛竹低温胁迫响应机制。

  • 供试材料为毛竹 3年生实生苗,2012年4月中旬将其移入花盆(盆径25 cm)中缓苗。6月中旬选取株高1.0 m,生长良好,无病虫害的毛竹3株,放入人工气候箱中,相对湿度为(60 ± 3)%,光照条件为光照12 h/黑暗12 h,光照强度为1 000 μmol·m-2·s-1,适应培养2 d后进行温度胁迫。处理温度设有25 ℃,20 ℃,15 ℃,10 ℃和5 ℃等5个梯度,从25 ℃依次降低,以2 ℃·h-1过渡到下一温度,在各温度中处理24 h,选取毛竹植株中部当年生枝条顶端向下第3~4片完整的功能叶片,测定各项指标。

  • 称取毛竹叶片0.2 g,剪碎后置于带盖的试管中,加5.0 mL 体积分数为80%的丙酮,室温下遮光萃取至叶片完全变白后,分别在470,645和663 nm处测定其D(λ)值,按Lichtenthaler[12]的方法计算叶绿素a ,叶绿素b 和类胡萝卜素质量分数。在各温度中处理毛竹3株,取样3次·株-1

  • 采用光谱分析仪(UniSpec-SC,美国产)测定毛竹叶片在310~1 130 nm处的反射光谱数据,采样间隔1 nm,分辨率1 nm。测定时间为上午10: 00-12: 00,测定毛竹3株·次-1,选取叶子6片·株-1,取其平均值作为该温度的光谱反射率。测量过程中及时进行标准白板校正,用Multispec 5.1数据处理软件读取反射光谱原始数据。

  • 光谱数据微分处理:将毛竹叶片反射光谱通过下列公式进行一阶微分处理得到微分光谱。

    其中:λi为波段i处的波长值;Rλi为波长λi处的光谱反射率值;Δλ为波长λ(i-1)到λi的差值,由光谱采样间隔而定。“三边”参数计算方法:分别在490~530 nm,560~640 nm和680~750 nm范围内确定蓝边、黄边和红边位置、幅值和面积。λred为红光范围内一阶导数光谱最大值所对应的波长,Dλred为一阶导数光谱的最大值,红边面积(Sred)为一阶导数光谱线所包围的面积。黄边(黄边位置λyellow,黄边幅值Dλyellow,黄边面积Syellow)和蓝边(蓝边位置λblue,蓝边幅值Dλblue,蓝边面积Sblue)参数与红边参数意义类似。根据叶片特征,筛选出较能反应叶片特征结构的光谱参数[2, 13-22]及相关公式见表 1

    反射光谱参数定义
    叶绿素光谱指数
    光谱反射指数R750 / R705
    改良红边比(R750 - R445) / (R705 + R445)
    色素比值指数R800 / R680R800 / R635
    反射光谱比分析R675/ R700R650 / R700
    归一化植被指数(R803 - R680) / (R800 + R680)
    红边归一化指数(R750 - R705) / (R750 + R705)
    色素归一化指数(R800 R675) / (R800+ R675),
    (R800 - R650) / (R800 + R650)
    类胡萝卜素光谱指数
    反射光谱比率分析R760 / R500
    色素比值指数R800 / R500
    植物衰老反射指数(R680 - R500) / R750
    改良的类胡萝卜素指数R780 [(1/R510) — (1/R550)]
    光化学反射指数(R531 - R570) / (R531 + R570)
    花青素光谱指数
    红绿比指数Sum (R600 / Sum (R500 ~ R599)

    Table 1.  Reflectance spectrum parameters

  • 采用SPSS 13.0进行数据处理和统计分析,用OriginPro 8.0软件对光谱信息进行去噪处理,提取出与叶绿素有关的特征波段,并进行绘图。

  • 叶绿素质量分数是表征毛竹叶片光合作用状况的主要指标。在温度胁迫下,毛竹叶片叶绿素a,叶绿素b及类胡萝卜素质量分数变化基本一致,均随着温度降低而逐渐降低(表 2)。当温度降到15 ℃时,叶绿素a和类胡萝卜素有极显著的降低(P<0.01),分别比25 ℃时降低了4.2%和10.9%;当温度达到5 ℃时,叶绿素a和类胡萝卜素质量分数比对照25 ℃时分别降低了6.9%和23.1%;与叶绿素a和类胡萝卜素相比,叶绿素b变化趋势不明显。

    温度/℃叶片色素质量分数/(mg·g-1)
    叶绿素a叶绿素b叶绿素a+b类胡萝卜素叶绿素a/b
    25(ck)2.22±0.01aA0.86±.02aA3.09±.03aA0.08±0.01aA2.57±0.03aA
    202.22±0.01aAB0.86±0.01aA3.08±.03abA0.08±0.01aA2.56±0.02aA
    152.12±0.01bBC0.83±0.01aA2.97±.02cA0.07±0.01bAB2.55±0.01aA
    102.12±0.01bBC0.85±.02aA2.99±0.01bcA0.06±0.01bB2.50±0.07aA
    52.07±0.01bC0.85±.02aA2.97±0.01cA0.06±0.01cC2.49 ±0.06aA
    说明:小写字母不同表示0.05水平上的差异性(P<0.05),大写字母不同表示0.01水平上的差异性(P<0.01)。

    Table 2.  Effects of low temperature stress on pigments content in Phyllostachys edulis leaves

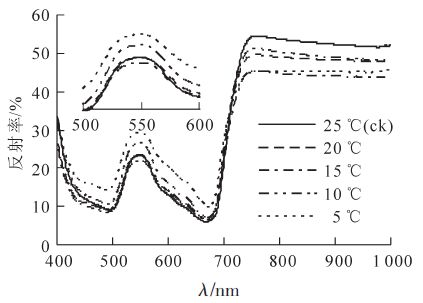
  • 低温胁迫显著影响毛竹叶片的光谱反射特征,在不同波段区域光谱响应不同(图 1)。在680 nm附近的红光区域和490 nm的蓝光区域有吸收低谷,而在550 nm处有反射峰,在近红外区域,由于没有叶片色素的吸收,反射率增加,使得780~1 000 nm波段出现较高的反射平台[23]。随着温度的降低,反射光谱在蓝光区(525~605 nm)存在明显差异,其次是黄光区(605~655 nm)和近红外区(750~1 000 nm)。毛竹叶片的反射率在460~680 nm波段随温度降低而逐渐升高,10 ℃时出现显著增加,在波长550 nm处,当温度降低到5 ℃时,反射率比对照25 ℃提高了24.5%(P<0.01);在750~1 000 nm波段,反射率随温度降低而降低。

    Figure 1.  Effects of low temperature stress on reflectance spectra Figure 2 First derivative of reflectance spectra in Ph. edulis in Phyllostachys edulis leaves

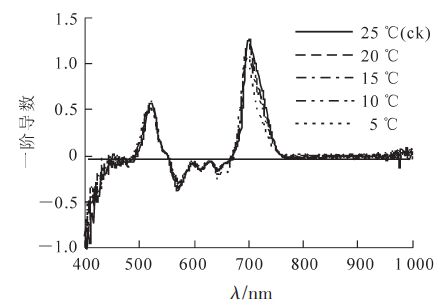
  • 在分析光谱数据过程中,对原始光谱数据进行微分变换,以减少背景噪声的影响,从而提高参数的监测效果。将低温胁迫后毛竹叶片的反射光谱数据进行一阶导数处理,结果如图 2所示。不同温度处理的毛竹叶片在680~760 nm波段内都只有1个峰值。随着温度的降低,λred逐渐向短波方向移动(表 3)。Sred随之减小,15 ℃时差异显著。Sblue随着温度降低呈现出逐渐增加的趋势,而λblue则逐渐减小;λyellow随温度降低而减小,而Syellow和Dλyellow则随着温度的降低呈现先升高后降低的趋势。无论是蓝边还是黄边,最明显的变化都出现在5℃时(表 3)。

    Figure 2.  First derivative of reflectance spectra in Ph. edulis leaves under low temperature stresss

    参数不同温度下的参数值
    25(ck)2015105℃
    λblue520.50 ± 1.50 aA519.70 ± 0.01 aA520.10 ± 1.50 aA519.60 ± 1.29 aA518.70 ± 0.43 aA
    λblue0.58 ± 0.04 aA0.55 ± 0.04 aA0.51 ± 0.07 aA0.61 ± 0.12 aA0.53 ± 0.11 aA
    Sblue11.90 ± 1.20 aA12.10 ± 1.40 aA12.60 ± 1.90 aA13.70 ± 1.20 aA13.50 ± 2.20 aA
    λyellow569.20 ± 0.10 bAB568.50 ± 0.50 bB571.50 ± 0.20 aA569.20 ± 1.10 bAB568.10 ± 0.01 bB
    Dyellow-0.38 ± 0.01 bA-0.32 ± 0.02 abA-0.29 ± 0.04 aA-0.37 ± 0.04 abA-0.31 ± 0.05 aA
    Syellow13.84 ± 0.87 aA12.82 ± 1.03 aA12.01 ± 1.79 aA14.61 ± 2.72 aA13.47 ± 2.12 aA
    λred700.20 ± 1.20 aA699.50 ± 0.80 abA699.00 ± 1.40 abA697.70 ± 1.40 abA696.50 ± 0.10 bA
    Dλred1.27 ± 0.02 aA1.19 ± 0.05 aA1.09 ± 0.17 aA1.14 ± 0.14 aA1.08 ± 0.16 aA
    Sred47.66 ± 1.80 aA42.02 ± 1.53 abAB40.31 ± 1.72 abAB39.52 ± 0.95 bcAB34.71 ± 2.91 cB
    说明:小写字母不同表示0.05水平上的差异性(P<0.05),大写字母不同表示0.01水平上的差异性(P<0.01)。

    Table 3.  Effects of low temperature stress on "three edge" parameters in Ph. edulis leaves

  • 光谱参数是绿色植物的光谱反射特征,是反映植物生长状况的最常用光谱变量。本试验中筛选出的叶绿素、类胡萝卜素和花青素的相关光谱参数,均随着温度降低有显著地增加或降低,且大部分参数的变化幅度达到了极显著(P<0.01)水平。表 4可知:光谱反射指数、改良红边比、色素比值指数a、色素比值指数b、归一化植被指数、红边归一化指数、色素归一化指数a、色素归一化指数等叶绿素相关参数,及反射光谱比分析、色素比值指数、改良的类胡萝卜素指数、光化学反射指数等类胡萝卜素相关参数随温度的降低而降低;反射光谱比率分析a、红绿比指数和反射光谱比率分析b随着温度降低而升高;除反射光谱比率分析a外,各光谱参数变化均达极显著(P<0.01)水平。

    参数不同温度下的参数值
    25(ck)2015105℃
    光谱反射指数a1.982 ± 0.169 aA1.778 ± 0.172 abAB1.744 ± 0.151 abAB1.805 ± 0.374 abAB1.476 ± 0.134 bB
    改良红边比b0.626 ± 0.013 aA0.638 ± 0.013 aA0.619 ± 0.058 aA0.590 ± 0.092 aA0.466 ± 0.027 bB
    色素比值指数a7.984 ± 0.817 aA6.545 ± 0.745 aAB6.395 ± 1.156 aAB7.268 ± 2.477 aAB4.365 ± 0.584 bB
    色素比值指数b5.828 ± 0.829 aA4.870 ± 0.782 aAB4.589 ± 0.858 abAB4.914 ± 2.205 aAB2.883 ± 0.427 bB
    反射光谱比分析a0.291 ± 0.009 bA0.305 ± 0.032 bA0.311 ± 0.034 bA0.294 ± 0.066 bA0.369 ± 0.018 aA
    反射光谱比分析b0.338 ± 0.011 bB0.352 ± 0.039 bB0.368 ± 0.033 bB0.373 ± 0.084 bB0.482 ± 0.016 aA
    归一化植被指数0.776 ± 0.020 aA0.733 ± 0.029 aAB0.724 ± 0.049 aA0.739 ± 0.086 aAB0.624 ± 0.039 bB
    红边归一化指数0.328 ± 0.037 aA0.278 ± 0.044 abAB0.269 ± 0.041 abAB0.278 ± 0.090 abAB0.190 ± 0.044 bB
    色素归一化指数a0.792 ± 0.017 aA0.754 ± 0.027 aA0.743 ± 0.047 aAB0.758 ± 0.083 aA0.647 ± 0.031 bB
    色素归一化指数b0.762 ± 0.024 aA0.720 ± 0.044 aA0.703 ± 0.053 aA0.700 ± 0.109 aA0.561 ± 0.047 bB
    反射光谱比率分析5.869 ± 0.539 aA5.298 ± 0.619 aA5.138 ± 0.899 aA5.052 ± 1.708 aA2.970 ± 0.229 bB
    色素比值指数5.779 ± 0.547 aA5.225 ± 0.591 aA5.064 ± 0.888 aA4.964 ± 1.689 aA2.976 ± 0.264 bB
    植物衰老反射指数-0.047 ± 0.004 bA-0.038 ± 0.007 bA-0.041 ± 0.011 abA-0.070 ± 0.029 bAB-0.107 ± 0.025 cB
    改良的类胡萝卜素指数2.478 ± 0.358 aA2.055 ± 0.326 bAB1.956 ± 0.449 bAB2.002 ± 0.993 aAB0.898 ± 0.113 bB
    光化学反射指数0.060 ± 0.004 aA0.052 ± 0.012 abAB0.050 ± 0.006 abAB0.056 ± 0.011 aAB0.040 ± 0.006 bB
    红绿比指数0.524 ± 0.004 bB0.565 ± 0.031 bAB0.567 ± 0.030 bAB0.536 ± 0.049 bB0.616 ± 0.010 aA
    说明:小写字母不同表示0.05水平上的差异性(P<0.05),大写字母不同表示0.01水平上的差异性(P<0.01)。

    Table 4.  Effects of low temperature stress on reflectance spectrum parameters in Phyllostachys edulis leaves

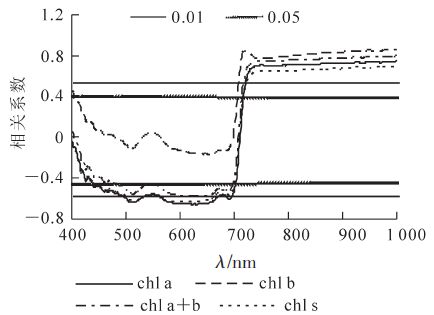
  • 对低温胁迫后毛竹叶色素质量分数与光谱反射率进行相关分析表明(图 3),波长小于710 nm,毛竹叶叶绿素a,叶绿素a+b和类胡萝卜素质量分数与反射率呈负相关,且于452~700 nm的反射率达显著(P<0.05)相关,在620 nm处相关系数最大。光谱反射率与除叶绿素b外的各色素质量分数均显著相关,叶绿素a与光谱反射率的相关系数较类胡萝卜素要高;波长大于710 nm,叶绿素a,叶绿素b,叶绿素a+b和类胡萝卜素质量分数与光谱反射率呈正相关,且均达到极显著(P<0.01)水平。

    Figure 3.  Correlation between reflectance spectra and pigment content in Phllostachys edulis leaves

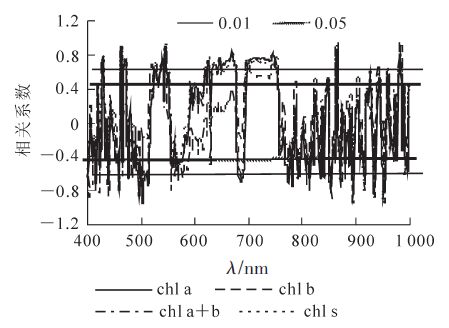
  • 毛竹叶片色素质量分数与一阶微分光谱之间的相关系数图表明(图 4),叶绿素a,叶绿素a+b和类胡萝卜素质量分数与一阶微分光谱在450~462,480~516,521~549,554~587,589~676,695~756,757~820 nm处均达极显著相关。其中,在450~462,480~516,554~587和757~820 nm等4个波段达极显著负相关,480~516 nm波段相关系数的绝对值最大,513 nm处为-0.973;而在其他几个显著相关波段呈极显著正相关,其中695~756 nm相关系数最大,745 nm处为-0.822,属于红边范围。可见蓝光和红光区域是毛竹叶片色素微分光谱的敏感区域。

    Figure 4.  Correlation between derivative spectra and content in Ph. edulis leaves

  • 相关分析表明:毛竹叶片绝大多数参数都与叶绿素a,叶绿素a+b及类胡萝卜素质量分数之间存在极显著(P<0.01)的相关性(表 5)。叶绿素a,叶绿素a+b及类胡萝卜素质量分数与光谱反射指数、改良红边比、色素比值指数b、色素归一化指数b、归一化植被指数、红边归一化指数、反射光谱比分析、色数比值指数、改良的类胡萝卜素指数、光化学反射指数、λred,DλredSred等光谱参数极显著正相关,其中与光化学反射指数相关系数最小,与Sred的相关系数最大。叶绿素a,叶绿素a+b及类胡萝卜素质量分数与反射光谱比分析a、反射光谱比分析b、红绿比指数呈负相关,其中与红绿比指数相关系数最小,与反射光谱比分析b的相关系数最大。叶绿素b与除DλredSred以外的各参数均未达到显著相关,与前面叶绿素b质量分数和反射率及微分光谱相关性未达显著水平相一致。

    光谱参数叶绿素a叶绿素b叶 绿 素 a+b 类胡萝卜素
    光谱反射指数0.709**0.4470.682 ** 0.656 **
    改良红边比0.677**0.2350.614 ** 0.653 **
    色素比值指数a0.608**0.3950.587*0.545*
    色素比值指数b0.717**0.4330.686 ** 0.666 **
    反射光谱比a-0.568**-0.304-0.536*-0.510*
    反射光谱比b-0.699**-0.316-0.649 ** -0.663 **
    归一化植被指数0.669**0.3680.633 ** 0.618 **
    红边归一化指数0.724**0.4230.690 ** 0.676 **
    色素归一化指数a0.673**0.3690.637 ** 0.623 **
    色素归一化指数b0.724**0.3600.678 ** 0.685 **
    反射光谱比率分析0.696**0.3210.647 ** 0.656 **
    色素比值指数0.702**0.3250.653 ** 0.662 **
    植物衰老反射指数0.663**0.1390.548*0.659 **
    改良的类胡萝卜素指数0.706**0.3690.665 ** 0.661 **
    光化学反射指数0.633**0.4720.623 ** 0.567*
    红绿比指数-0.538**-0.381-0.525*-0.468
    λred0.851**0.3970.792 ** 0.843 **
    Dλred0.652**0740**0.690 ** 0.580*
    Sred0.881**0.675**0.870 **0.845 **
    说明:*表示差异显著(P<0.05),**表示差异极显著(P<0.01)。

    Table 5.  Correlation between reflectance spectrum parameters and pigment contents in Phyllostachys edulis leaves

  • 毛竹叶片叶绿素a和类胡萝卜素质量分数随温度降低而降低,是由于植物色素的合成过程,绝大部分都要有酶的参与,低温降低了叶绿体中一系列合成酶的活性[24];再者,低温胁迫引起叶片叶绿体结构变形、膜系统受到破坏,体内活性氧积累过多,从而加速了色素的降解[25],因此低温胁迫下的色素质量分数的降低,不仅是合成受阻,而且存在色素分解的加剧。植物色素是植物体内主要的吸收光能物质,其质量分数往往是植物环境胁迫、光合能力等生理状态的良好指示剂[26],因而常用于监测植物长势、估算植被光合效率和生物量[27]。毛竹叶片叶绿素b变化不明显,这与前人的研究结果有所不同,可能是低温处理时间太短,叶绿素b对低温胁迫不敏感,也可能与毛竹苗生长阶段和叶片发育状况有关。有待进一步研究探讨。

    低温胁迫下毛竹叶片光谱显著差异主要在可见光区,且随温度降低而升高。植物绿光区(525~605 nm)及红光到近红外波段(680~750 nm)的反射率突变区域,包含着丰富的信息[28]。研究显示温度胁迫后的水稻Oryza sativa在近红外区反射率随温度胁迫程度的加剧而降低,可见光区与之相反[9],这与毛竹叶片研究一致。毛竹叶片光谱参数光谱反射指数、改良红边比、色素比值指数b、归一化植被指数、红边归一化指数、色素比值指数a、色素归一化指数b、反射光谱比率分析、色数比值指数、改良的类胡萝卜素指数、光化学反射指数和Sred等,在低温胁迫下变化尤为明显(表 4),其中反射光谱比分析[29]、色素比值指数[15]、色素比值指数[15]、光谱反射指数[13]Sred[30]等表现光谱特征优于其他参数,可作为监测依据。

    毛竹叶片25 ℃时红光吸收较多。随着温度降低,叶结构的破坏和叶绿素减少,导致红边区域吸收能力降低,反射增加,红边向短波方向移动,Sred也随之减小。叶绿素的吸收光谱区主要是在550~750 nm波段,生长旺盛时红光吸收较多[31-32],红光区光谱特征,可指示叶绿素质量分数的变化情况[33-34]。可见光和近红外区域是色素感受胁迫的敏感区域,色素质量分数与一阶微分光谱在红边(695~754 nm)内相关性最高[35]。毛竹叶片绿光区光谱反射率与色素质量分数(除叶绿素b外)呈显著负相关,红边(680~780 nm)内一阶微分值,与叶片色素(除叶绿素b外)质量分数达极显著相关,与前人有相似的结果。红光波段和绿光波段在评价毛竹长势上是十分有用的。

    光谱参数由光谱反射曲线衍生而来,在表现植物生长状况上更为具体和更具指向性,光谱反射指数、改良红边比、色数比值指数b、归一化植被指数、红边归一化指数、色素比值指数a、色素归一化指数b、反射光谱比率分析、色数比值指数、光化学反射指数及Sred等毛竹光谱参数与色素质量分数(除叶绿素b外)表现显著相关性。研究显示植物叶片色素质量分数与光谱参数也有着紧密的关系[33, 36],光谱参数、改良的类胡萝卜素指数、归一化植被指数及色素归一化指数a、色素归一化指数b可用来分析叶绿素a、叶绿素b和叶绿素a+b质量分数,反射光谱比分析、光化学反射指数、改良的类胡萝卜素指数及红绿比指数可用来监测类胡萝卜素和花青素质量分数[37]。λredSred,红边归一化指数,红边斜率(Sred[38],修正的简单化值植被指数(mSR705)和修正的归一化差值植被指数(mND705[4]等几个反射光谱特征参数均与叶绿素质量分数存在指数函数关系。红边参数λredDλredSred由于充分发挥了微分技术的优势,对植株生化组分的估测具有较高的能力[28, 39],毛竹叶片红边参数与色素质量分数极显著的相关性也充分印证了这一点,其数值大小受叶绿素及其叶片结构的影响,对胁迫最为敏感[40],采用光谱参数法估测毛竹叶片色素质量分数是切实可行的。

    低温胁迫下毛竹叶片色素和光谱特征均有显著差异,且叶片色素质量分数与反射光谱及各参数有极显著的相关性,可通过叶片光谱特征以及反射光谱比分析、色素归一化指数、色数比值指数、红边归一化指数和Sred 等光谱参数,方便快捷地反映毛竹生长状况。

Reference (40)

Catalog

    /

    DownLoad:  Full-Size Img  PowerPoint
    Return
    Return