Volume 36 Issue 2
Mar.  2019
Turn off MathJax
Article Contents

SONG Yang, WANG Cheng, LIAO Liang, DUAN Wenjun, HAN Dan, XU Shanshan, DU Qian, WANG Han. Ozone concentrations of three different vertical gradients for a Cunninghamia lanceolata forest in spring and summer at Yandang Mountain National Forest Park, Wenzhou[J]. Journal of Zhejiang A&F University, 2019, 36(2): 298-306. doi: 10.11833/j.issn.2095-0756.2019.02.011
Citation: SONG Yang, WANG Cheng, LIAO Liang, DUAN Wenjun, HAN Dan, XU Shanshan, DU Qian, WANG Han. Ozone concentrations of three different vertical gradients for a Cunninghamia lanceolata forest in spring and summer at Yandang Mountain National Forest Park, Wenzhou[J]. Journal of Zhejiang A&F University, 2019, 36(2): 298-306. doi: 10.11833/j.issn.2095-0756.2019.02.011

Ozone concentrations of three different vertical gradients for a Cunninghamia lanceolata forest in spring and summer at Yandang Mountain National Forest Park, Wenzhou

doi: 10.11833/j.issn.2095-0756.2019.02.011
  • Received Date: 2018-03-13
  • Rev Recd Date: 2018-05-08
  • Publish Date: 2019-04-20
  • Research on ozone concentration in forests has become a hot area of forest recreation because of its influence on forest growth and environmental quality. The variation of ozone mass concentration at different vertical heights in forest environment has a guiding role in forest recreation activities. Ozone concentration and meteorological factors in three different vertical gradients(The following are expressed by H1, H2 and H3 respectively. H1 stands for 1.5 m from ground, H2 indicates the central part of canopy, H3 means the boundary between canopy and atmosphere.) in Yandang Mountain were monitored for 24 h in the spring and summer of 2017. Their changing features and influencing factors were also observed at the same time. In this experiment, ozone sampler was used to sample three kinds of ozone mass concentration, and the data were processed by variance analysis and multiple comparison analysis. Results indicated that the mean value of 8 h maximum ozone concentration in three different vertical gradients all achieved the primary standard for ambient air quality standards(100 μg·m-3) except for the top of H3 (103.03 μg·m-3) during the spring. Ozone concentration changes for the different vertical gradients was H1 < H2 < H3 in both spring and summer with differences in the daily mean ozone concentration between H1 and H2 and H3 being higher in spring than in summer, there was a significant difference between H2 and H3 (P < 0.05). During the observation period for the two seasons, the daily ozone concentration in the different vertical gradients (H1, H2, and H3) all exhibited a single peak curve, with the highest concentration occurring in 11:00-15:00, whereas the lowest occurring in 5:00. The mean value of the hourly ozone concentration for H1, H2, and H3 during the two seasons was positively related with temperature and wind speed and negatively with humidity as well as pressure. In conclusion, Taking ozone concentration as recreation standard, summer nights was more suitable for people to travel. It was advisable to choose the understory and the middle of the canopy to arrange recreation facilities, such as a plank road in the understory or overhead and a wooden house in a C. lanceolata forest.
  • [1] HUANG Jinghan, BI Huaxing, ZHAO Danyang, WANG Ning, LIU Zehui, ZHANG Rong.  Vertical distribution of soil moisture in typical plantation in the loess region of western Shanxi Province . Journal of Zhejiang A&F University, 2024, 41(2): 387-395. doi: 10.11833/j.issn.2095-0756.20230228
    [2] ZHAO Pengwu, GUAN Lijuan, ZHOU Mei, SHU Yang, WU Yiheng, CHEN Jiajia.  Undergrowth plant diversity in the northern part of secondary forest in Hanshan Mountain, Inner Mongolia . Journal of Zhejiang A&F University, 2024, 41(1): 41-48. doi: 10.11833/j.issn.2095-0756.20230204
    [3] CHEN Meiling, LIU Xin, CHEN Xinfeng, MENG Miaojing, ZHANG Jinchi, NIE Hui, ZENG Jingyi, XIE Dejin.  Effects of acid rain type change on soil nutrient characteristics and microbial C and N in the Cunninghamia lanceolata plantation . Journal of Zhejiang A&F University, 2022, 39(6): 1278-1288. doi: 10.11833/j.issn.2095-0756.20220132
    [4] JIAN Yongqi, WU Jiasen, SHENG Weixing, NIE Guohui, ZHENG Cheng, JIANG Peikun.  Effects of thinning and stand types on litter stock and soil water-holding capacity . Journal of Zhejiang A&F University, 2021, 38(2): 320-328. doi: 10.11833/j.issn.2095-0756.20200355
    [5] WANG Lanfang, WEI Xinliang, TANG Mengping.  Geographical differentiation characteristics influencing productivity of Cunninghamia lanceolata forests in Zhejiang Province . Journal of Zhejiang A&F University, 2019, 36(6): 1107-1114. doi: 10.11833/j.issn.2095-0756.2019.06.007
    [6] ZHANG Jianguo, XU Wenjun, CUI Huiping, MEI Yangyang, CAI Bifan.  Air anions concentration variation in Forest Park of Citrus Groves in Quzhou . Journal of Zhejiang A&F University, 2016, 33(1): 26-32. doi: 10.11833/j.issn.2095-0756.2016.01.004
    [7] HAN Cheng, ZHANG Jinchi, ZHUANG Yilin, GU Zheyan, LIU Xin, ZHUANG Jiayao.  Rainfall redistribution in a Cunninghamia lanceolata forest of the Yangtze River Delta . Journal of Zhejiang A&F University, 2014, 31(3): 424-430. doi: 10.11833/j.issn.2095-0756.2014.03.015
    [8] LI An-ding, JIA Shen, YU Li-fei.  Microclimates of different microhabitats in Huajiang karst area . Journal of Zhejiang A&F University, 2010, 27(3): 374-378. doi: 10.11833/j.issn.2095-0756.2010.03.009
    [9] ZHANG Ming-ru, YU Yi-wu, ZHAO Ming-shui, ZHANG Zhi-pan, DU Qing-zhou, CHEN Jianxin.  Diurnal changes in the negative ion concentration of the air for two Cryptomeria fortunei communities of National Nature Reserve of Mount Tianmu . Journal of Zhejiang A&F University, 2009, 26(5): 701-707.
    [10] XU Gui-lin, FANG Xi, TIAN Da-lun, TANG Zhi-juan, ZHANG Zhu-san.  Soil organic carbon:distribution and storage with five regeneration patterns in Cunninghamia lanceolata forests . Journal of Zhejiang A&F University, 2009, 26(3): 333-340.
    [11] ZHANG Zhi-pan, YU Yi-wu, ZHANG Ming-ru, DU Qing-zhou, CHEN Jian-xin, MAO Feng-cheng.  Negative air ion concentration and environmental factors for Mount Tianmu of Zhejiang Province . Journal of Zhejiang A&F University, 2008, 25(4): 481-485.
    [12] HE Ying,  WEI Xin-liang,  CAI Xia,  LI Ke-zhui,  WANG Zhen.  Quantitative analysis of community structure in ecological landscape forests . Journal of Zhejiang A&F University, 2007, 24(6): 711-718.
    [13] ZHANG Zhi-pan, YU Yi-wu, MENG Ming-hao, KONG Bang-jie.  Progresses of aeroanion in tourism environments . Journal of Zhejiang A&F University, 2006, 23(1): 103-108.
    [14] FANGXi, TIAN Da-lun, XIANG Wen-hua, LEI Pi-feng.  Vertical distribution of soil organic carbon in Cunninghamia lanceolata plantation . Journal of Zhejiang A&F University, 2004, 21(4): 418-423.
    [15] JIA Ai-ling.  The economic analysis and necessity of transaction of pollution discharge license . Journal of Zhejiang A&F University, 2004, 21(1): 94-98.
    [16] JIANG Pei-kun, XU Qiu-fang, YU Yi-wu.  Microbial biomass carbon as an indicator for evaluation of soil fertility . Journal of Zhejiang A&F University, 2002, 19(1): 17-19.
    [17] YU Yi-wu, WU Jia-sen, JIANG Pei-kun, WU Xiao-hong.  Analysis on nutrient elements in litter under different forests in Huzhou City . Journal of Zhejiang A&F University, 2002, 19(2): 153-156.
    [18] CHEN Guang-shui, XIE Jin-sheng, HE Zong-ming, YOU Shui-sheng, YANG Yu-sheng.  Changes of species composition as affected by the replacement of broad-leaved community by Chines fir community . Journal of Zhejiang A&F University, 2001, 18(4): 349-353.
    [19] LIU Ai-qin, MA Xiang-qing, HE Zhi-ying.  Effect of intercorpping green manure crops on degraded soil improvement of Chinese fir plantation after control burning . Journal of Zhejiang A&F University, 1999, 16(4): 369-374.
    [20] Lin Kaimin, Yu Xintuo, Qiu Erfa, He Zhiying, Lin Sizu.  Nutrient space difference of Chinese Fir Stands with Different Densities. . Journal of Zhejiang A&F University, 1996, 13(3): 243-247.
  • [1]
    LIANG Biling, ZHANG Li, LAI Xin, et al. Analysis of the characteristics of ozone pollution and its relationship with meteorological conditions in Shenzhen[J]. J Meteorol Environ, 2017, 33(1):66-71.
    [2]
    ZHANG Yunhi, HUANG Wei, LONDON S J, et al. Ozone and daily mortality in Shanghai, China[J]. Environ Health Perspect, 2006, 114(8):1227-1232.
    [3]
    D'AMATO G. Effects of climatic changes and urban air pollution on the rising trends of respiratory allergy and asthma[J]. Multidisciplin Respir Med, 2011, 6(1):28-37.
    [4]
    MARTÍNEZ-LAZCANO J C, GONZÁLEZ-GUEVARA E, DEL C R M, et al. The effects of ozone exposure and associated injury mechanisms on the central nervous system[J]. Rev Neurosci, 2013, 24(3):337-352.
    [5]
    ZWICK H, POPP W, WAGNER C, et al. Effects of ozone on the respiratory health, allergic sensitization, and cellular immune system in children[J]. Am Rev Respir Dis, 1991, 144(5):1075-1079.
    [6]
    PARMESAN C. Ecological and evolutionary responses to recent climate change[J]. Ann Rev Ecol Evol Syst, 2006, 37(1):637-669.
    [7]
    ZOU Y, DENG X J, ZHU D, et al. Characteristics of 1 year of observational data of VOCs, NOx and O3 at a suburban site in Guangzhou, China[J]. Atmos Chem Phys, 2015, 15(12):6625-6636.
    [8]
    WANG Hongli. Characterization of volatile organic compounds (VOCs) and the impact on ozone formation during the photochemical smog episode in Shanghai, China[J]. Acta Sci Circumstant, 2015, 35(6):1603-1611.
    [9]
    YANG Chunyan, CHEN Shengbo, WANG Zijun. Application of atmospheric radiation in ozone retrieval[J]. J Anhui Agric Sci, 2010, 38(6):3305-3308.
    [10]
    YAO Qing, SUN Meiling, LIU Aixia. Analysis and prediction of surface ozone concentration and related meteorological factors in summer in Tianjin[J]. Ecol Environ Sci, 2009, 18(6):2206-2210.
    [11]
    JIANG Feng, WANG Fuwei. Analysis of the changes of urban ozone concentration in summer[J]. Environ Sustain Dev, 2016(1):62-64.
    [12]
    YANG Yang, MA Sanmei, WANG Yongfei. Classification, distribution, development of plant stomata[J]. Life Sci Res, 2011, 15(6):550-555.
    [13]
    LIE Ganwen, YE Longhua, XUE Li. Effects of ozone stress on major plant physiological functions[J]. Acta Ecol Sin, 2014, 34(2):294-306.
    [14]
    DUAN Yusen, ZHANG Yihua, WANG Dongfang, et al. Spatialtemporal patterns analysis of ozone pollution in several cities of China[J]. Administrat Tech Environ Monit, 2011, 23(12):34-39.
    [15]
    XU Jing, ZHANG Xiaoling, ZHAO Xiujuan, et al. Influence of summer local circulation on the transportation of ozone from urban to the downwind area in Beijing[J]. China Environ Sci, 2009, 29(11):1140-1146.
    [16]
    WANG Rongtang, WANG Youning, DONG Xiurong. Effects of plasic film covering on dropping ground temperature at the full-growing stages of cotton, maize and soybean[J]. Acta Ecol Sin, 2003, 23(8):1667-1672.
    [17]
    SU Binbin. Characteristics and impact factors of O3 concentrations in mountain background region of East China[J]. Environ Sci, 2013, 34(7):2519-2525.
    [18]
    DUAN Xiaotong, CAO Nianwen, WANG Xiao, et al. Characteristics analysis of the surface ozone concentration of China in 2015[J]. Environ Sci, 2017, 38(12):4976-4982.
    [19]
    TAN Jianguo, LU Guoliang, GENG Fuhai, et al. Analysis and prediction of surface O3 voncentration and telated meteorological factors in summertime in urban area of Shanghai[J]. J Trop Meteorol, 2007, 23(5):515-520.
    [20]
    CHANG Jie, REN Yuan, SHI Yan, et al. An inventory of BVOC meissions for a subtropical urban-rural complex:Greater Taizhou Area[J]. Environ Sci, 2012, 32(2):641-649.
    [21]
    CAI Yanfeng, WANG Tijian, XIE Min, et al. Impacts of atmospheric particles on surface in Nanjing[J]. Clim Environ Res, 2013, 18(2):251-260.
    [22]
    XU Xiaobin, GE Baozhu, LIN Weili. Progresses in the research of ozone production efficiency (OPE)[J]. Adv Earth Sci, 2009, 24(8):845-853.
    [23]
    WANG Zifa, LI Lina, WU Qizhong, et al. Simulation of the impacts of regional transport on summer ozone levels over Beijing[J]. Chin J Nat, 2008, 30(4):194-198.
    [24]
    STREETS D J, FU J H S, JANG C J, et al. Air quality during the 2008 Beijing Olympic Games[J]. Atmos Environ, 2007, 41(3):480-492.
    [25]
    ORDÓÑEZ C, BRUNNER D, STAEHELIN J, et al. Strong influence of lowermost stratospheric ozone on lower tropospheric background ozone changes over Europe[J]. Geophys Res Lett, 2007, 34(7):L07805+. doi:10.1029/2006GL029113,2007.
    [26]
    VINGARZAN R. A review of surface ozone background levels and trends[J]. Atmos Environ, 2004, 38(21):3431-3442.
    [27]
    HOU Xuewei, ZHU Bin, WANG Dongdong. The impact of East Asia Monsoon's conversion on the surface ozone spring maximum in the northwestern Pacific region[J]. Clim Environ Res, 2012, 17(3):303-314.
    [28]
    LAMAUD E, CARRARA A, BRUNET Y, et al. Ozone fluxes above and within a pine forest canopy in dry and wet conditions[J]. Atmos Environ, 2002, 36(1):77-88.
    [29]
    LIU Xinchun, ZHONG Yuting, HE Qing, et al. The variation characteristics and influencing factors of surface ozone concentration in the Taklimakan Desert Hinterland[J]. J Desert Res, 2013, 33(2):626-633.
    [30]
    CHEN Kui, GUO Shenghua, DONG Haiyan, et al. Study on the space-time distribution and change characteristic of ozone concentration in Tianjin[J]. Environ Sustain Dev, 2010, 35(1):17-20.
    [31]
    ZHENG Dong, LI Dan, JI Deyu, et al. Study on ozone in dalian urban and correlation between ozone and PM2.5, other pollutants[J]. Environ Sustain Dev, 2014, 39(6):177-180.
    [32]
    BAI Jianhui, XU Yongfu, CHEN Hui, et al. The variation characteristics and analysis of ozone and its precursors in the Dinghushan Mountain forest area[J]. Clim Environ Res, 2003, 8(3):370-380.
    [33]
    LIU Jian, WU Dui, FAN Shaojia, et al. Impacts of precursors and meteorological factors on ozone pollution in Pearl River Delta[J]. China Environ Sci, 2017, 37(3):813-820.
    [34]
    CHEN Yang, ZHANG Jinpu, HUANG Zuzhao. Spatial-temporal variation of surface ozone in Guangzhou and its relations with meteorological factors[J]. Environ Monit China, 2017, 33(4):99-109.
    [35]
    QI Bing, NIU Yuwen, DU Rongguang, et al. Characteristics of surface ozone concentration in urban site of Hangzhou[J]. China Environ Sci, 2017, 37(2):443-451.
    [36]
    LIU Jiaojiao, JIANG Changtan, SONG Dan, et al. Analysis of distribution characteristics of surface ozone and its influencing factors in summer in Chongqing[J]. J Chongqing Univ Nat Sci Ed, 2014, 37(8):91-98.
    [37]
    CHEN Pengfei, ZHANG Qiang, QUAN Jiannong, et al. Temporal and spatial distribution of ozone concentration by aircraft sounding over Beijing[J]. Chin J Environ Sci, 2012, 33(12):4141-4150.
  • 加载中
通讯作者: 陈斌, bchen63@163.com
  • 1. 

    沈阳化工大学材料科学与工程学院 沈阳 110142

  1. 本站搜索
  2. 百度学术搜索
  3. 万方数据库搜索
  4. CNKI搜索

Figures(4)  / Tables(1)

Article views(3371) PDF downloads(81) Cited by()

Related
Proportional views

Ozone concentrations of three different vertical gradients for a Cunninghamia lanceolata forest in spring and summer at Yandang Mountain National Forest Park, Wenzhou

doi: 10.11833/j.issn.2095-0756.2019.02.011

Abstract: Research on ozone concentration in forests has become a hot area of forest recreation because of its influence on forest growth and environmental quality. The variation of ozone mass concentration at different vertical heights in forest environment has a guiding role in forest recreation activities. Ozone concentration and meteorological factors in three different vertical gradients(The following are expressed by H1, H2 and H3 respectively. H1 stands for 1.5 m from ground, H2 indicates the central part of canopy, H3 means the boundary between canopy and atmosphere.) in Yandang Mountain were monitored for 24 h in the spring and summer of 2017. Their changing features and influencing factors were also observed at the same time. In this experiment, ozone sampler was used to sample three kinds of ozone mass concentration, and the data were processed by variance analysis and multiple comparison analysis. Results indicated that the mean value of 8 h maximum ozone concentration in three different vertical gradients all achieved the primary standard for ambient air quality standards(100 μg·m-3) except for the top of H3 (103.03 μg·m-3) during the spring. Ozone concentration changes for the different vertical gradients was H1 < H2 < H3 in both spring and summer with differences in the daily mean ozone concentration between H1 and H2 and H3 being higher in spring than in summer, there was a significant difference between H2 and H3 (P < 0.05). During the observation period for the two seasons, the daily ozone concentration in the different vertical gradients (H1, H2, and H3) all exhibited a single peak curve, with the highest concentration occurring in 11:00-15:00, whereas the lowest occurring in 5:00. The mean value of the hourly ozone concentration for H1, H2, and H3 during the two seasons was positively related with temperature and wind speed and negatively with humidity as well as pressure. In conclusion, Taking ozone concentration as recreation standard, summer nights was more suitable for people to travel. It was advisable to choose the understory and the middle of the canopy to arrange recreation facilities, such as a plank road in the understory or overhead and a wooden house in a C. lanceolata forest.

SONG Yang, WANG Cheng, LIAO Liang, DUAN Wenjun, HAN Dan, XU Shanshan, DU Qian, WANG Han. Ozone concentrations of three different vertical gradients for a Cunninghamia lanceolata forest in spring and summer at Yandang Mountain National Forest Park, Wenzhou[J]. Journal of Zhejiang A&F University, 2019, 36(2): 298-306. doi: 10.11833/j.issn.2095-0756.2019.02.011
Citation: SONG Yang, WANG Cheng, LIAO Liang, DUAN Wenjun, HAN Dan, XU Shanshan, DU Qian, WANG Han. Ozone concentrations of three different vertical gradients for a Cunninghamia lanceolata forest in spring and summer at Yandang Mountain National Forest Park, Wenzhou[J]. Journal of Zhejiang A&F University, 2019, 36(2): 298-306. doi: 10.11833/j.issn.2095-0756.2019.02.011
  • 近年来中国臭氧(O3)污染问题日益突出,近地面高浓度臭氧已成为影响城市空气质量的主要污染气体[1]。高浓度臭氧会对人类健康及生态环境造成危害,如刺激鼻黏膜、呼吸道、视觉神经、损害中枢神经系统[2-5],以及破坏植物形态,影响植物生理生化功能和生长发育状态等。目前,关于臭氧的研究主要集中在前体物、气象因子、典型天气等影响因素与其的关系,浓度的监测,预测模型的建立,对植物单体及农作物产量的影响等方面。城市森林既是植物生长的载体又是人们日常康养、休闲的重要场所[6],进行林内不同垂直高度的康养活动以及建立不同高度的康养设施有利于人们更加科学合理地使用森林环境,因此对城市森林内不同垂直高度的臭氧浓度研究具有重要意义。但是,中国目前关于森林内臭氧的研究主要集中在森林背景地区,对城市森林内臭氧的研究还极为缺乏。此外,城市森林内植物有机挥发物[7-8]、太阳辐射强度[9]、气象因子[10]等在不同垂直高度的差异可能会引起林内臭氧浓度沿垂直梯度的变化。然而,现有研究还未见对城市森林内不同垂直高度臭氧浓度的研究。因此,本研究以雁荡山国家森林公园内杉木Cunninghamia lanceolata林为对象,研究春夏两季不同高度杉木林环境臭氧质量浓度变化规律,分析臭氧质量浓度与环境因子的关系,为科学开发和利用森林游憩环境,为人们合理选择游憩时间、空间提供理论依据。

  • 雁荡山国家森林公园位于浙江省温州市东北部海滨,属北雁荡山风景区范畴,距温州市区约58 km,东南临近乐清湾,西南与大龙湫雁湖景区相接,北接卓南乡。属中亚热带海洋性季风气候,园内地形较为平坦,四周崖壁陡峭,山谷、缓坡地带分布成片人工杉木林,有少量阔叶树分布,群落层次明显,有乔木、灌木和草本等。季节性降雨明显,春末5-6月为梅雨季节,阴雨连绵,雨量占全年的26%~28%,夏季7-9月受台风影响,多雷阵雨或大暴雨。

  • 杉木林是温州地区较为典型的山地森林植被类型。温州雁荡山国家森林公园的杉木林是20世纪50~60年代营造的人工林,树龄相对一致,树高大致相同。

    本次试验的样地面积约7 680.2 m2,林分郁闭度约0.70。杉木平均高度为12.36 m,平均胸径为11.6 cm;林下灌木主要有少量檵木Loropetalum chinense和杜鹃Rhododendron simsii等。按照人体高度H1(1.5 m),林冠层中部高度H2(6.0 m)和林冠冠层顶部H3(12.0 m)等3个高度设置观测点。

  • 每个监测高度选取正方形竹梯边线相交点观测,3个点分别位于东北角、西南角、东南角(图 1)。臭氧质量浓度采用新西兰产的AeroQualSeries 500臭氧检测仪。该仪器测定范围为0~0.500 mg·kg-1。0~0.100 mg·kg-1范围内精度<0.008 mg·kg-1,0.100~0.500 mg·kg-1范围内精度<0.01 mg·kg-1;气象因子包括温度、相对湿度、露点温度、气压、平均风速等指标。采用美国产Kestrel 3500 Pocket Weather Meter便携风速气象测定仪,温度测定精度范围为-29~70 ℃,相对湿度测定精度范围为5%~95%,风速测定精度范围为0.6~40.0 m·s-1;光照强度采用中国台湾产TES-1332A光照仪,测定范围为0~2×10⁵ lx。

    Figure 1.  Schematic diagram of measurement platform in Cunninghamia lanceolata forest

    北半球环境空气中高浓度臭氧污染事件多发生在春夏季节[11],由中国环境监测总站提供的空气质量报告中,2017年5月及8月温州臭氧污染为首要污染,根据候温划分法结合监测期间当地气温,于2017年5月初、8月(即春夏两季)每月选取多云或晴的3 d,从9:00到次日9:00,对杉木林内3种高度,共9个观测点的臭氧质量浓度及气象因子进行昼夜24 h同步监测,隔2 h监测1次,各观测点安排2人读取和记录数据,每个观测点同一时段连续读取6次数据,每次读取待仪器稳定并间隔2 min。各观测点共获取臭氧质量浓度数值1 296个。

    为科学比较杉木林环境内3种垂直高度空气质量,以中国环境保护部2012年修订的GB 3095-2012《环境空气质量标准》中臭氧质量浓度日最大8 h均值(指1 d中最大的连续8 h平均质量浓度的算术平均值)以及小时均值作为衡量标准。观测期间的温州市区臭氧质量浓度背景值数据由中国环境监测总站提供。

  • 图 2所示:杉木林内各高度臭氧质量浓度最大8 h均值为75.40~116.35 μg·m-3。H1,H2和H3各高度差异显著(P<0.05),其中H1臭氧质量浓度最低,H3最高。这可能是由于H3处于冠层上部边界,是与对流层大气交换最为强烈的区域,一方面外源环境臭氧垂直输送的前体物最先到达H3,导致其臭氧质量浓度最高;另一方面,冠层上部光照强度及紫外辐射最强,为臭氧的生成提供了有利条件;H2处于树冠中部,冠层中部为叶片相对集中区域,且植物气孔主要分布在叶片的上下表皮[12],而气孔是臭氧进入植物体并发生毒害作用的主要通道[13],所以在H2处叶片吸收部分臭氧,其质量浓度相对较低;H1由于处于距地面1.5 m处,臭氧通过H2和H3高度处植物的吸收,到达H1的通量最少。另外,臭氧与土壤的相互作用也在一定程度上降低了H1高度的臭氧质量浓度。

    Figure 2.  Mean O3-8 h in spring and summer of vertical gradient
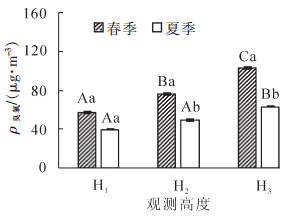
  • 图 3可见:H1春夏两季差异不显著。H2和H3春夏两季差异极显著(P<0.001),且H1,H2和H3各高度从春季到夏季分别下降了108.52%,139.02%和241.70%。其原因可能是由于远距离输送和对流层向下传输有关:一方面温州市区春季背景值高出夏季11.61%,因此受温州市人为源输送影响,春季臭氧质量浓度较高;另一方面该研究区受东亚季风环流系统的影响[14],春季光化学反应产生的高体积分数臭氧,随西风带向东输送,同时夏季风侵入带来低臭氧体积分数的海洋性气团[11, 15]

    Figure 3.  Daily mean value of O3 in vertical gradient

    春夏两季H1,H2和H3臭氧质量浓度日均值均差异显著(P<0.05)。春季H1,H2和H3臭氧浓度为57.11~103.12 μg·m-3,H1最低,H2次之,H3最高;夏季H1,H2和H3臭氧质量浓度为39.64~63.21 μg·m-3,次序与春季相同。虽然林内春夏两季臭氧质量浓度差异较大,但H1,H2和H3臭氧质量浓度变化具有一致性,可能是由于3种高度的光照强度不同,H3处于林冠上部,光强最强,且冠层上部叶片截留太阳总辐射多,会导致最终进入林下光能减少[16],所以H1处光照强度最弱。与此同时,林内辐射通量也间接影响林内温度,导致H1,H2和H3处的温度差异。那么假设在相同质量浓度臭氧前体物水平输送入林内时,H3生成臭氧的光化学反应最为强烈,致使其臭氧质量浓度升高。

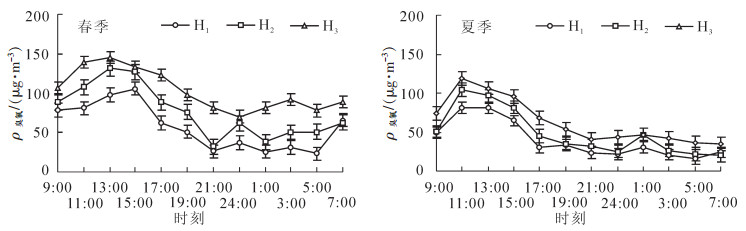
  • 总体来讲,春夏两季H1,H2和H3臭氧质量浓度呈单峰型变化,白天高,夜间低,但各季节H1,H2和H3出现峰值和低谷值的时间存在差异(图 4)。与夏季相比春季臭氧质量浓度昼夜变幅较大。具体为春季峰值出现于13:00-15:00,H1~H3分别达105.63,131.42和145.23 μg·m-3,其中H2和H3峰值比H1提前2 h,低谷值分别出现于5:00(23.01 μg·m-3),21:00(32.14 μg·m-3)和23:00(70.31 μg·m-3);夏季H1,H2和H3峰值均出现在11:00,依次为81.11,104.60和119.04 μg·m-3,低谷值分别出现于5:00(15.24 μg·m-3),7:00(20.55 μg·m-3,34.52 μg·m-3)。

    Figure 4.  Hourly mean value of O3 in vertical gradient

    从同一季节H1,H2和H3臭氧质量浓度日变化曲线来看,各垂直高度的小时均值存在一定差异,除7:00外,各时段均为H1<H2<H3。经方差分析,春夏两季各时间段臭氧质量浓度差异不显著。这一现象的成因可能是杉木林内小气候相对稳定,各高度臭氧质量浓度小时均值差异相对稳定。

    由日最大8 h质量浓度(11:00-17:00时)均值可知,春季H1,H2和H3处日最大8 h均值依次为86.72,113.61和135.37 μg·m-3;夏季H1,H2和H3处日最大8 h均值依次为64.08,81.88和97.34 μg·m-3。各季节日最大8 h均值不仅达到国家一级标准160 μg·m-3,且春季小时均值分别低于国家标准18.19%~84.50%,夏季低于国家标准64.38%~149.67%,说明杉木林内H1,H2和H3处臭氧质量浓度符合中国风景区等空气清洁地区的水平,可以提供相对清洁的空气质量环境,适合进行森林康养、休闲游憩等活动。

  • 将各高度臭氧质量浓度的小时均值与春夏两季气象因子进行相关分析,结果如表 1所示。春季H1,H2和H3处温度、风速与臭氧质量浓度呈极显著正相关(P<0.01),相关系数分别为0.839, 0.839, 0.825和0.699, 0.741, 0.762;与相对湿度、气压呈极显著负相关(P<0.01),相关系数分别为-0.895,-0.909,-0.839和-0.650, 0.741,0.762;夏季同样与温度、风速呈极显著正相关(P<0.01),相关系数分别为0.818, 0.741, 0.804和0.824, 0.838, 0.810;与相对数度呈极显著负相关(P<0.01),相关系数分别为-0.881,-0.916,-0.874。

    季节 垂直梯度 温度 相对湿度 气压 风速 光照强度 紫外辐射
    H1 0.839** -0.895** -0.650* 0.699* -0.223 -0.314
    春季 H2 0.839** -0.909** -0.776** 0.741** -0.216 -0.293
    H3 0.825** -0.839** -0.839** 0.762** -0.349 -0.405
    H1 0.818** -0.881** -0.084 0.824** -0.307 -0.314
    夏季 H2 0.741** -0.916** -0.105 0.838** -0.118 -0.153
    H3 0.804** -0.874** -0.178 0.810** -0.153 -0.167
    说明:*表示在置信度(双侧)为0.05时显著相关;**表示在置信度(双侧)为0.01时极显著相关

    Table 1.  Correlation coefficients of ozone concentration and meteorological factors in vertical gradient

    表 1结果可知:春夏两季杉木林环境内,各高度臭氧质量浓度与气象因子相关性存在一定差异,其中温度、相对湿度、风速与臭氧质量浓度在两季相关性一致;但气压在春季与臭氧有显著相关性,然而夏季相关性不显著;光照强度与紫外辐射在春夏两季均与臭氧质量浓度无显著相关。一定程度下温度升高使臭氧质量浓度升高,其原因可能是,臭氧的生成和运输达到一定温度阈值后,促进杉木林内植物挥发物释放,同时加强光化学反应速率[18],形成空气湍流引起气体交换,进一步输入氮氧化物(NOx)等人为源。森林环境内可在一定程度起到增湿的作用。林内水汽增加,提升臭氧的光化学消耗,在对流层中水汽与臭氧的反应起到汇的作用,反应生成的自由基也是大气光化学过程的重要触发机制。风速对于臭氧质量浓度的积累通常与其传输特质有关,林内风速增大,垂直动量输送加强,有利于近地面层臭氧向林内输送。另外,风速越大湍流作用越强,越有利于光化学反应速率的提升。

  • 与温州市区内春夏最大8 h均值164 μg·m-3(5月173 μg·m-3,8月155 μg·m-3)相比,H1,H2和H3臭氧质量浓度分别低于市区117.50%,67.79%和40.95%。说明杉木林总体环境臭氧质量浓度与温州市区内相比更清洁,其原因可能有2个方面:一方面是森林植物自身的削减作用,当植物进行呼吸作用时,臭氧随植物呼吸进入植物叶片细胞间隙,植物消耗、吸收部分臭氧,降低林内臭氧质量浓度;另一方面,可能是由于雁荡山所处地理位置与城市人为源区距离较远,臭氧前体物气团在长距离输送过程中,一部分通过重力或者垂直运动作用与植物、地面(土壤)相碰撞,从而被捕获或被表面吸附吸收,成为干沉降(其去除途径量级与平流层臭氧的输入量相当),一部分直接进行光化学反应形成臭氧,只有少部分到达林内进一步反应生成臭氧。虽然植物排放的BVOC(植物挥发性有机化合物)与AVOC(人为源挥发性有机化合物)相比更具有反应活性[19],但台州地区对不同植被类型BVOC排放的研究表明[20]:杉木林排放强度仅为建成区的40.44%。臭氧生成量和生成速率不仅和VOCs(挥发性有机化合物)浓度有关,也与NOx和VOCs比值有很强的非线性关系[21],主要表现为VOCs/NOx较高,臭氧生成受NOx控制。反之亦然。从污染较为严重的城市(温州市区)到相对清洁的地区,随着NOx减少,臭氧生成会从VOCs控制转为NOx控制[22],所以雁荡山杉木林内臭氧质量浓度与温州市区相比偏低可能也与林内NOx较低有关。此外,王自发等[23]和STREETS等[24]对臭氧污染模拟研究发现:由于周边地区向研究地及其远郊输送污染物,其贡献率可达20%~60%,同时表明,受周边地区输送污染物的影响,研究地远郊的污染天数高于市区内,说明雁荡山杉木林在外界输送的污染量有可能大于温州市区的情况下,仍能吸收消耗部分臭氧,使整体浓度保持较优水平。

  • 目前,对于臭氧浓度季节变化的研究结果主要分为2类:其一是夏季臭氧浓度为年最大值;其二是春季臭氧浓度为年最大值[25]。出现这一现象的原因可能与所研究地区所处背景环境洁净度、与高浓度污染区域的输送程度,以及局地光化学产生的速率有关。北半球多为人类活动直接影响较小的地区,近地层臭氧以春季为全年最高[26];苏彬彬[17]对华东森林及高山背景区域臭氧浓度研究发现:4月最高1月最低,且有较为明显的季节性变化,由高到低依次为春季,夏季,秋季,冬季,认为其产生季节性变化最主要的原因是:地面臭氧作为一种二次污染物,需要氮氧化物、一氧化碳和挥发性有机物在光照条件下生成,因此光照和温度是最为重要的外界环境;侯雪伟等[27]对低纬度,中纬度及高纬度清洁背景区臭氧浓度季节变化进行研究,发现近地层臭氧春季高、夏季低是广泛存在的现象;也有研究表明:森林地区夏季植物生长旺盛,能降低臭氧浓度[28]。但同样有不少研究表明[18, 29]:由于夏季的太阳辐射强度较强,平均日照时间和平均气温全年最高,臭氧极高值经常出现而导致夏季浓度整体偏高。虽然森林背景下植物挥发物是臭氧的前体物,是提升臭氧浓度的主要因素,但是本研究中即使在夏季高温、高辐射等有利于臭氧光化学反应的条件下,夏季臭氧质量浓度仍低于春季,说明城市森林环境内植物挥发物作为前体物生成的臭氧并不是林内臭氧浓度变化的主导因素,造成春季臭氧质量浓度高于夏季的原因,主要由于背景环境洁净度和高浓度污染区域的输送。

  • 形成日变化的原因可能是,清晨到正午,随着太阳高度角升高,林内光照强度增强,一部分前体物来源于外界输送,另一部分来源于林内植物有机物的挥发,臭氧的光化学反应增强,植物对臭氧的吸收也不断增强[28, 30],但当温度达到一定限值后,植物为了避免蒸腾作用消耗水分,关闭气孔,降低对臭氧的吸收作用,致使环境中臭氧质量浓度达到峰值,夏季质量浓度峰值较春季提前2 h,可能是由于夏季林内温度较高,在光合抑制和高温胁迫的双重作用下,气孔提前关闭,正午过后太阳辐射降低,光强、温度随之下降,BVOCs释放速率在光强超过40 000 lx后释放速率开始减少[31],臭氧的光化学反应强度降低,整体呈下降趋势。土壤微生物活动是不可忽视的一氧化氮排放源,一氧化氮占土壤微生物排放物的95%以上,一氧化氮与臭氧夜间化学反应:O3+NO→NO2+O2[32],使臭氧质量浓度于日出达到低谷,而局部时段臭氧质量浓度波动变化可能是由于风速等气象因子变化引起的。本研究与徐敬等[15]对夏季局部地区环流对北京下风向地区臭氧输送的影响、白建辉等[32]对鼎湖山森林地区臭氧浓度的日变化及刘建等[33]对珠江三角洲臭氧污染的影响研究一致,均表现为单蜂分布,且白天远高于夜间;苏彬彬[17]对武夷山背景点的研究表明:臭氧较高浓度出现在午夜或凌晨,并认为光化学反应不是决定臭氧浓度的主导因素,而是由于日夜交替引起的气象条件所致,说明决定臭氧浓度变化的因素是十分复杂的。

  • 本研究与谈建国等[19]对上海、陈魁等[30]对天津市、郑冬等[31]对大连市、陈漾等[34]对广州市、齐冰等[35]对杭州市、刘姣姣等[36]对重庆市、蔡彦枫等[21]对南京地区近地面臭氧及温度、相对湿度关系研究一致;段玉森等[14]和徐敬等[15]发现城市对下风向地区臭氧具有明显的输送作用,会导致下风向清洁地区出现极高臭氧质量浓度;在气温较低和风速较大的春季和秋季出现相对较小值[37];珠江三角洲高质量浓度臭氧出现在相对湿度低的情况下。春季臭氧质量浓度与气压的相关性较强,气压降低臭氧质量浓度升高。有研究表明北京市处于低压前部是造成臭氧质量浓度高值的主要背景场[29],也有研究表明:高压天气系统通常会引起地面臭氧质量浓度的增加,具体相关关系有待于进一步研究。

  • 雁荡山国家森林公园杉木林不同垂直高度臭氧质量浓度,除春季H3处日最大8 h均值达到中国二类环境功能区质量要求(160~200 μg·m-3),且仅超一类标准3.12%外,春季、夏季各高度日最大8 h均值及小时均值均达到中国一类环境功能区质量要求(100~160 μg·m-3),春季达标率分别超过18.19%和23.73%;夏季达标率分别超过64.38%和36.79%。

    春夏两季各高度臭氧质量浓度日变化具有一致性,均为H1<H2<H3,但春季H1与其余高度相比降幅高于夏季,表现为春季H1比H2和H3分别降低33.54%和80.56%;夏季则分别降低23.38%和59.58%。

    各高度臭氧质量浓度的日变化总体表现为单峰型,白天高,夜间低;春季13:00-15:00最高,5:00最低;夏季11:00最高,最低值时间与春季相同。

    就臭氧质量浓度小时均值分析,春夏两季各高度臭氧质量浓度与温度、风速呈正相关,与相对湿度呈负相关;春季各高度臭氧浓度与气压呈负相关。

    雁荡山国家森林公园杉木林内的臭氧质量浓度总体上达到国家一类标准,是非常适宜开展森林游憩的地区。若从臭氧质量浓度对人体健康影响的角度考虑,在时间选择上,夏季比春季更适合出行,且夜间优于白天,在空间的选择上,建议选择林下距地面1.5 m高处及树冠中部(6.0 m)处进行游憩活动,并在此高度设置林下栈道、空中栈道、森林木屋等游憩设施。

Reference (37)

Catalog

    /

    DownLoad:  Full-Size Img  PowerPoint
    Return
    Return