Volume 40 Issue 5
Sep.  2023
Turn off MathJax
Article Contents

LU Ji, ZHANG Guowei, WU Hao. Inversion study of above-ground biomass in Taiping Lake Ecological Reserve forests using multi-temporal optical and radar data[J]. Journal of Zhejiang A&F University, 2023, 40(5): 1082-1092. doi: 10.11833/j.issn.2095-0756.20220682
Citation: LU Ji, ZHANG Guowei, WU Hao. Inversion study of above-ground biomass in Taiping Lake Ecological Reserve forests using multi-temporal optical and radar data[J]. Journal of Zhejiang A&F University, 2023, 40(5): 1082-1092. doi: 10.11833/j.issn.2095-0756.20220682

Inversion study of above-ground biomass in Taiping Lake Ecological Reserve forests using multi-temporal optical and radar data

doi: 10.11833/j.issn.2095-0756.20220682
  • Received Date: 2022-11-03
  • Accepted Date: 2023-05-24
  • Rev Recd Date: 2023-04-20
  • Available Online: 2023-09-26
  • Publish Date: 2023-09-26
  •   Objective  This study, with the inversion of the above-ground biomass (AGB) of forests in Taiping Lake Ecological Reserve using the Senitinel-1 (SAR) and Sentinel-2 (optical) data with different seasonal time series, is aimed to investigate the inversion potential of optical and radar satellite remote sensing on subtropical forest biomass.   Method  First, based on backscatter coefficients, spectral bands, vegetation indices and biophysical parameters, the regression random forest algorithm was used to explore the accuracy of Sentinel-1 and Sentinel-2 in AGB mapping. Then, an exploration was conducted of the optimal image acquisition period for AGB mapping of subtropical forests which was followed by an evaluation of the contribution of optical and SAR remote sensing feature parameters to the improvement of AGB estimation accuracy.   Result  The accuracy of AGB estimation for forests in the study area using Sentinel-2 data [coefficient of determination (R2)=0.68, root mean square error (ERMS)=37.69 Mg·hm−2] was better than that of Sentinel-1 (R2=0.47, ERMS=49.11 Mg·hm−2), but the combination of the two produced the best results (R2=0.78, ERMS=31.56 Mg·hm−2). The combination of optical data based on the growing season (June and September) and SAR obtained in the dry season (December) was beneficial to improving the accuracy of AGB estimation. The leaf area index (LAI), photosynthetically active radiation absorption ratio (fapar) and cover (fcover) extracted by Sentinel-2 and the VH polarization and VH+VV indices extracted by Sentinel-1 had important contributions to the AGB estimation.   Conclusion  By combining optical and SAR in different seasons, it was clarified that June, September and December are the best temporal phases for AGB inversion while its best predictors are LAI, fapar, VH polarization and VH+VV index. [Ch, 8 fig. 3 tab. 29 ref.]
  • [1] DENG Zaichun, ZHANG Chao, ZHU Xiali, FAN Jinming, QIAN Hui, LI Chengrong.  Pinus yunnanensis volume estimation model based on UAV multispectral image . Journal of Zhejiang A&F University, 2024, 41(1): 49-56. doi: 10.11833/j.issn.2095-0756.20230263
    [2] GONG Yuhao, SUN Yiqun, DONG Chen, HU Yanrong, GAO Weifang.  Site quality evaluation of Cunninghamia lanceolata plantation based on generalized algebraic difference approach and factor selection . Journal of Zhejiang A&F University, 2023, 40(6): 1282-1291. doi: 10.11833/j.issn.2095-0756.20220716
    [3] JIA Yujie, LIU Yungen, YANG Silin, WANG Yan, ZHANG Chao, XU Hongfeng, ZHENG Shujun.  Applicability of land use classification method in Dali City based on Sentinel-2A image . Journal of Zhejiang A&F University, 2022, 39(6): 1350-1358. doi: 10.11833/j.issn.2095-0756.20220134
    [4] JI Yongjie, YANG Congrui, ZHANG Wangfei, ZENG Peng, ZHANG Fuxiang, QU Ya’ni.  Forest above ground biomass estimation using airborne P band polarimetric SAR data . Journal of Zhejiang A&F University, 2022, 39(5): 971-980. doi: 10.11833/j.issn.2095-0756.20220111
    [5] HUANG Yijie, ZHANG Jialong, HU Yaopeng, CHENG Tao.  Uncertainty analysis of estimating aboveground biomass of Pinus densata by remote sensing . Journal of Zhejiang A&F University, 2022, 39(3): 531-539. doi: 10.11833/j.issn.2095-0756.20210473
    [6] YANG Shaoqin, WANG Xiang, XU Cheng, SHANG Tianqi.  Estimating bamboo forest aboveground biomass based on MODIS time series data . Journal of Zhejiang A&F University, 2022, 39(4): 734-741. doi: 10.11833/j.issn.2095-0756.20210431
    [7] DU Yufei, WU Baoguo, CHEN Yuling.  Eucalyptus suitability in Guangxi based on machine learning algorithms . Journal of Zhejiang A&F University, 2020, 37(1): 122-128. doi: 10.11833/j.issn.2095-0756.2020.01.016
    [8] WU Lizhou, WANG Xiaohui, WANG Zhihui, FANG Xin, ZHU Tingyu, DING Lixia.  Crops identification based on hyperspectral data and random forest method . Journal of Zhejiang A&F University, 2020, 37(1): 136-142. doi: 10.11833/j.issn.2095-0756.2020.01.018
    [9] YANG Fan, TANG Mengping.  Relationship between site and structure and its influence on biomass in Phyllostachys edulis forest . Journal of Zhejiang A&F University, 2020, 37(5): 823-832. doi: 10.11833/j.issn.2095-0756.20190572
    [10] YU Lu, HUANG Yanxia, LIU Jingjian, DUAN Lian.  Extraction of polarization characteristics of Oryza sativa growth under the rainfall fluctuation . Journal of Zhejiang A&F University, 2020, 37(5): 992-998. doi: 10.11833/j.issn.2095-0756.20190605
    [11] XIE Fuming, ZI Li, SHU Qingtai.  Optimizing the k-nearest neighbors technique for estimating Pinus densata aboveground biomass based on remote sensing . Journal of Zhejiang A&F University, 2019, 36(3): 515-523. doi: 10.11833/j.issn.2095-0756.2019.03.012
    [12] GUO Wenting, ZHANG Xiaoli.  Vegetation classification based on a multi-feature Sentinel-2 time series . Journal of Zhejiang A&F University, 2019, 36(5): 849-856. doi: 10.11833/j.issn.2095-0756.2019.05.002
    [13] LI Longwei, LI Nan, LU Dengsheng.  Mapping tea gardens spatial distribution in northwestern Zhejiang Province using multi-temporal Sentinel-2 imagery . Journal of Zhejiang A&F University, 2019, 36(5): 841-848. doi: 10.11833/j.issn.2095-0756.2019.05.001
    [14] FENG Yunyun, LIU Lijuan, LU Dengsheng, PANG Yong.  A comparative study of dimension reduction methods for airborne hyperspectral images . Journal of Zhejiang A&F University, 2017, 34(5): 765-774. doi: 10.11833/j.issn.2095-0756.2017.05.001
    [15] RAN Qixiang, DENG Huafeng, HUANG Guosheng, WANG Xuejun, CHEN Zhenxiong.  An aboveground biomass model for Pinus yunnanensis . Journal of Zhejiang A&F University, 2016, 33(4): 605-611. doi: 10.11833/j.issn.2095-0756.2016.04.008
    [16] LÜ Changxiao, DENG Huafeng, WANG Shaojie, CHEN Zhenxiong, WANG Xuejun.  Compatible tree volume and aboveground biomass equations for Pinus massoniana from different regions . Journal of Zhejiang A&F University, 2016, 33(5): 790-797. doi: 10.11833/j.issn.2095-0756.2016.05.010
    [17] SHANG Zhenzhen, ZHOU Guomo, DU Huaqiang.  Relationship between above-ground biomass and DBH for Phyllostachys edulis stands based on fractal theory . Journal of Zhejiang A&F University, 2013, 30(3): 319-324. doi: 10.11833/j.issn.2095-0756.2013.03.002
    [18] YANG Tong-hui, DA Liang-jun, LI Xiu-peng.  Biomass of evergreen broad-leaved forest in Tiantong National Forest Park, Zhejiang Province (II) Aboveground biomass and its allocation pattern . Journal of Zhejiang A&F University, 2007, 24(4): 389-395.
    [19] YANG Tong-hui, DA Liang-jun, SONG Yong-chang, YANG Yong-chuan, WANG Liang-yan.  Biomass of evergreen broad-leaved forest in Tiantong National Forest Park , Zhejiang Province (Ⅰ)Community structure and fresh weight biomass of main tree species . Journal of Zhejiang A&F University, 2005, 22(4): 363-369.
    [20] ZHOU Yong-xue, FAN Jun-feng, YANG Pei-hua, GAO Jian-he, LIU Yong-hong.  Comparative studies on growth and biomass of one-year-old seedlings of Pinus nigra var. austriaca and Pinus tabuleaformis . Journal of Zhejiang A&F University, 2003, 20(4): 438-441.
  • [1]
    DONG Jiarui, ROBERT K K, RANGA B M, et al. Remote sensing estimates of boreal and temperate forest woody biomass: carbon pools, sources, and sinks [J]. Remote Sensing of Environment, 2003, 84(3): 393 − 410.
    [2]
    WANG Shuxian, ZHANG Jialong, LIAO Yi. Research progress in above-ground forest biomass estimation based on landsat time series data [J]. World Forestry Research, 2021, 34(6): 20 − 26.
    [3]
    BACCINI A, GOETZ S J, WALKER W S, et al. Estimated carbon dioxide emissions from tropical deforestation improved by carbon-density maps [J]. Nature Climate Change, 2012, 2(3): 182 − 185.
    [4]
    TIAN Xiaomin, ZHANG Xiaoli. Estimation of forest aboveground biomass by remote sensing [J]. Journal of Beijing Forestry University, 2021, 43(8): 137 − 147.
    [5]
    BACCINI A, GOETZ S J, LAPORTE N, et al. Comment on“A first map of tropical Africa’s above-ground biomass derived from satellite imagery” [J]. Environmental Research Letters, 2011, 6(4): 49001 − 49006.
    [6]
    BOUVET A, MERMOZ S, TOAN T L, et al. An above-ground biomass map of African savannahs and woodlands at 25 m resolution derived from ALOS PALSAR [J]. Remote Sensing of Environment, 2018, 206: 156 − 173.
    [7]
    CHEN Yuanyuan, ZHANG Xiaoli, GAO Xianlian, et al. Estimating average tree height in Xixiaoshan forest farm, northeast China based on Sentinel-1 with Sentinel-2A data [J]. Chinese Journal of Applied Ecology, 2021, 32(8): 2840 − 2846.
    [8]
    MERMOZ S, RÉJOU-MÉCHAIN M, VILLARD L, et al. Decrease of L-band SAR backscatter with biomass of dense forests [J]. Remote Sensing of Environment, 2015, 159: 307 − 317.
    [9]
    PAN Lei, SUN Yujun, WANG Yifu, et al. Estimation of aboveground biomass in a Chinese fir (Cunninghamia lanceolata) forest combining data of Sentinel-1 and Sentinel-2 [J]. Journal of Nanjing Forestry University Natural Sciences Edition, 2020, 44(3): 150 − 157.
    [10]
    PANDIT S, TSUYUKI S, DUBE T. Estimating above-ground biomass in sub-tropical buffer zone community forests, Nepal, using Sentinel 2 data [J/OL]. Remote Sensing, 2018, 10(4): 601[2022-11-01]. doi:10.3390/rs10040601.
    [11]
    DOBOS E, MONTANARELLA L, NÈGRE T, et al. A regional scale soil mapping approach using integrated AVHRR and DEM data [J]. International Journal of Applied Earth Observations &Geoinformation, 2001, 3(1): 30 − 42.
    [12]
    ZHOU Wei, LÜ Yanjie, LIN Qi’nan. Retrieval of above ground biomass in Taiping lake forests using optical and SAR dataset [J]. Journal of Northwest Forestry University, 2023, 38(2): 193 − 200.
    [13]
    CHEN Lin, REN Chunying, ZHANG Bai, et al. Estimation of forest above-ground biomass by geographically weighted regression and machine learning with sentinel imagery [J/OL]. Forests, 2018, 9(10): 582[2022-11-01]. doi: 10.3390/f9100582.
    [14]
    LIU Yanan, GONG Weishu, XING Yanqiu, et al. Estimation of the forest stand mean height and aboveground biomass in northeast China using SAR Sentinel-1B, multispectral Sentinel-2A, and DEM imagery [J]. ISPRS Journal of Photogrammetry and Remote Sensing, 2019, 151(5): 277 − 289.
    [15]
    CHEN Lin, WANG Yeqiao, REN Chunying, et al. Optimal combination of predictors and algorithms for forest above-ground biomass mapping from Sentinel and SRTM data [J/OL]. Remote Sensing, 2019, 11(4): 414[2022-11-01]. doi: 10.3390/rs11040414.
    [16]
    LAURIN G V, BALLING J, CORONA P, et al. Above-ground biomass prediction by Sentinel-1 multitemporal data in central Italy with integration of ALOS2 and Sentinel-2 data[J/OL]. Journal of Applied Remote Sensing, 2018, 12(1): 16008[2022-11-01]. doi: 10.1117/1.JRS.12.016008.
    [17]
    WEISS M, BARET F, JAY S. S2ToolBox Level 2 Products LAI, FAPAR, FCOVER [D]. Paris: Paris-Saclay University, 2016.
    [18]
    STATISTICS L B, BREIMAN L. Random forests [J]. Machine Learning, 2001, 45: 5 − 32.
    [19]
    GISLASON P O, BENEDIKTSSON J A, SVEINSSON J R. Random forests for land cover classification [J]. Pattern Recognition Letters, 2006, 27(4): 294 − 300.
    [20]
    DÍAZ-URIARTE R, de ANDRÉS S A. Gene selection and classification of microarray data using random forest [J]. BMC Bioinformatics, 2006, 7(1): 1 − 13.
    [21]
    VAFAEI S, SOOSANI J, ADELI K, et al. Improving accuracy estimation of forest aboveground biomass based on incorporation of ALOS-2 PALSAR-2 and Sentinel-2A imagery and machine learning: a case study of the Hyrcanian forest area (Iran) [J/OL]. Remote Sensing, 2018, 10(2): 172[2022-11-01]. doi: 10.3390/rs10020172.
    [22]
    ZHAO Panpan, LU Dengsheng, WANG Guanxing, et al. Forest aboveground biomass estimation in Zhejiang Province using the integration of Landsat TM and ALOS PALSAR data [J]. International Journal of Applied Earth Observation and Geoinformation, 2016, 53: 1 − 15.
    [23]
    NAVARRO J A, ALGEET N, FERNÁNDEZ-LANDA A, et al. Integration of UAV, Sentinel-1, and Sentinel-2 data for mangrove plantation aboveground biomass monitoring in Senegal [J/OL]. Remote Sensing, 2019, 11(1): 77[2022-11-01]. doi: 10.3390/rs11010077.
    [24]
    MALENOVSKY Z, ROTT H, CIHLAR J, et al. Sentinels for science: potential of Sentinel-1, -2, and -3 missions for scientific observations of ocean, cryosphere, and land [J]. Remote Sensing of Environment, 2012, 120: 91 − 101.
    [25]
    WANG Jie, XIAO Xiangming, BAJGAIN R, et al. Estimating leaf area index and aboveground biomass of grazing pastures using Sentinel-1, Sentinel-2 and landsat images [J]. ISPRS Journal of Photogrammetry and Remote Sensing, 2019, 154: 189 − 201.
    [26]
    CHEN Yuyun, LI Longwei, LU Dengsheng, et al. Exploring bamboo forest aboveground biomass estimation using Sentinel-2 data [J/OL]. Remote Sensing, 2018, 11(1): 7[2022-11-01]. doi: 10.3390/rs11010007.
    [27]
    GUCCIONE P, LOMBARDI A, GIORDANO R. Assessment of seasonal variations of radar backscattering coefficient using Sentinel-1 data [C]// IEEE. 2016 IEEE International Geoscience and Remote Sensing Symposium. Beijing: IEEE. 2016: 3402 − 3405.
    [28]
    LAURIN G V, LIESENBERG V, CHEN Qi, et al. Optical and SAR sensor synergies for forest and land cover mapping in a tropical site in West Africa [J]. International Journal of Applied Earth Observation and Geoinformation, 2013, 21: 7 − 16.
    [29]
    PULLIAINEN J T, KURVONEN L, HALLIKAINEN M T. Multitemporal behavior of L-and C-band SAR observations of boreal forests [J]. IEEE Transactions on Geoscience and Remote Sensing, 1999, 37(2): 927 − 937.
  • 加载中
通讯作者: 陈斌, bchen63@163.com
  • 1. 

    沈阳化工大学材料科学与工程学院 沈阳 110142

  1. 本站搜索
  2. 百度学术搜索
  3. 万方数据库搜索
  4. CNKI搜索

Figures(8)  / Tables(3)

Article views(198) PDF downloads(15) Cited by()

Related
Proportional views

Inversion study of above-ground biomass in Taiping Lake Ecological Reserve forests using multi-temporal optical and radar data

doi: 10.11833/j.issn.2095-0756.20220682

Abstract:   Objective  This study, with the inversion of the above-ground biomass (AGB) of forests in Taiping Lake Ecological Reserve using the Senitinel-1 (SAR) and Sentinel-2 (optical) data with different seasonal time series, is aimed to investigate the inversion potential of optical and radar satellite remote sensing on subtropical forest biomass.   Method  First, based on backscatter coefficients, spectral bands, vegetation indices and biophysical parameters, the regression random forest algorithm was used to explore the accuracy of Sentinel-1 and Sentinel-2 in AGB mapping. Then, an exploration was conducted of the optimal image acquisition period for AGB mapping of subtropical forests which was followed by an evaluation of the contribution of optical and SAR remote sensing feature parameters to the improvement of AGB estimation accuracy.   Result  The accuracy of AGB estimation for forests in the study area using Sentinel-2 data [coefficient of determination (R2)=0.68, root mean square error (ERMS)=37.69 Mg·hm−2] was better than that of Sentinel-1 (R2=0.47, ERMS=49.11 Mg·hm−2), but the combination of the two produced the best results (R2=0.78, ERMS=31.56 Mg·hm−2). The combination of optical data based on the growing season (June and September) and SAR obtained in the dry season (December) was beneficial to improving the accuracy of AGB estimation. The leaf area index (LAI), photosynthetically active radiation absorption ratio (fapar) and cover (fcover) extracted by Sentinel-2 and the VH polarization and VH+VV indices extracted by Sentinel-1 had important contributions to the AGB estimation.   Conclusion  By combining optical and SAR in different seasons, it was clarified that June, September and December are the best temporal phases for AGB inversion while its best predictors are LAI, fapar, VH polarization and VH+VV index. [Ch, 8 fig. 3 tab. 29 ref.]

LU Ji, ZHANG Guowei, WU Hao. Inversion study of above-ground biomass in Taiping Lake Ecological Reserve forests using multi-temporal optical and radar data[J]. Journal of Zhejiang A&F University, 2023, 40(5): 1082-1092. doi: 10.11833/j.issn.2095-0756.20220682
Citation: LU Ji, ZHANG Guowei, WU Hao. Inversion study of above-ground biomass in Taiping Lake Ecological Reserve forests using multi-temporal optical and radar data[J]. Journal of Zhejiang A&F University, 2023, 40(5): 1082-1092. doi: 10.11833/j.issn.2095-0756.20220682
  • 森林是陆地生态系统的主体,主导陆地碳循环的动态变化,在全球碳收支中发挥着重要作用[12]。森林碳储量的动态变化可以通过定期绘制森林地上生物量进行监测[3]。基于样地的森林调查方法可以提供精确的森林地上生物量。然而,在大尺度监测中存在局限性,例如调查周期较长、时间分辨率不高等问题[4]。因此,寻求大面积森林生物量和碳储量精准监测的方法显得尤为重要。

    遥感技术为大面积反演森林地上生物量(AGB)或碳储量提供了全覆盖和长时间序列数据。目前,已有研究使用较高分辨率(>30 m)的光学数据(Sentinel-2)[5]和合成孔径雷达(Sentinel-1)数据[6](25 m)进行大尺度森林地上生物量反演。但现有研究对地上生物量的估计往往出现相互矛盾和不一致的现象,可能是缺乏大量的地面数据参考;也可能是森林结构复杂存在空间异质性,遥感信号响应机制不清晰等所致[78]。尤其对于热带或者亚热带森林地区,高郁闭特征和异质性需要探讨光学和合成孔径雷达数据的互补机制,以提高热带森林地上生物量反演的准确性和一致性。

    近年来,已有研究通过单个传感器或者联合光学雷达,来评估Sentinel数据对不同生物群落的森林地上生物量反演潜力[9]。如PANDIT等[10]采用Sentinel-2数据及其衍生的光谱指数,发现与光谱波段相比,红边植被指数对地上生物量估计具有更高的贡献度。也有研究表明:Sentinel-1数据在地上生物量和碳储量反演方面也有较大的优势[11]。周蔚等[12]对亚热带森林地上生物量建模中,发现Sentinel-2的光谱指数比光谱波段贡献度更大,并且联合Sentinel-1和Sentinel-2数据反演精度最佳。CHEN等[13]采用Sentinel-1和Sentinel-2及其衍生数据(如纹理、光谱指数、生物物理变量),系统比较了1种参数化(地理图形加权回归)和3种非参数化的机器学习算法(支持向量机、随机森林和人工神经网络)的地上生物量建模方法,结果表明:Sentinel-1的纹理特性和Sentinel-2的生物物理变量是地上生物量估计模型的最优变量。LIU等[14]和CHEN等[15]结合了Sentinel-1、Sentinel-2和航天飞机雷达地形测绘任务(SRTM)的数字高程模型(DEM)数据,验证了Sentinel-1和Sentinel-2对森林地上生物量绘图的适用性,并且发现随机森林算法的精度最优。然而,以上研究大都是基于生长季时期的研究,鲜有采用不同季节的光学和雷达数据对森林地上生物量反演进行探究,尤其是亚热带地区夏季降水多,森林湿度较大,雷达对地表湿度比生物量更加敏感。鉴于此,本研究以太平湖生态保护区森林为例,采用随机森林算法评估不同季节Sentinel-1和Sentinel-2数据的光学和雷达遥感信息对地上生物量的响应特征,以期为亚热带森林碳储量精准评估提供科学参考。

    • 本研究区位于黄山市太平湖生态保护区,该区地处亚热带季风湿润气候,年均降水量达1 617.0 mm,年均气温为15.5 ℃,年日照时数>1 600.0 h,年均蒸发量>1 100.0 mm。研究区森林覆盖面积约9万$ {\rm{hm}}^{2}$,平均海拔为220 m,高差为750 m,平均坡度为22°。生态保护区植物资源丰富,乔、灌树种900多种。研究区为亚热带针阔混交林,以中幼林龄为主,常见主要树种包括马尾松Pinus massoniana、栎树Quercus、木荷Schima superba、桦树Betula、楝Melia azedarach、樟树Cinnamomum camphora、杉木Cunninghamia lanceolata、毛竹Phyllostachys edulis等。

    • 62个样地数据来源于2019年生态保护区一类清查数据,调查时间为2019年8—9月。每个样地大小为25.82 m×25.82 m,样地调查因子包括树种、株数密度、胸径、树高等。每个样地的地上生物量计算采用一元地上生物量方程:

      式(1)中:Ma为地上生物量;D为胸径;ab为不同树种系数。不同树种系数取值参考周蔚等[12]的研究。每个样地树木地上生物量累计值为样地尺度的地上生物量。样地参数统计如表1所示。

      项目地上生物量/
      (Mg·hm−2)
      胸径/
      cm
      树高/
      m
      株数密度/
      (株·hm−2)
      最小值5.758.005.00115
      最大值260.2828.0022.003 000
      平均值82.8616.0012.001 005
      标准差64.685.306.12699

      Table 1.  Statistics of forest plot parameters in the study area

    • 考虑覆盖各个生长季节,选择2019年1、3、6、9、12月5期Sentinel-1和Sentinel-2影像数据,其中Sentinel-2影像云量均<10%。卫星数据从欧空局Sentinel数据中心(https:// scihub.copernicus.eu/dhus/#/home)下载。

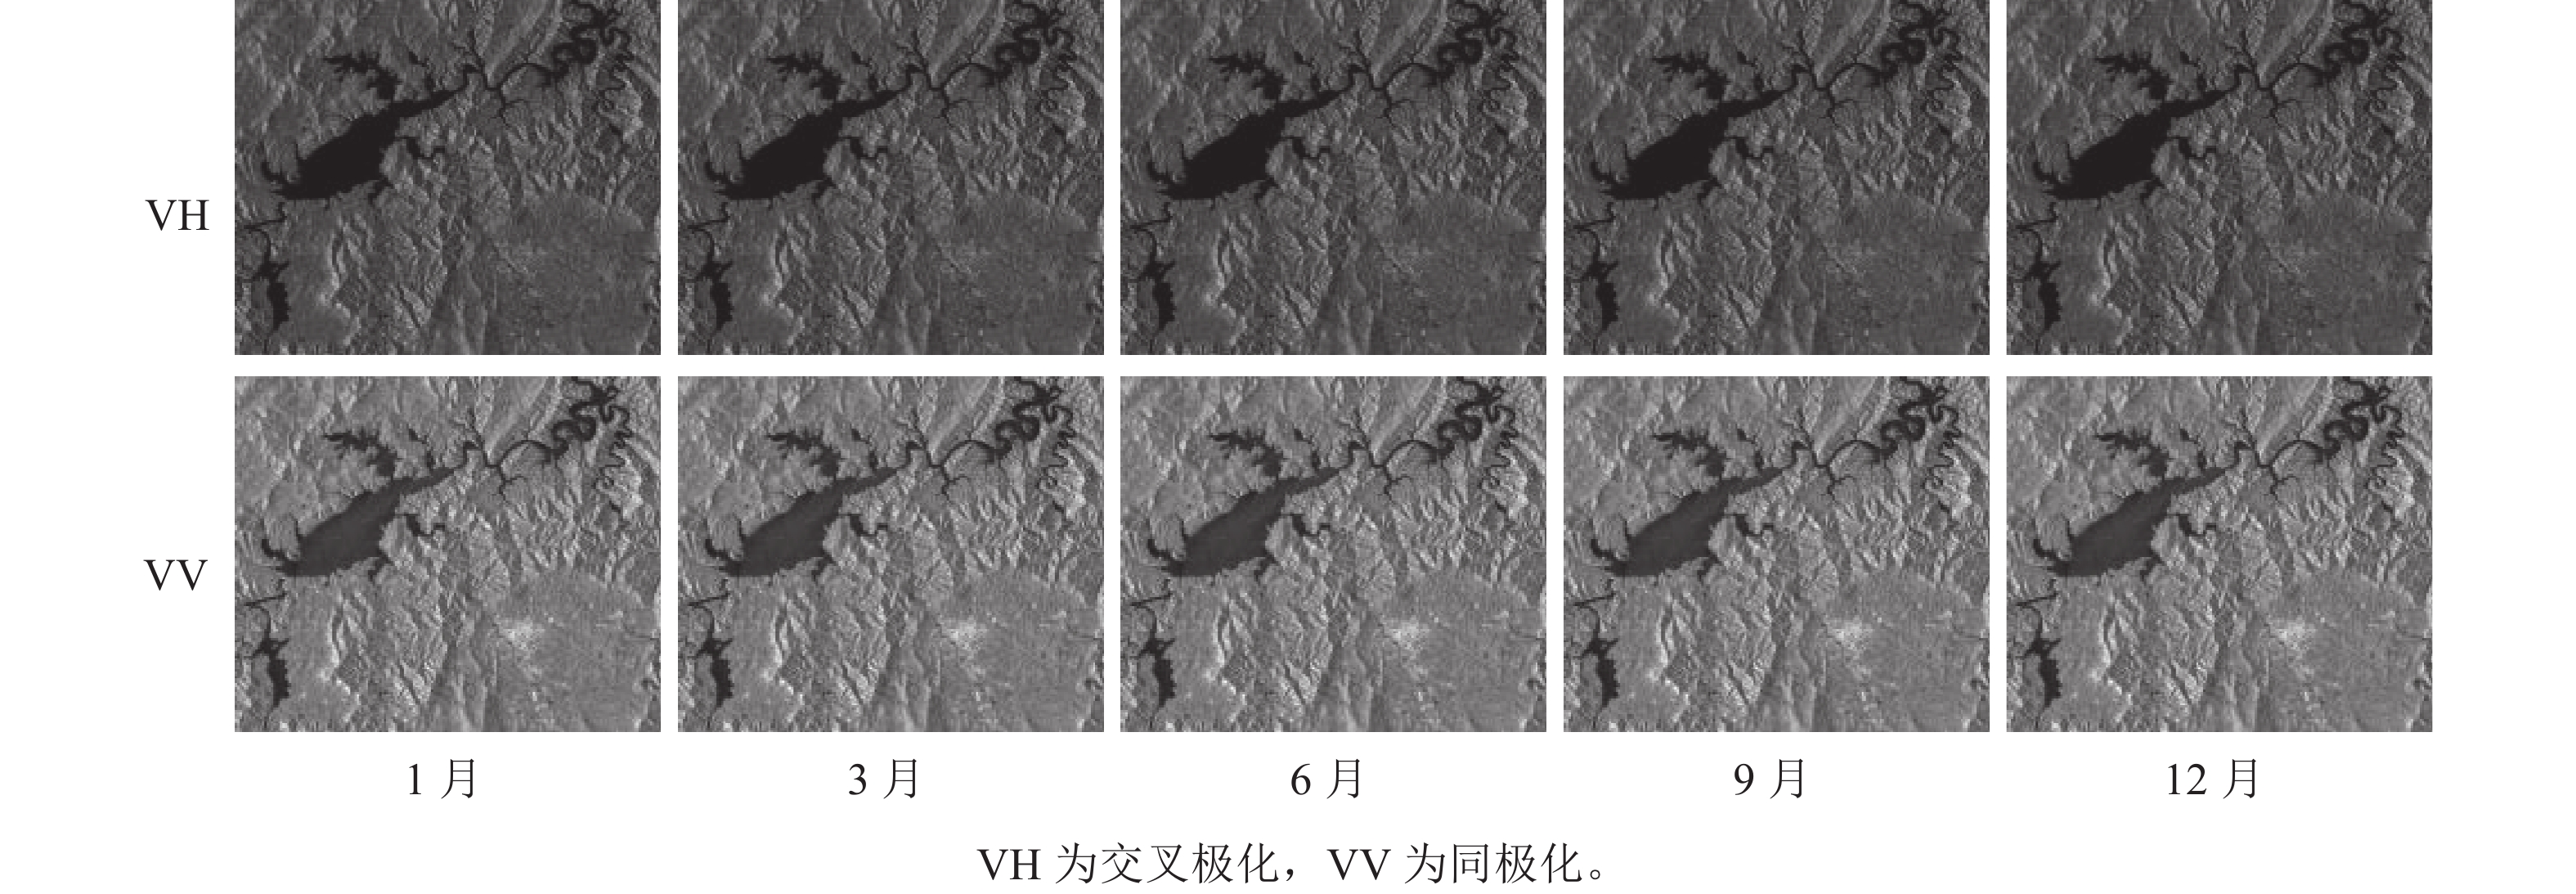
    • Sentinel-1数据选择干涉宽幅模式(interferometric wide swath,IW),具有双极化(VV和VH)的升轨数据。该产品类型是多视影像(GRD),空间分辨率为10 m,采集入射角为26°~40°。本研究共采集了5景不同季节影像,并根据研究区范围进行裁剪。对每景Sentinel-1影像数据预处理,采用欧空局官方公布的哨兵应用平台软件(SNAP)进行精确轨道校正、地形辐射校正(归一化)和斑点过滤(图1)。其中,采用SRTM数字高程模型(DEM)用于地形校正,地形辐射校正后的图像采用Lee斑点过滤算法以减少斑点。为了避免后向散射系数值较小对后续计算和分析造成的影响,将其转化成归一化值[16]

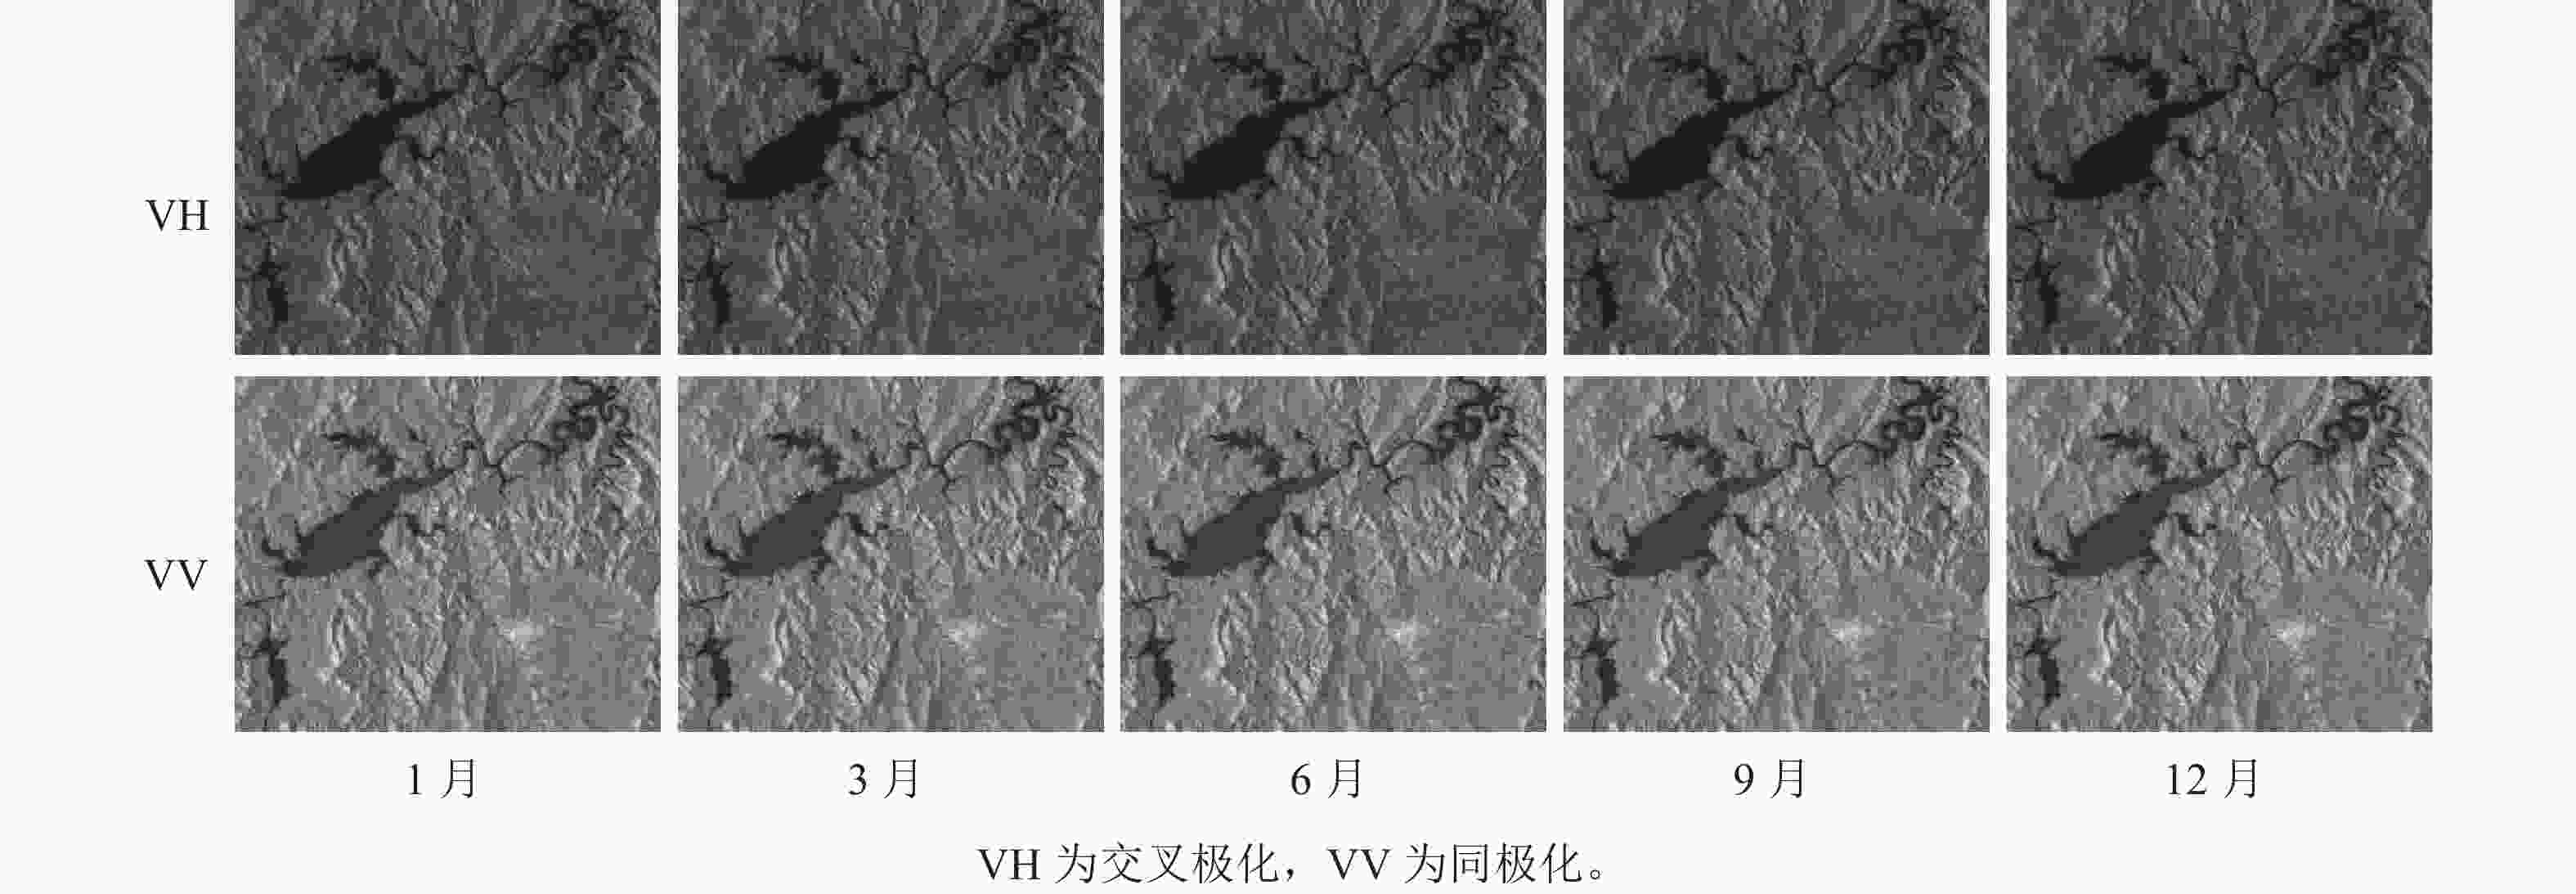
      Figure 1.  Polarization backscattering coefficients of VH and VV in different seasons

      式(2)中:dB为归一化后的后向散射系数,$ {\sigma }_{0} $为VH或者VV极化的后向散射系数。此外,根据LAURIN等[16]的研究,采用dB的差值(VH−VV)与求和(VH+VV)有助于提高地上生物量的建模精度。

    • 本研究选择云量小于5%的Sentinel-2影像,共采集10张影像覆盖研究区域。对于每景影像,使用SNAP中的Sen2cor插件进行大气校正,将L1C (大气顶部TOA)产品转换为L2A (大气底部BOA)。大气校正过后的Sentinel-2影像,将3个可见光、3个红边、2个近红外、2个短波红外(B11和B12)共10个波段数据的空间分辨率重采样为20 m,用于后续的预处理和分析。采用SNAP中的“Biophysical Processor”提取叶面积指数(LAI)、植被覆盖率(fcover)和光合有效辐射吸收比(fapar) 3个生物物理参数,描述植被状态和空间动态分布(图2)。这3个生物物理参数是基于PROSAIL辐射传输模型反演获得[17]。主要计算步骤包括:①标准化输入。将10个波段的BOA数据输入模型;②人工神经网络(ANN)算法反演。基于PROSAIL模型构建查找表并采用ANN训练输入参数和模拟光谱的非线性关系;③标准化输出。根据Sentinel-2观测值输出选择的目标参数;④生成质量评估指标。评估反演值的不确定性。除3个生物物理参数外,还基于Sentinel-1和Sentinel-2影像,提取了光谱波段、光谱指数、生物物理参数和后向散射系数用于地上生物量建模的遥感特征参数(表2)。

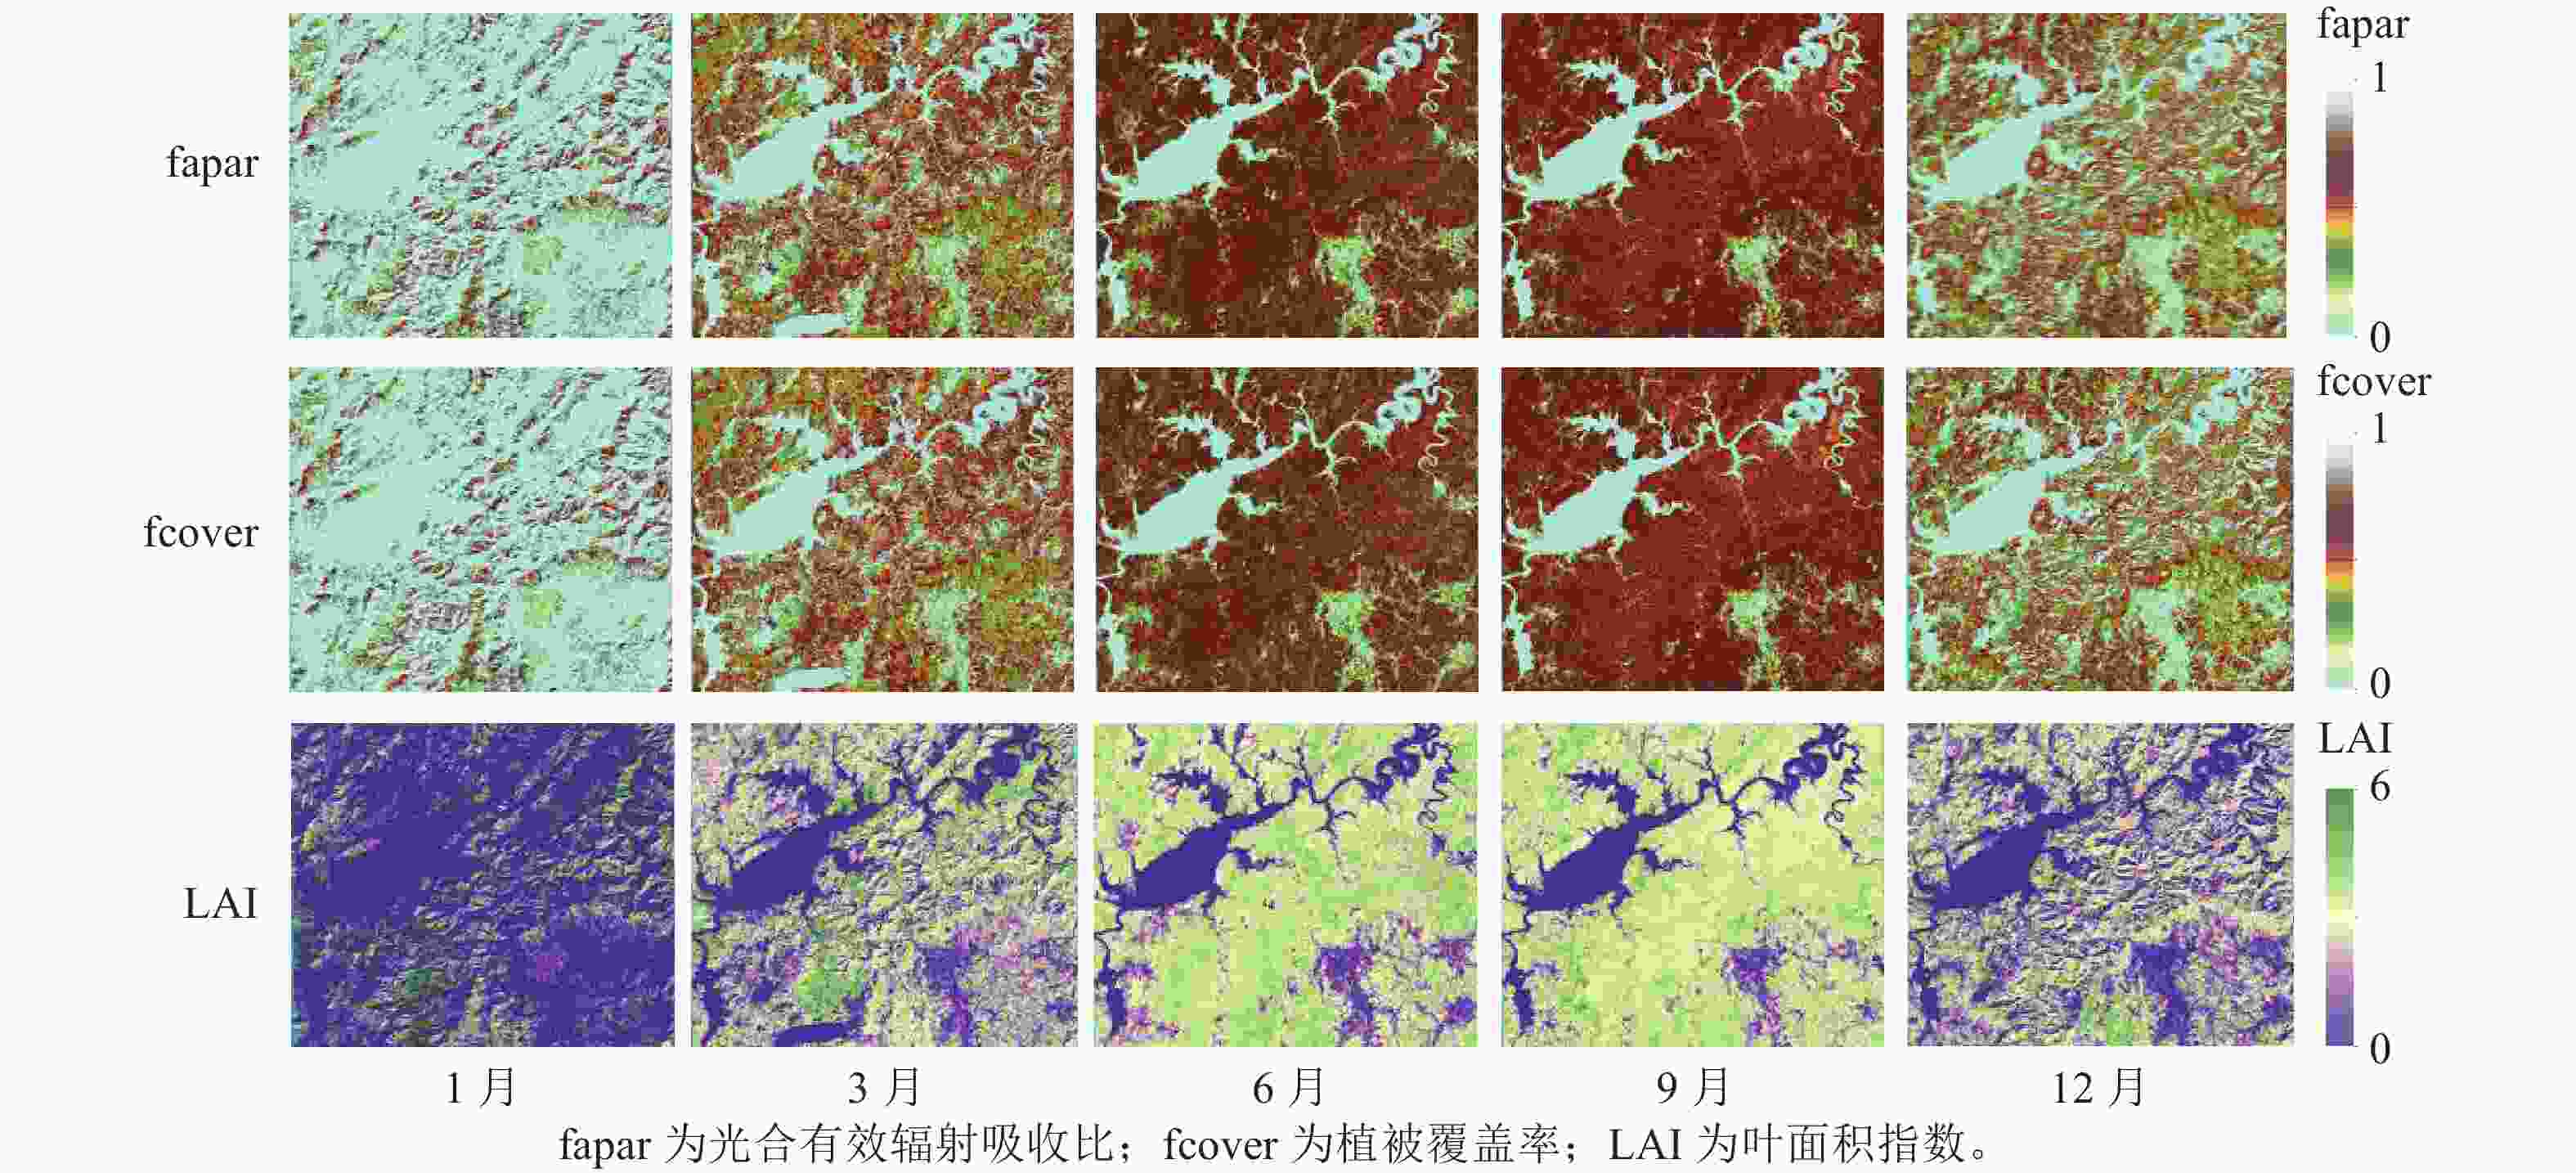
      Figure 2.  Biophysical parameters in different seasons

      传感器类别特征参数计算等式或方法
      Sentinel-1 后向散射系数 VV
      VH
      VH−VV
      VH+VV
      Sentinel-2 光谱波段 B2 (490 nm)、B3 (560 nm)、B4 (665 nm)、B5 (705 nm)、
      B6 (749 nm)、B7 (783 nm) 、B8 (842 nm)、
      B8a (865 nm)、B11 (1 610 nm)、B12 (2190 nm)
      光谱指数 归一化植被指数(NDVI) (B8B4)/(B8+B4)
      增强植被指数(EVI) 2.5[(B8B4)/(B8+6B4−7.5B2+1)]
      植被水分敏感指数Ⅰ(STVI1) B11B4/ B8
      植被水分敏感指数Ⅱ(STVI2) B8/(B4B12)
      归一化植被水分指数(NDWI) (B3B8)/(B3+B8)
      生物物理参数 叶面积指数(LAI) PROSAIL模型反演
      植被覆盖度(fcover) PROSAIL模型反演
      光合有效辐射吸收比(fapar) PROSAIL模型反演
        说明:−表示无计算等式或方法。

      Table 2.  Sentinel feature parameters for above-ground biomass modelling

    • 对研究区亚热带森林地上生物量估算采用随机森林回归方法。随机森林算法通过生成大量的决策树,每一个决策树都是使用训练数据的唯一引导样本独立构建,对所有决策树预测器的平均值作为最终目标变量的估计值[18]。随机森林根据所有可用的预测器随机选择,减少决策树之间的相关性,从而减少噪声和提高预测的准确性[19]。随机森林算法对数据冗余和非线性处理具有很好的鲁棒性,能够处理具有不同属性和数值范围差异较大的变量,避免产生较大的过拟合现象[20]

      随机森林回归模型采用R语言的“randomForest”包(适用于分类和回归训练)实现。该软件包通过给定的模型参数范围进行迭代,获得模型最佳性能的参数组合。决策树个数(ntree)和每个节点上随机选择的预测变量数量(mtry)采用网格搜索法优化设定。

    • 为了比较时间序列上Sentinel-1和Sentinel-2数据对地上生物量的估算结果,建立了6组回归模型(表3)。在进行每个回归模型训练前,采用方差膨胀因子(VIF<10)排除共线性强的变量,减少模型过拟合问题。此外,采用十折交叉验证的方法进行模型训练和验证。最后,利用决定系数(R²)、均方根误差(ERMS)对每个模型的地上生物量估算精度进行评价。

      模型变量数/个变量定义
      S1-backscatter 10 所有季节Sentinel-1后向散射系数
      S1-all 20 所有季节Sentinel-1后向散射系数和衍生指数
      S2-spectral 50 所有季节Sentinel-2光谱波段
      S2-biophysical 15 所有季节Sentinel-2生物物理参数
      S2-all 90 所有季节Sentinel-2光谱波段、植被指数和生物物理参数
      S1S2-all 110 所有季节Sentinel-1和Sentinel-2变量

      Table 3.  Above-ground biomass modelling based on Sentinel-1 and Sentinel-2

      式(3)~(4)中:Oi为地上生物量观测值;Pi为地上生物量预测值;$\overline{{M}}$为地上生物量样地观测平均值;i为样地号;n为样地总数量。
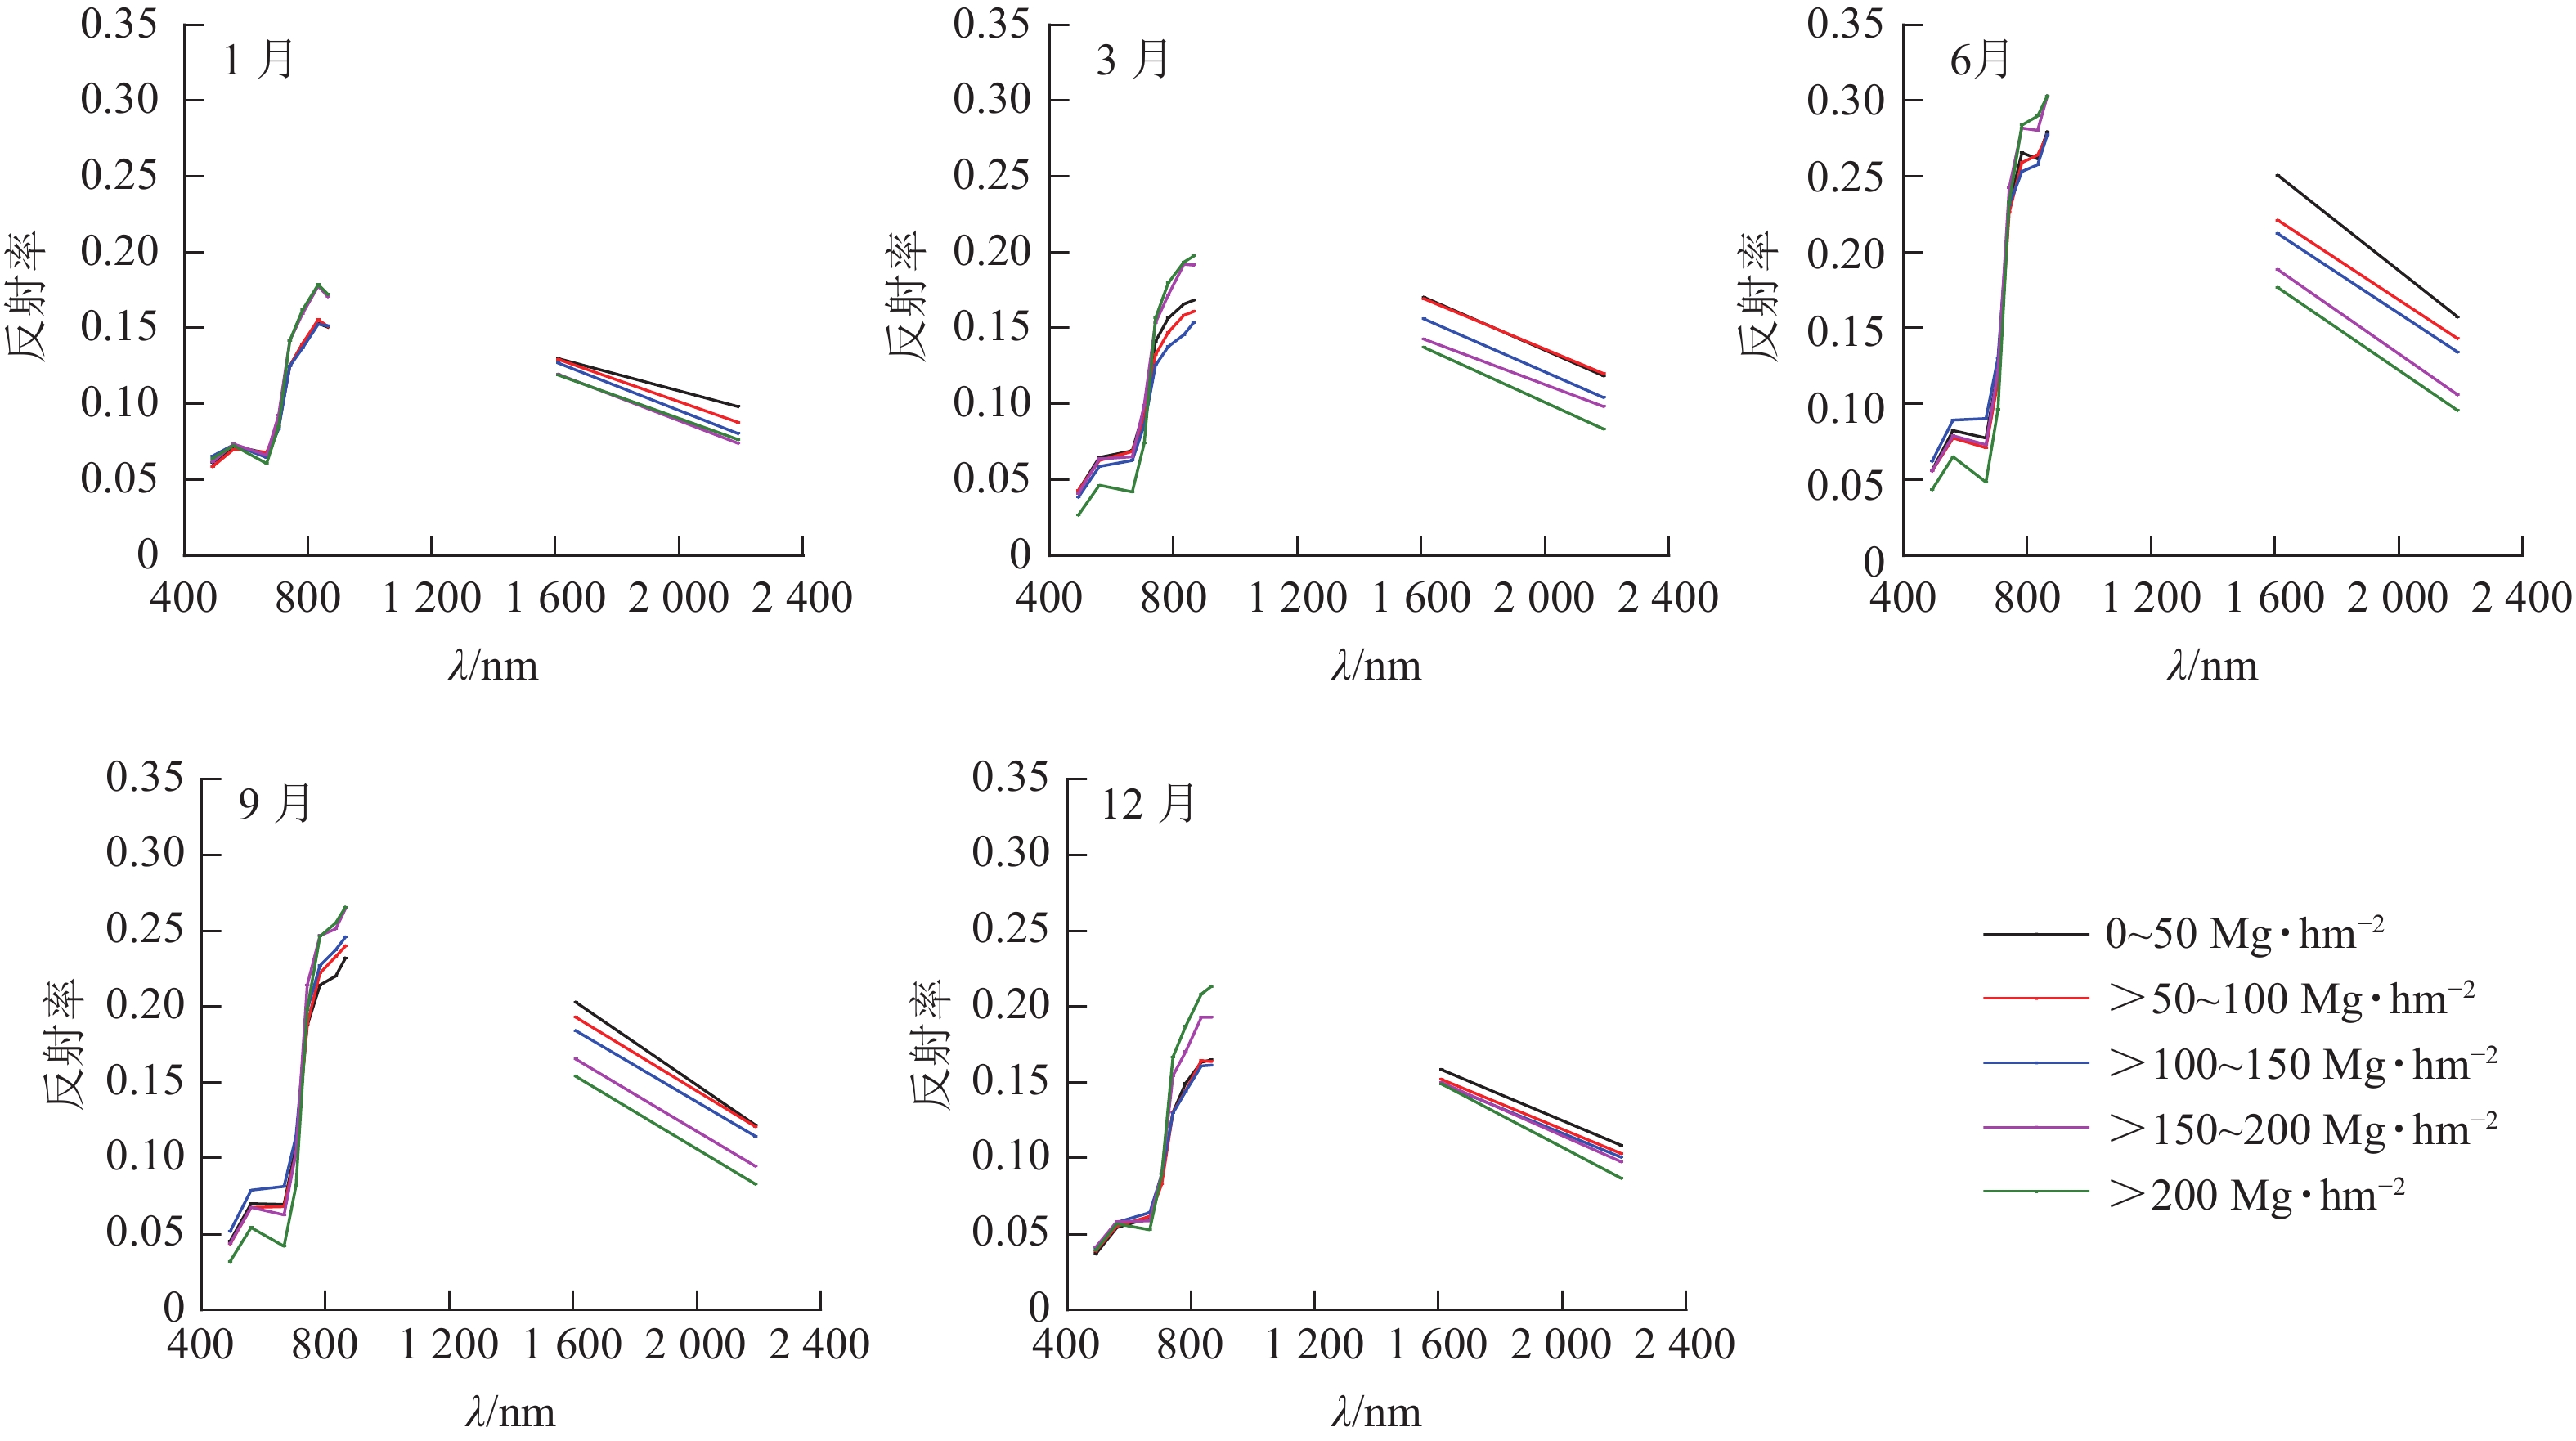
    • 图3所示: 在近红外波段,LAI对冠层反射率的贡献占主导地位,森林地上生物量越大LAI越大。因此,对于相同季节,近红外波段的森林冠层反射率随森林地上生物量增大而增大。然而,在短波红外,森林冠层主要受水分影响。因此,在短波红外的森林冠层反射率随森林地上生物量的增大而减小。总体而言,6和9月的森林冠层反射率较大,并且不同地上生物量水平间的冠层反射率区分度较大;相反,1、3和12月不同地上生物量水平间的森林冠层反射率差异性减小,主要是由于在这些月份不同地上生物量水平的森林叶面积差异不显著。

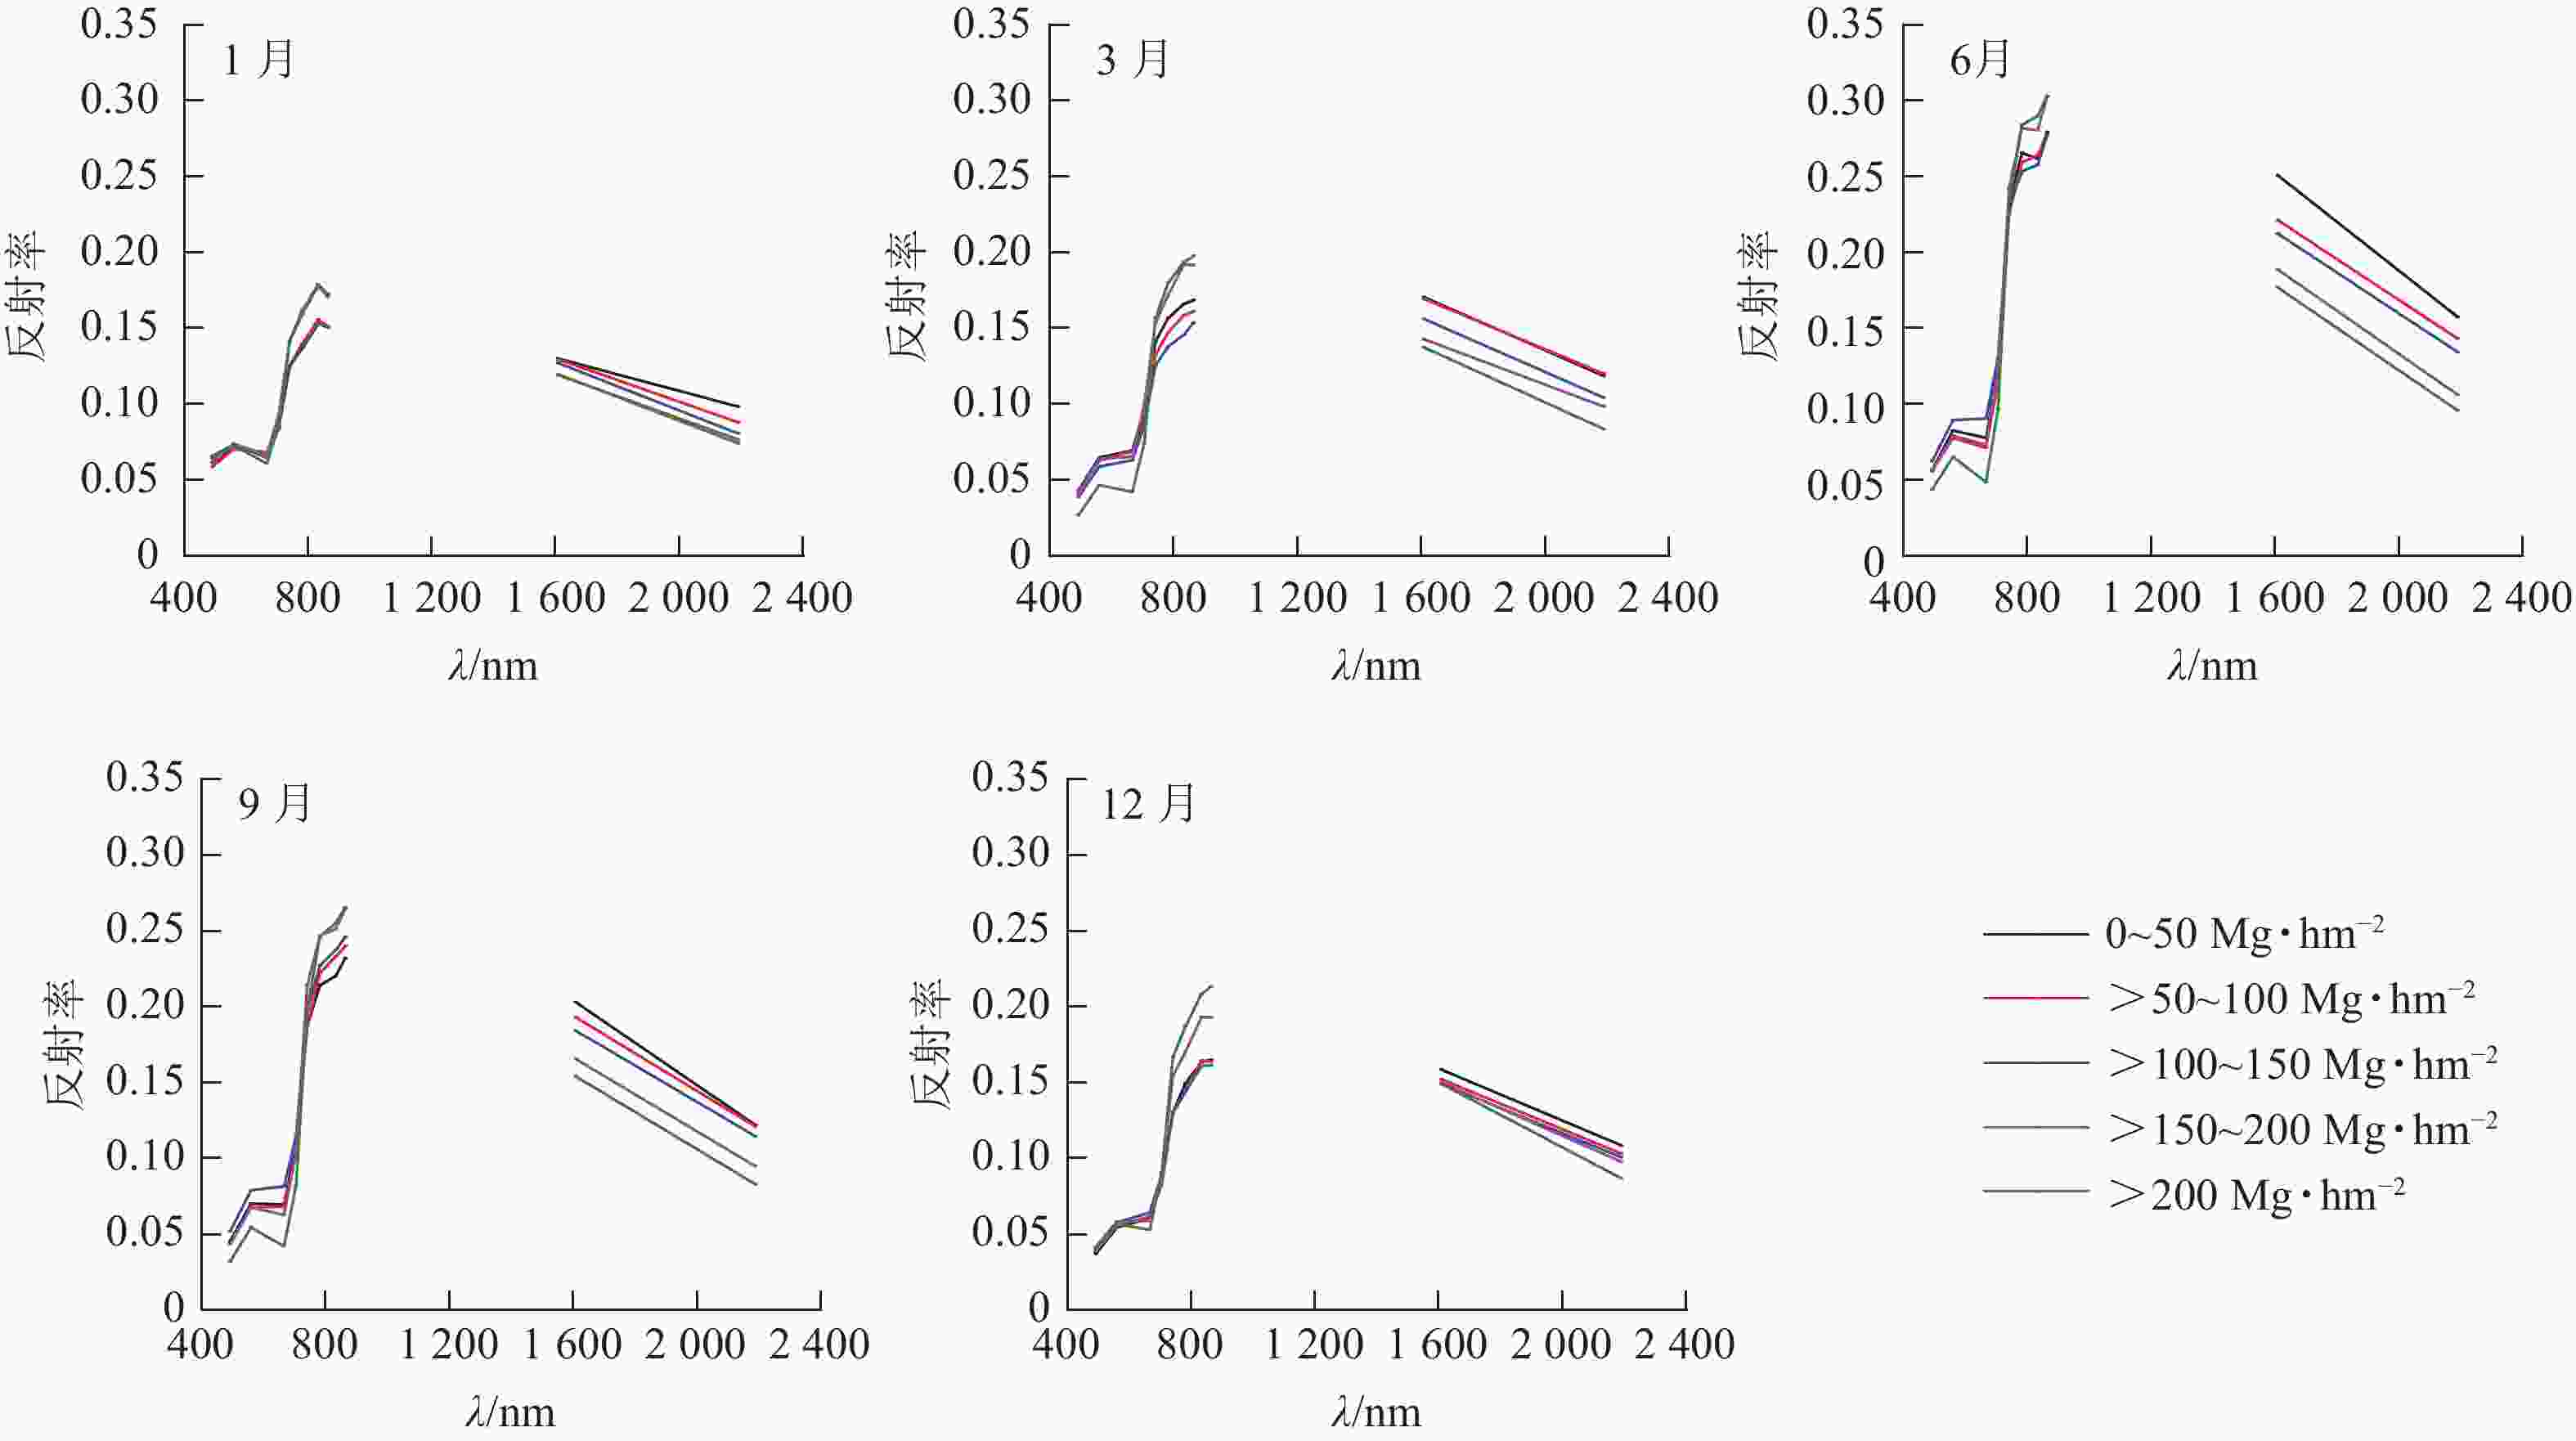
      Figure 3.  Seasonal variation of forest canopy reflectance spectra under different above-ground biomass levels
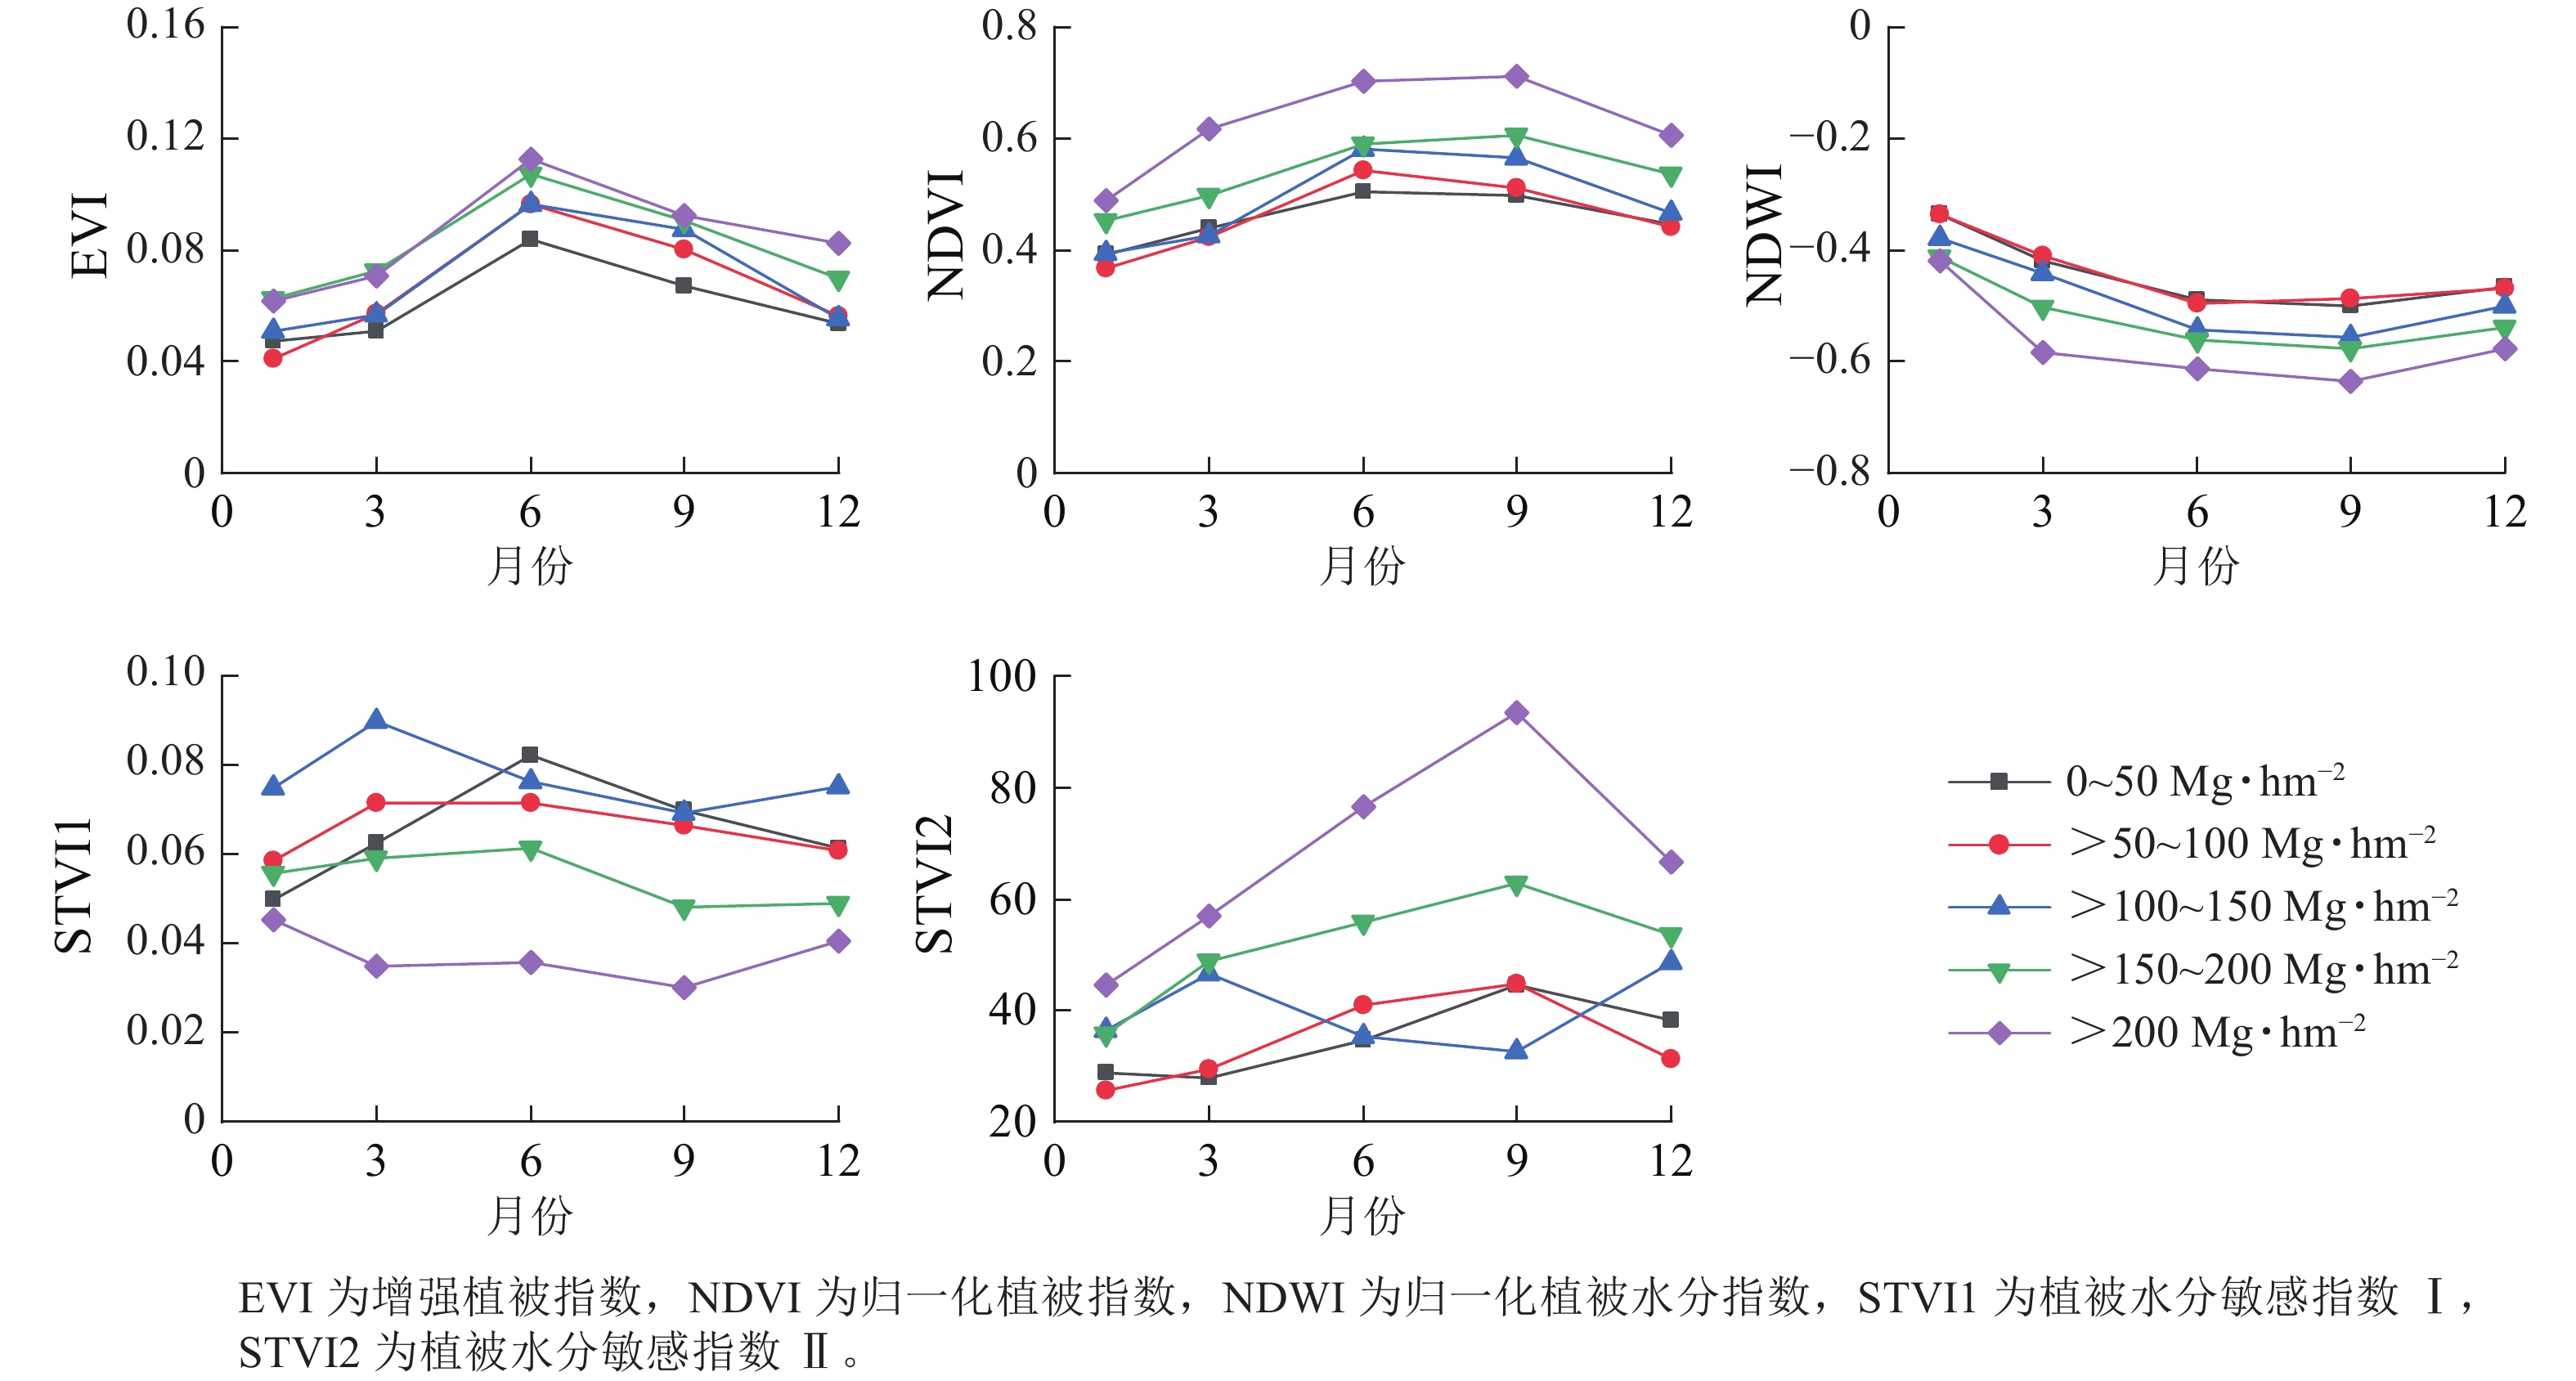
      图4可见:增强植被指数(EVI)和归一化植被指数(NDVI)在相同季节随着地上生物量等级升高而增大;相反,归一化植被水分指数(NDWI)在相同季节随着地上生物量等级升高而降低。此外,地上生物量在较低等级(0~150 Mg·hm−2)范围内,相同季节的EVI和NDVI指数变化难以区分;而在地上生物量较高等级(>150 Mg·hm−2)范围内,NDVI对地上生物量的敏感度要优于EVI指数。相似地,在地上生物量较低等级范围内,植被水分敏感指数Ⅰ(STVI1)和植被水分敏感指数Ⅱ(STVI2)在相同季节性差异不大,但在地上生物量较高等级范围差异相对明显。与光谱指数相似,fapar、fcover、LAI在不同季节变化趋势一致,呈现先增高后降低的趋势(图5)。当地上生物量在0~100 Mg·hm−2与>100 Mg·hm−2范围内时,3个生物物理参数在相同季节差异不明显。

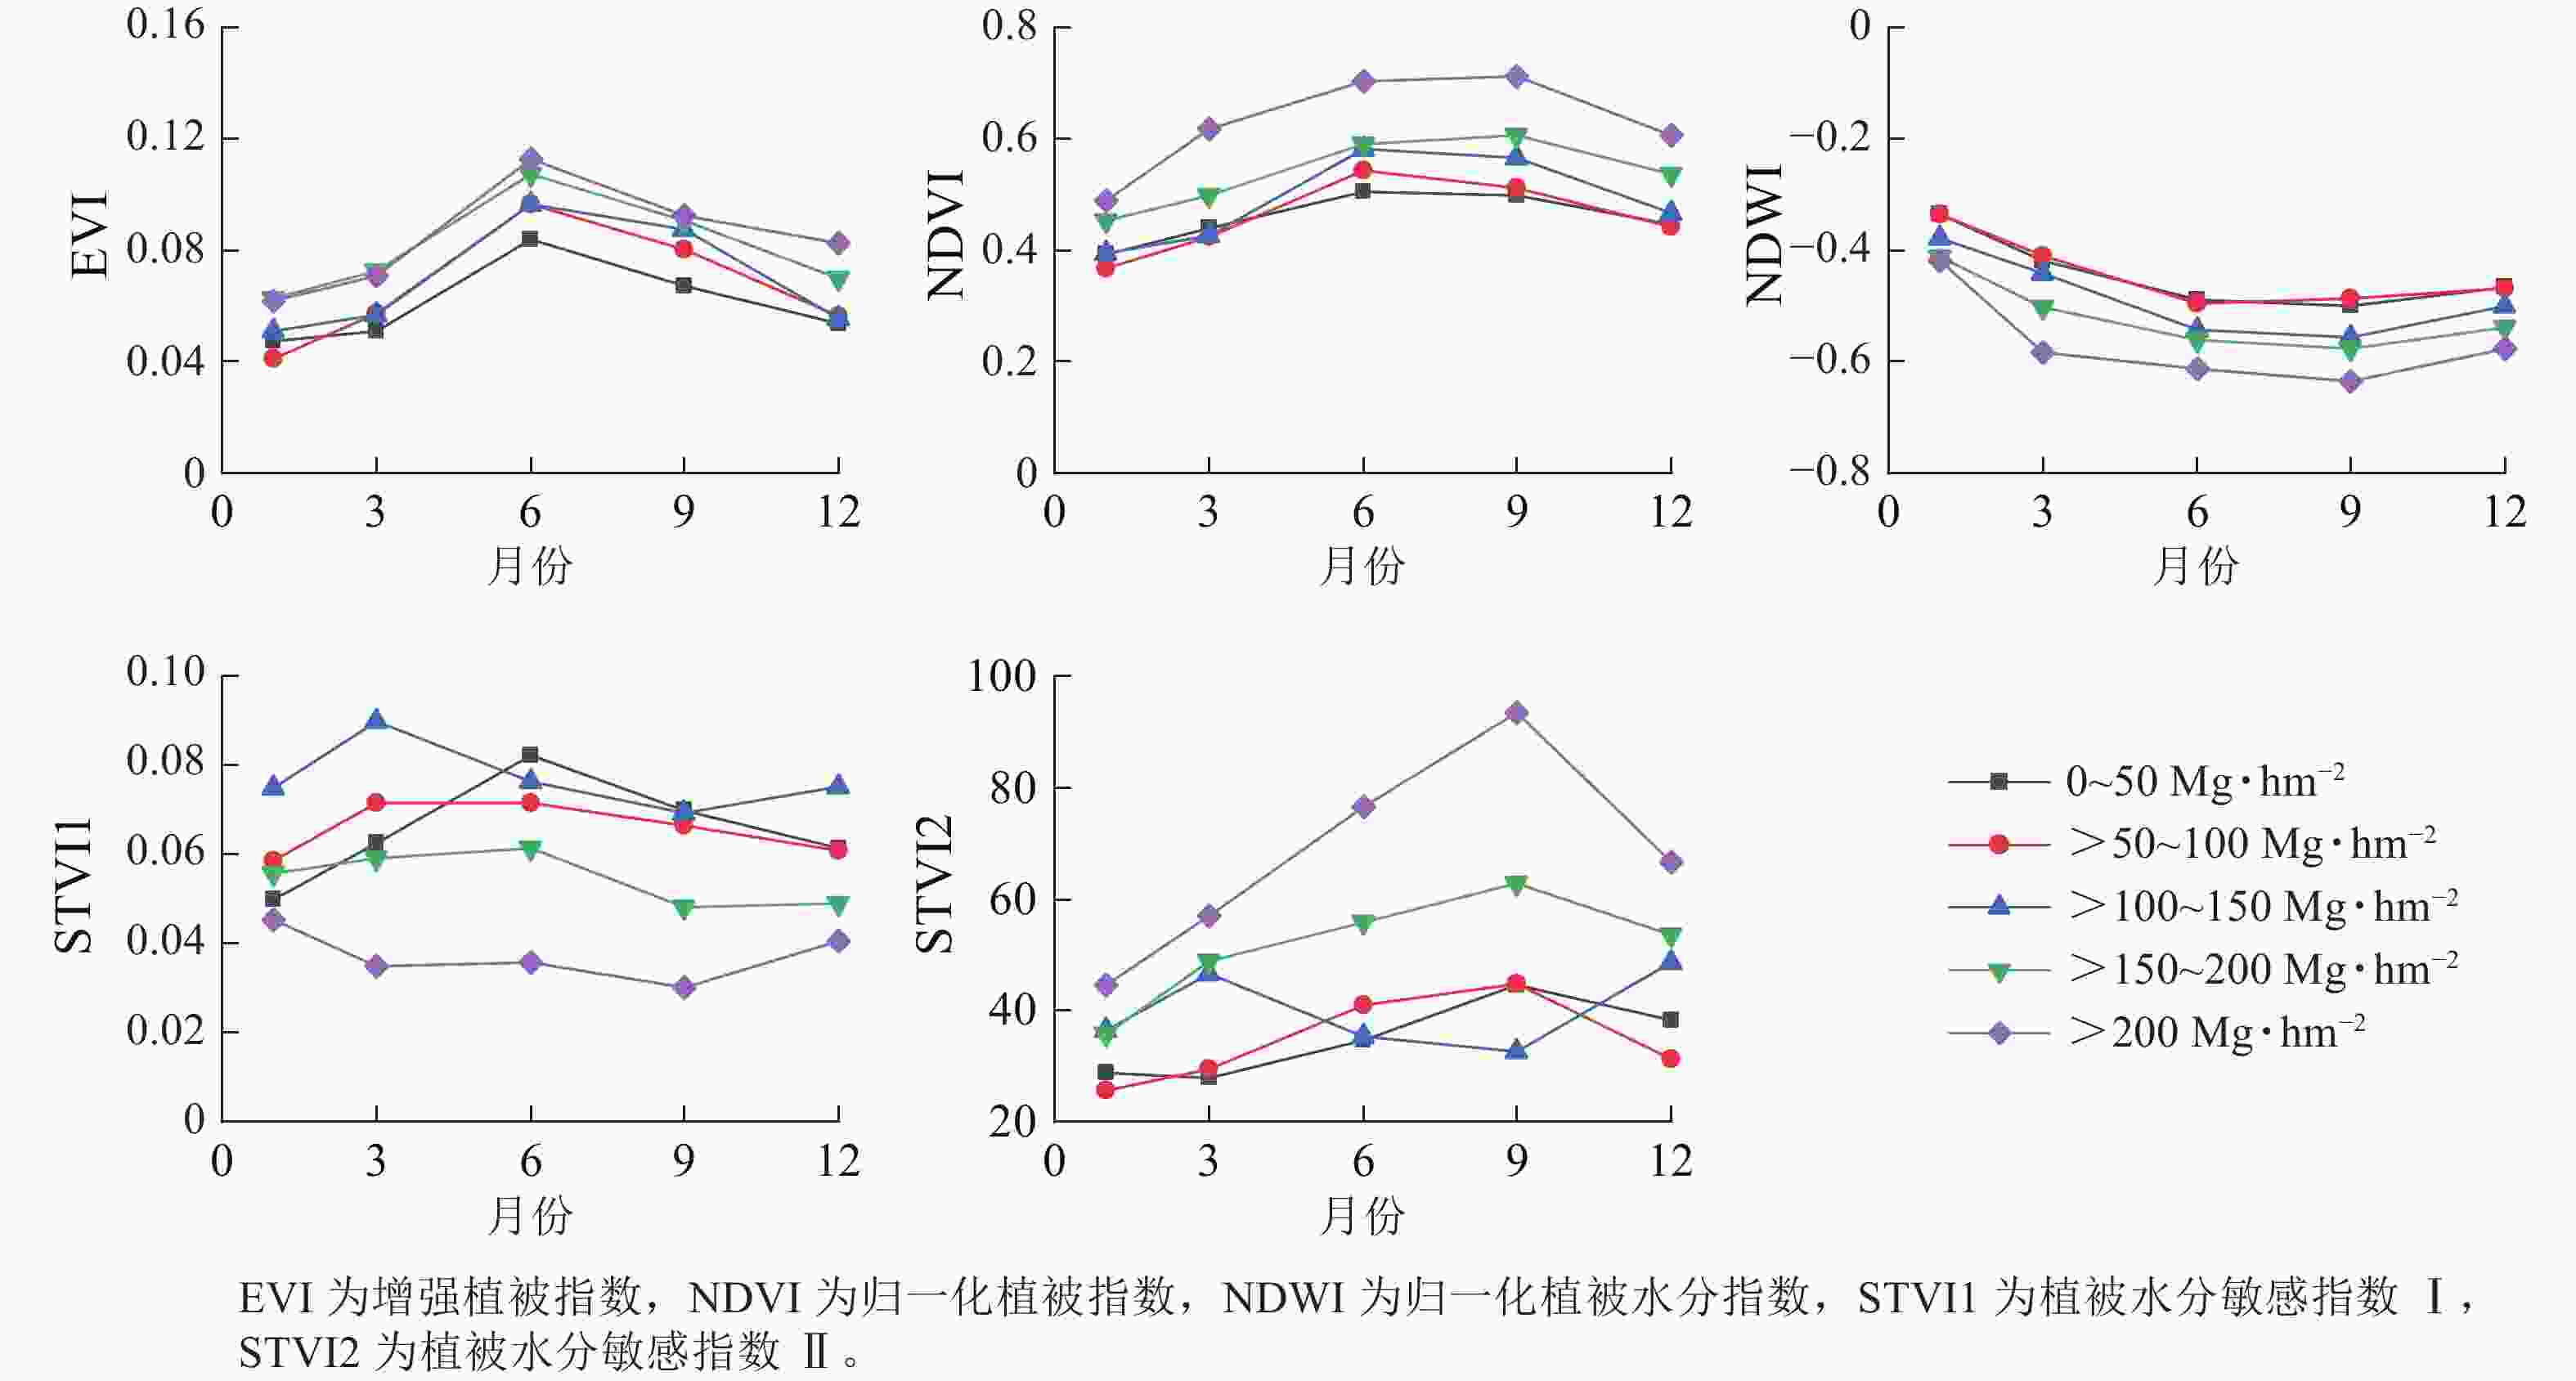
      Figure 4.  Seasonal change curves of vegetation index in different levels of above-ground biomass

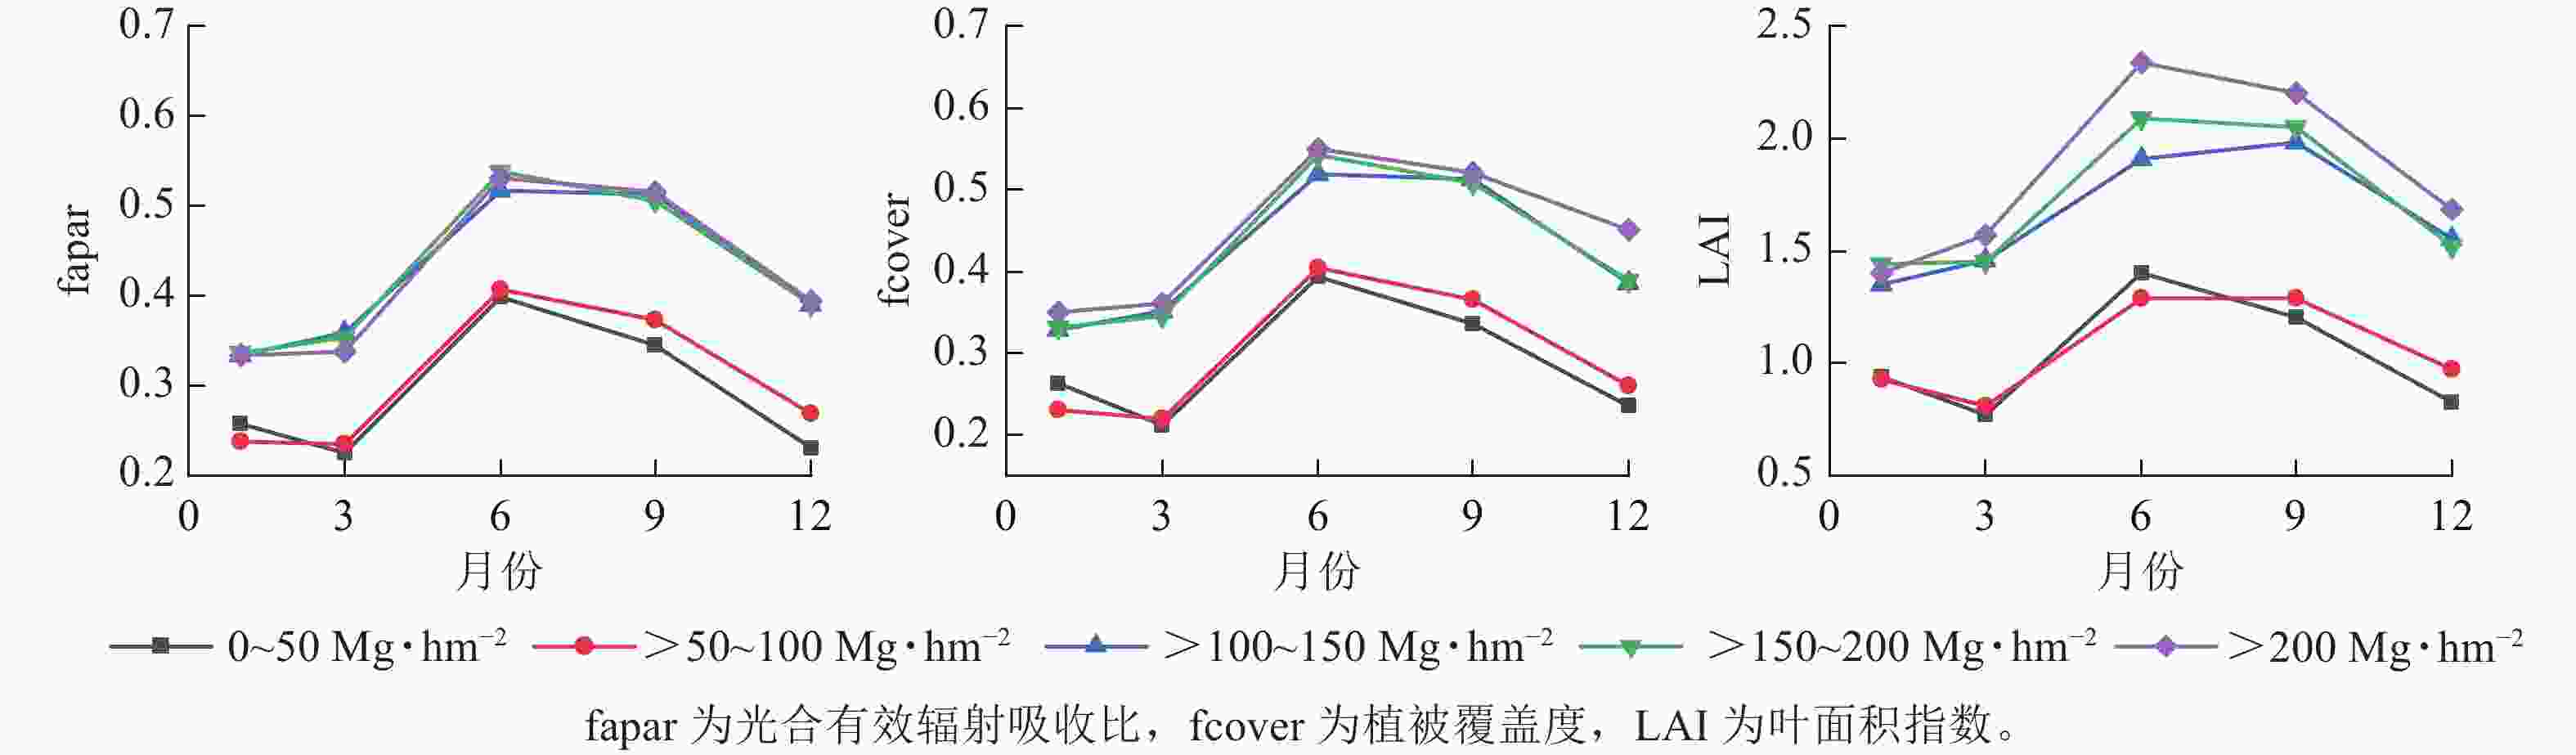
      Figure 5.  Seasonal variation of biophysical parameters in different levels of above-ground biomass

      相对于Sentinel-2的光学特征参数,Sentinel-1的后向散射系数对研究区的针阔混交林在不同季节的差异性表现不明显(图6)。其中,对较高等级的地上生物量,VH、VV和VH+VV在1和12月的值要低于3—9月,表现出旱季低雨季大的规律。但是,对于较低等级的地上生物量,这3个指标在不同季节没有明显的差异。总体而言,相对于较高等级的地上生物量,Sentinel-1的后向散射特征要比较低等级的地上生物量高。

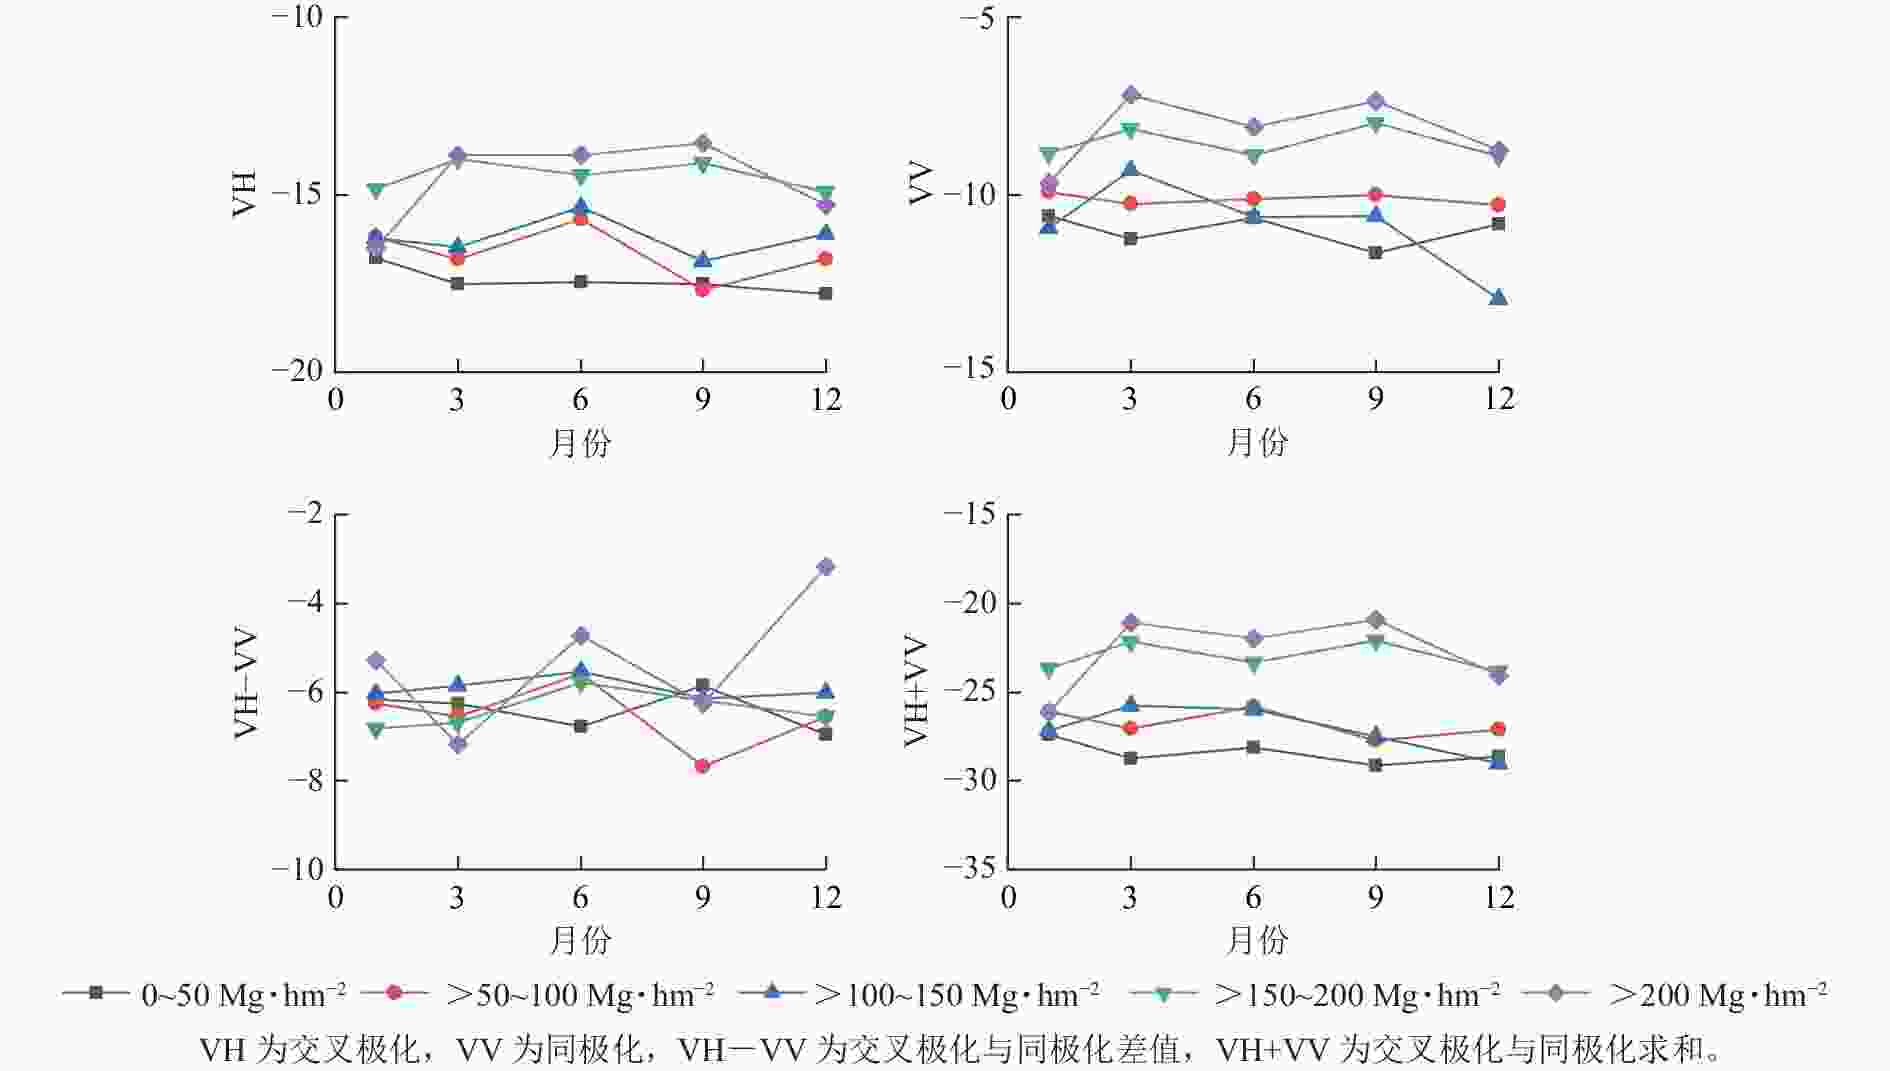
      Figure 6.  Seasonal variation of SAR characteristic parameters for different levels of above-ground biomass

    • 图7所示:基于Sentinel-2影像的模型(S2-all、S2-biophysical和S2-spectral)要优于Sentinel-1影像的模型(S1-all和S1-backscatter)。对采用不同季节Sentinel-1后向散射系数的S1-backscatter模型,地上生物量反演精度最低,R2为0.36,ERMS为52.97 Mg·hm−2。同时,对较高等级的地上生物量(>150 Mg·hm−2)同样存在较严重的低估现象。而对于S1-all模型,加入了后向散射系数相关的雷达衍生指数(VH−VV和VH+VV)后估计精度有所提高(R2=0.47,ERMS=49.11 Mg·hm−2),但仍然无法避免对较高等级地上生物量的低估现象。

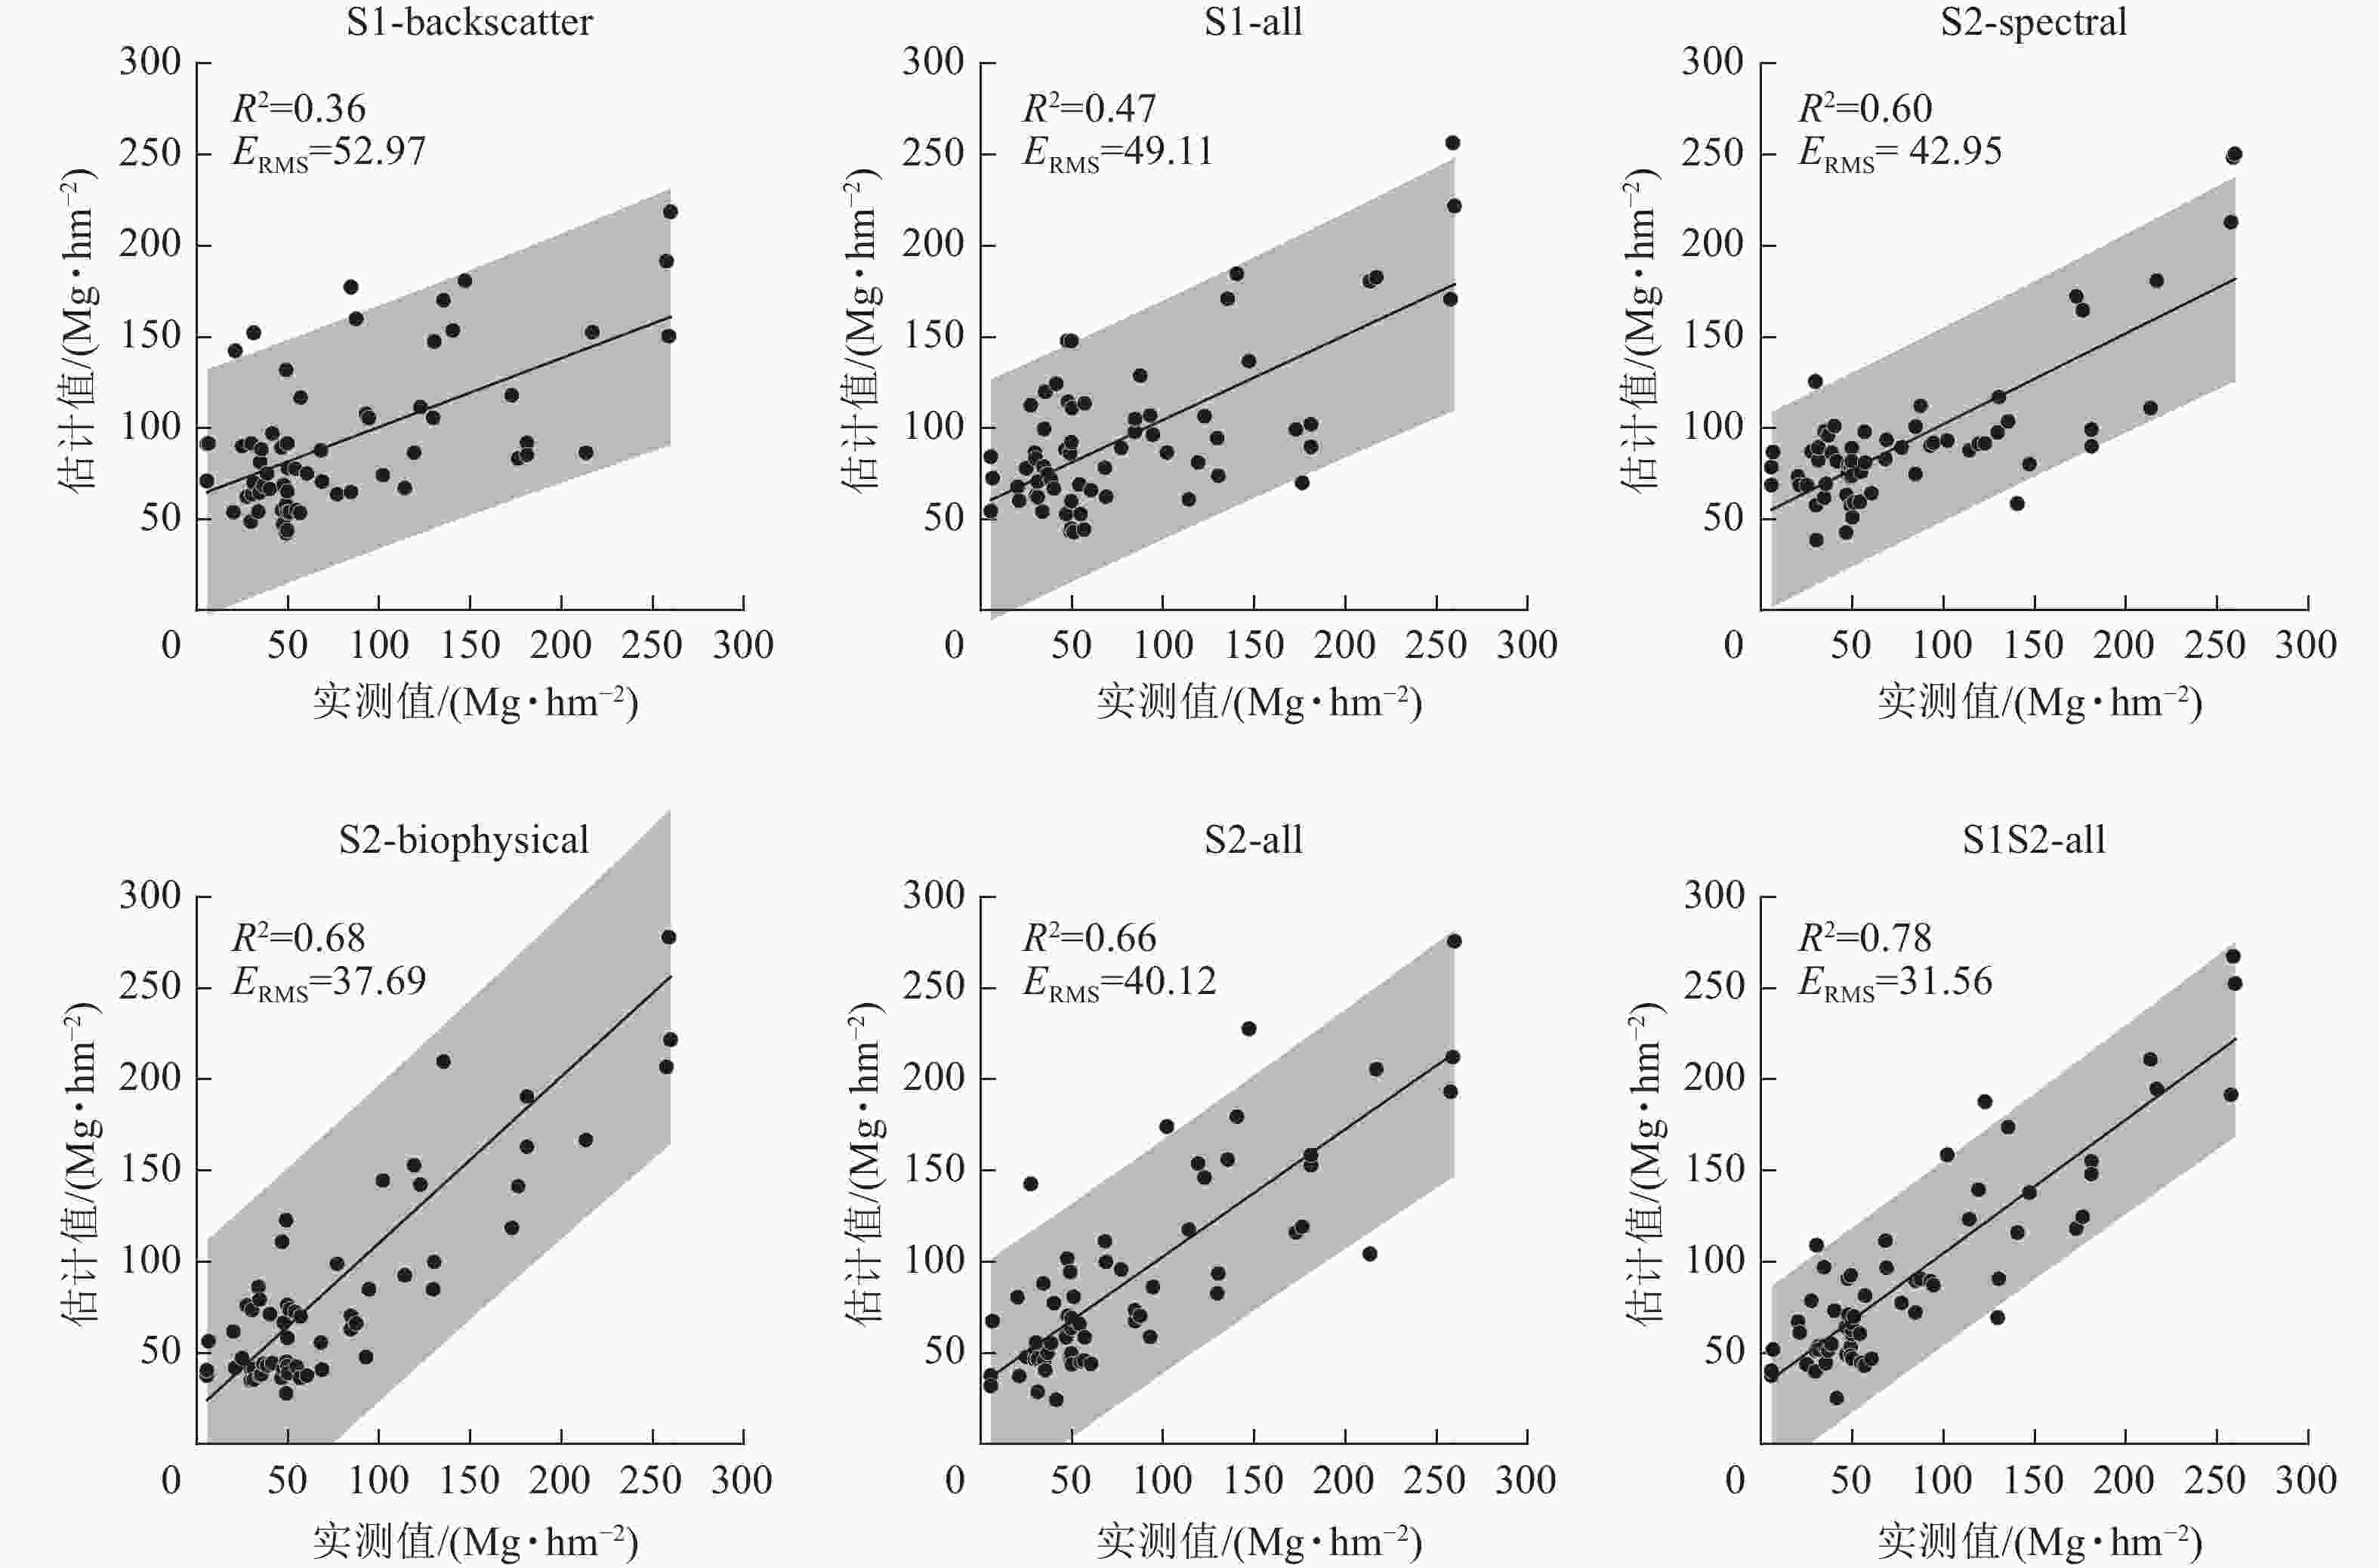
      Figure 7.  Scatter plots of measured and estimated values of above-ground biomass

      基于生物物理参数的S2-biophysical模型对地上生物量估计精度(R2=0.66,ERMS=40.12 Mg·hm−2)优于基于光谱波段的S2-spectral模型(R2=0.60,ERMS=42.95 Mg·hm−2)。并且,仅采用光谱波段的S2-spectral模型对较高等级的地上生物量(>150 Mg·hm−2)存在低估现象。S2-all模型联合光谱波段、光谱指数及其衍生的生物物理参数后,地上生物量估计精度提高了5.62 Mg·hm−2。通过联合不同季节所有的Sentinel-1和Sentinel-2特征变量所构建的模型精度最高(R2=0.78,ERMS=31.56 Mg·hm−2),相比S2-all模型,地上生物量均方根误差降低了8.56 Mg·hm−2

    • 图8所示:在S1-backscatter (图8A)的预测变量中,排前5位的变量分别为12月_VH、 6月_VH、6月_VV、1月_VH和12月_VV,采集季节都来自夏季和冬季,其中贡献度最大的是12月_VH,这一规律和S1-all (图8B)相同。在S1-backscatter和S1-all模型中,VH极化的后向散射系数比VV贡献度更大。

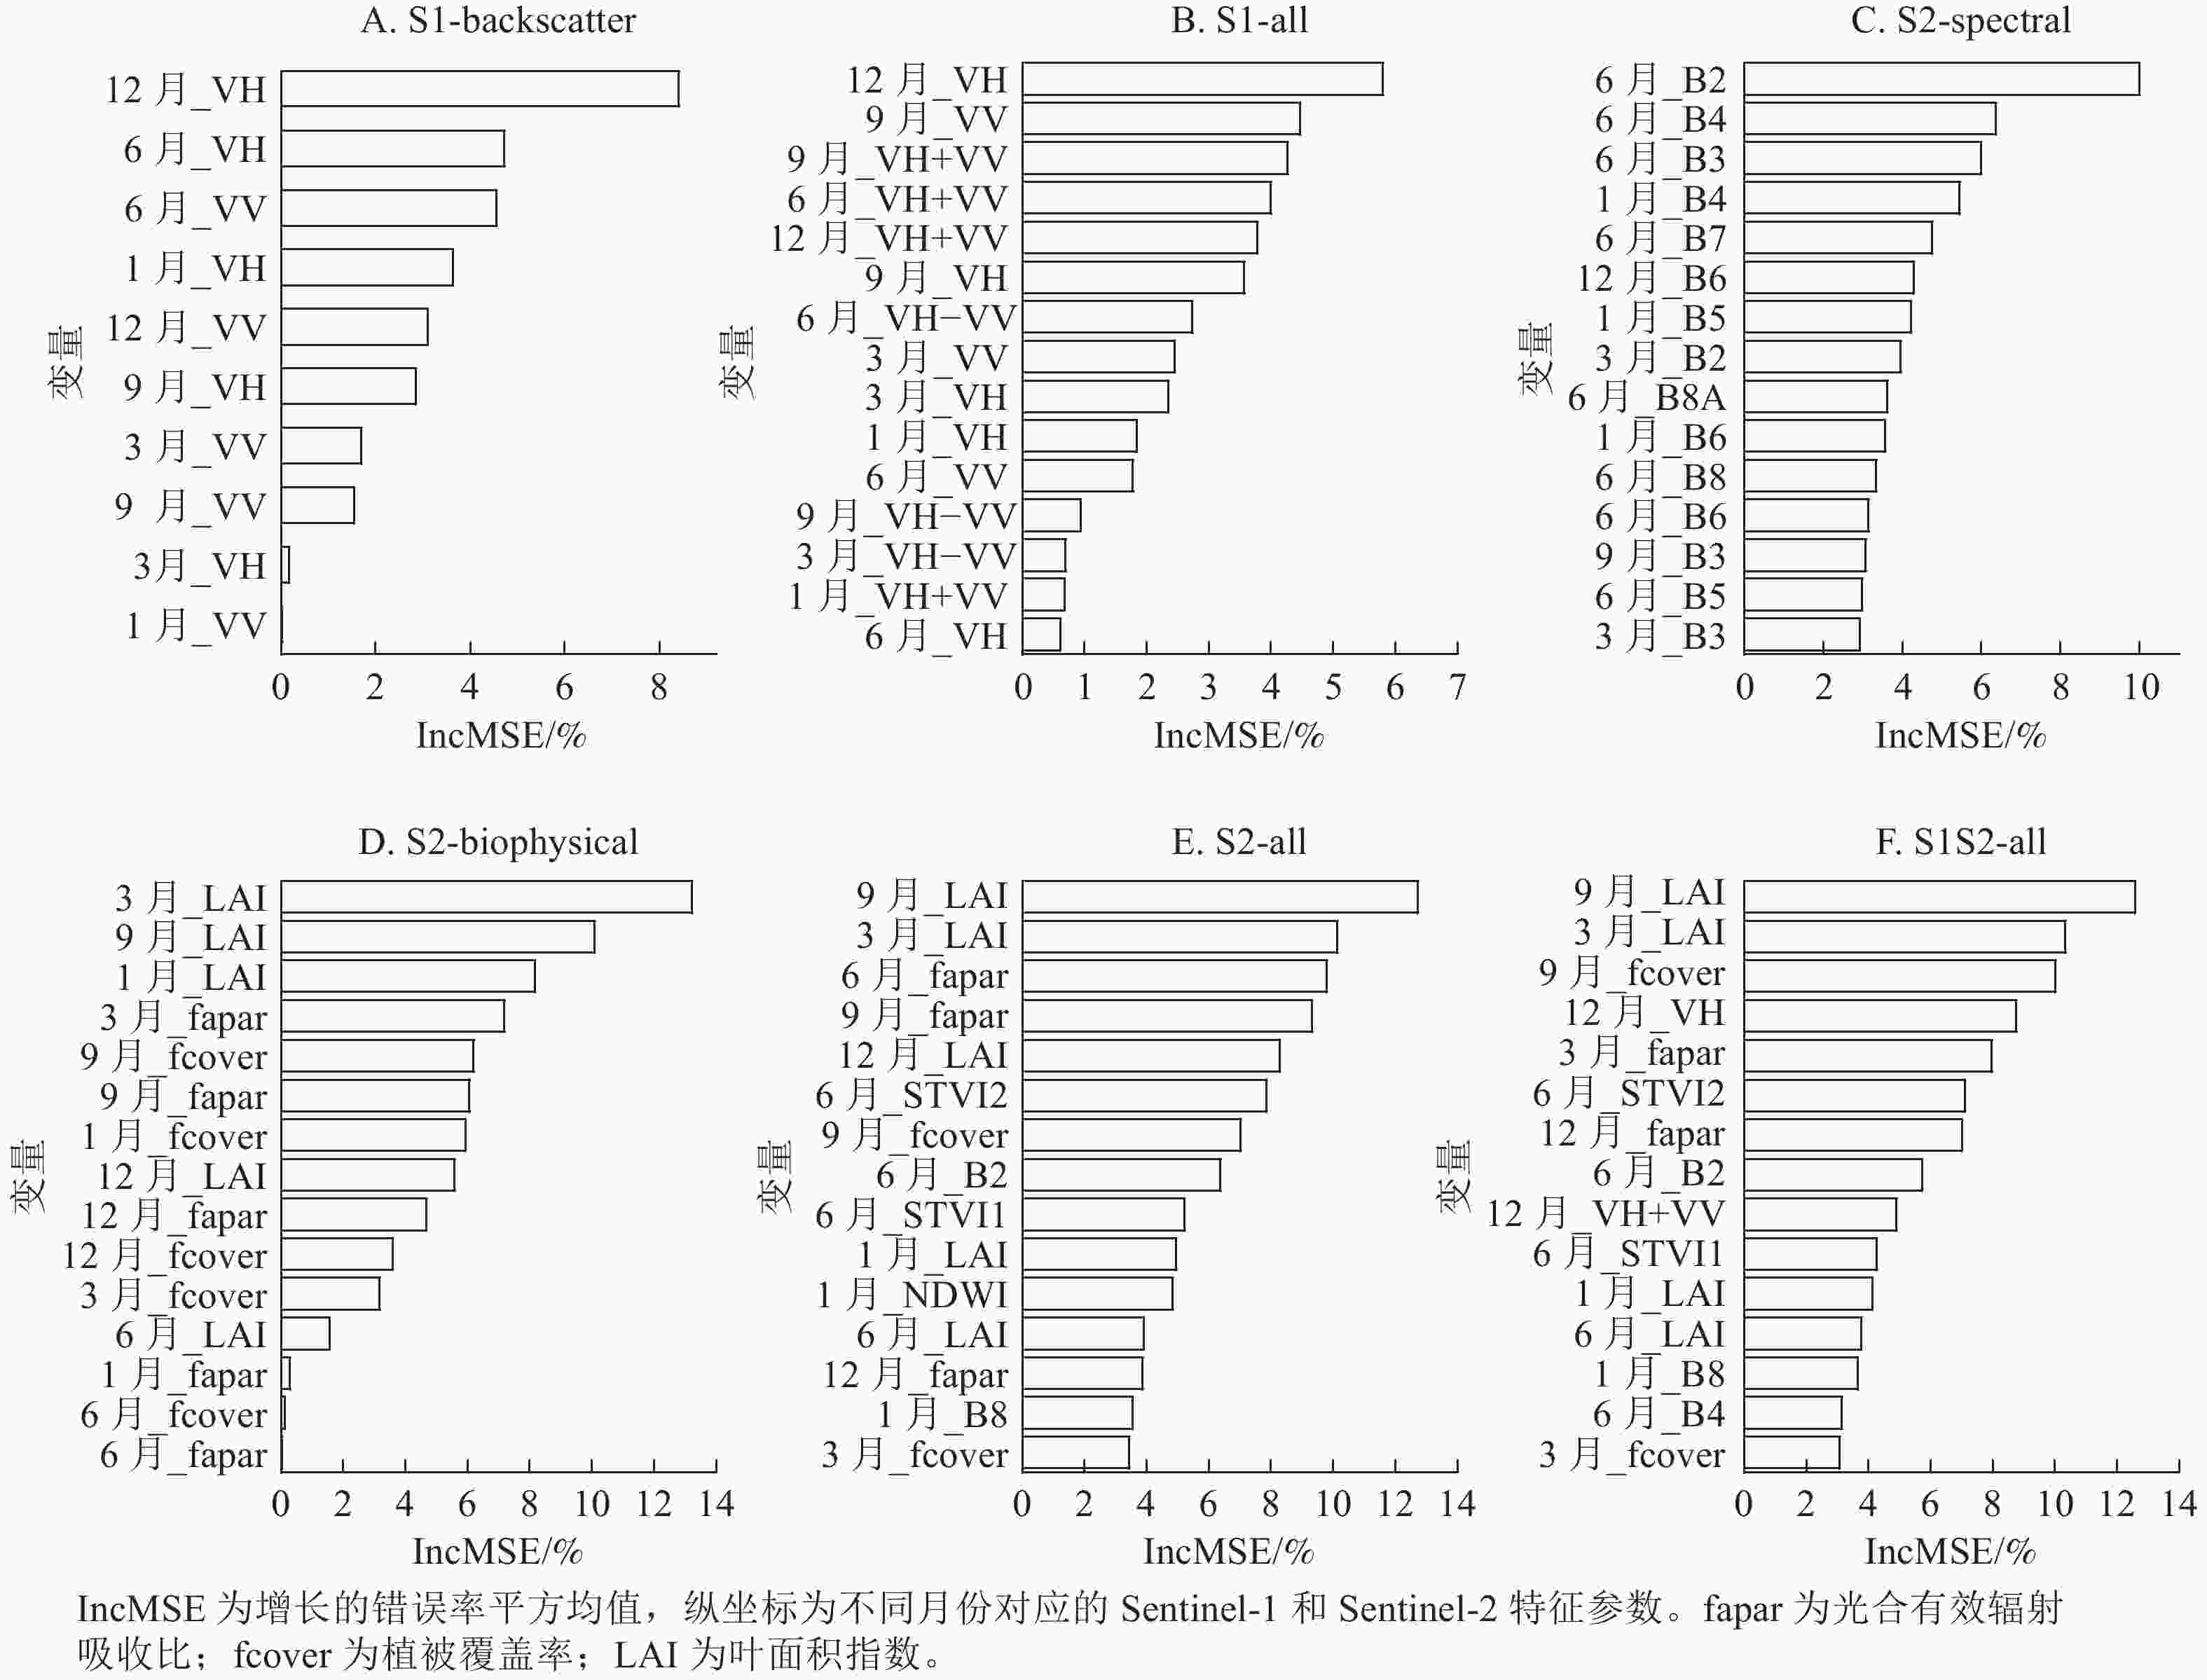
      Figure 8.  Variable importance of above-ground biomass modelling

      S2-spectral模型前15个最重要预测变量中(图8C),有12个变量来源于生长季节,再次证明了基于生长季的光学影像对常绿针阔混交林地上生物量估计的重要性。S2-biophysical模型(图8D)变量中,3个生物物理参数中LAI贡献度最大,其次是fapar和fcover。与光谱波段相比,S2-all模型(图8E)中生物物理参数LAI、fapar和STVI2对地上生物量估计贡献度较高,并且这些参数采集的影像时期大部分来源于6和9月。结合所有变量的S1S2-all (图8F)模型中,前15预测变量几乎全为Sentinel-2变量,表明在对亚热带森林地上生物量反演方面,Sentinel-2比Senttinel-1更有优越性。

    • 本研究发现:Sentinel-2比Sentinel-1更适合于亚热带太平湖生态保护区森林的地上生物量建模,这与VAFAEI等[21]和ZHAO等[22]的研究结果一致,但其他相关研究却获得了相反的结果[23]。本研究中Sentinel-1地上生物量较差的估算结果可以归纳为2个主要因素。第一个,Sentinel-1的C-波段波长较短是主要限制因素。与波长较长的雷达波段(如L和P)相比,C波段雷达穿透植被冠层的能力有限,无法获取完整的森林结构信息,因此,采用较长波长(如L和P波段)的Sentinel-1数据和Sentinel-2联合,可以提高地上生物量反演的准确性[16]。第2个潜在的因素是本研究没有考虑Sentinel-1的纹理信息。有研究表明:Sentinel-1的后向散射系数及其衍生参数(如:VH+VV或VH−VV)的纹理信息对地上生物量制图具有较大的贡献度[23]。因此,在未来的研究中,应考虑将纹理信息结合起来,以改善地上生物量估计。

      光学数据在绘制地上生物量估计方面容易存在饱和现象[16],但对本研究森林的地上生物量反演影响不明显。一方面,Sentinel-2具备较高的空间分辨率,有助于提高地上生物量的反演能力。另一方面,在本研究中,生物物理参数(fapar、fcover和LAI)、植被指数和红边谱段对地上生物量估计具有重要作用。植被指数和光谱波段在以往的研究中已经被证实其有效性,但Sentinel-2反演的生物物理参数对地上生物量建模的重要性和贡献性少有探究。在本研究中,仅使用生物物理参数(S2-biophysical,ERMS=37.69)比使用所有光谱波段(S2-spectral,ERMS= 42.95)得出的精度更高。并且,它在地上生物量估计中的表现优于所有Sentinel-1数据,证明了生物物理参数对亚热带针阔混交林地上生物量估计的优势。

      在所有的地上生物量模型中,结合Sentinel-1和Sentinel-2数据取得了最好的结果,其他相关研究也发现了类似的结论[2425]。主要由于2个系统的成像技术、数据特征和信息内容不同,两者优势互补能够有效提高地上生物量估计。在本研究中,使用年内的时间序列数据,包含不同季节进行组合,对Sentinel-1和Sentine-2的互补性有了更深层次的探索。与周蔚等[12]仅采用1个时间数据结果(ERMS=37.05 Mg·hm−2)相比,本研究结果(ERMS=31.56 Mg·hm−2)有一定程度的提高,这说明不同时间序列的Sentinel数据越多,对地上生物量建模的准确性越好。

    • 本研究显示:生物物理参数LAI、fapar和fcover的贡献度比植被指数、光谱波段、雷达极化参数及其衍生指数大。CHEN等[26]获得了类似的结果,发现LAI和地上生物量之间的相关性更高。值得注意的是,不同生物物理变量的重要性与植被组成和特征关系紧密。本研究区森林比较郁闭,LAI对地上生物量估计起到关键作用。然而,如果是稀疏的草原林地,林下灌草茂密对整个林分LAI贡献较大,相反fapar参数将起到较大的贡献作用。此外,对于仅考虑Sentinel-1的模型,VH极化和VH+VV参数具有较高的重要性,这也验证了交叉极化(HV,VH)比同极化(HH,VV)更适用于地上生物量估计。

      S2-all、S2-biophysical和S2-spectral模型的变量重要性图显示:生长季(6—9月)对研究区的地上生物量建模很重要。这主要是由于大多数植被类型在该季节有较高的植被覆盖率。同时,涉及Sentinel-1数据的模型(S1S2-all、S1-all和S1-backscatter)在旱季(10月至翌年5月)获取的图像对研究区地上生物量的建模也很重要。其他相关研究也表明:Sentinel-1数据对植被冠层、水含量、土壤水分等季节性变化产生差异[2728]。其主要原因是较短波长的X波段和C波段对地表水分比生物量更加敏感[29]。此外,Sentinel-1对树冠穿透力有限,对稀疏的森林地上生物量估计是有利的,尤其是对落叶森林。因为在旱季(落叶期),树枝裸露容易被观测。通过结合不同季节(旱季和雨季),更有利于联合光学和雷达数据的互补性,提高地上生物量建模的准确性。

    • Sentinel-2模型对地上生物量反演的精度要优于Sentinel-1,联合两者的反演精度最大。其中,生物物理参数(LAI、fapar和fcover指数)贡献度最大,植被指数(STVI1和STVI2)和后向散射系数(VH极化)贡献度次之,光谱波段最小。再次证明了生长季对亚热带森林地上生物量反演的重要性。同时,也证明了联合生长季的Sentinel-2光学影像与旱季的Sentinel-1雷达数据对提高森林地上生物量具有较大潜力。

Reference (29)

Catalog

    /

    DownLoad:  Full-Size Img  PowerPoint
    Return
    Return