Volume 41 Issue 1
Feb.  2024
Turn off MathJax
Article Contents

LU Xiang, HAN Furong, GAO Xinyu, SHU Sufang, LU Debiao, JIN Zhifeng. Meteorological drought characteristics of tea in Zhejiang based on relative humidity index[J]. Journal of Zhejiang A&F University, 2024, 41(1): 57-66. doi: 10.11833/j.issn.2095-0756.20220724
Citation: LU Xiang, HAN Furong, GAO Xinyu, SHU Sufang, LU Debiao, JIN Zhifeng. Meteorological drought characteristics of tea in Zhejiang based on relative humidity index[J]. Journal of Zhejiang A&F University, 2024, 41(1): 57-66. doi: 10.11833/j.issn.2095-0756.20220724

Meteorological drought characteristics of tea in Zhejiang based on relative humidity index

doi: 10.11833/j.issn.2095-0756.20220724
  • Received Date: 2022-11-25
  • Accepted Date: 2023-06-25
  • Rev Recd Date: 2023-06-19
  • Available Online: 2024-01-19
  • Publish Date: 2024-02-20
  •   Objective  The objective is to study the evolution law of tea meteorological drought in Zhejiang, which is important for safe production of tea.   Method  Based on the daily data (temperature, precipitation and sunshine duration) of 68 meteorological observation stations in Zhejiang Province for 50 years (1971−2020), the spatial and temporal distribution characteristics of tea meteorological drought in Zhejiang were studied by relative humidity index, orthogonal empirical function (EOF), and wavelet analysis.   Result  The intensity and frequency of tea drought in summer were higher than those in autumn in Zhejiang, higher in the west and lower in the east. The drought intensity and frequency of drought were the strongest in the central and western parts of the province, especially in Jinqu Basin, followed by northern Zhejiang, and the least in coastal areas. The proportion of tea drought stations in summer decreased year by year, while in autumn it increased first and then decreased. After 2000, there was an increase in years of extreme large-scale tea drought in the summer and autumn seasons. The first modal of EOF of tea drought intensity in summer and autumn showed the consistency of changes in the whole province. In the second modal, local coastal areas and inland areas showed an inverse phase change. The main mode time series of drought intensity in summer and autumn had oscillation periods of 2−6, 2−4, and 6−10 years respectively.   Conclusion  The frequency of tea drought during summer and autumn in Zhejiang is decreasing, but the probability of extreme droughts has increased in recent years. Special attention should be paid to the improvement of drought monitoring and warning capability in the main tea producing regions. [Ch, 8 fig. 1 tab. 26 ref.]
  • [1] WANG Xiaorong, QIU Hong, ZHANG Qixiang, WU Jiasheng, LOU Heqiang.  Physiological differences in rooting and response to drought in shoots of female and male Torreya grandis‘Merrillii’ . Journal of Zhejiang A&F University, 2024, 41(3): 1-8. doi: 10.11833/j.issn.2095-0756.20230471
    [2] FENG Rui, ZHOU Qi, WU Lingshang, ZHU Yuqiu, GAO Yanhui.  Effects of PEG 6000 simulated drought stress on physiological and chlorophyll fluorescence characteristics of Dendrobium candidum seedlings . Journal of Zhejiang A&F University, 2024, 41(1): 132-144. doi: 10.11833/j.issn.2095-0756.20230301
    [3] ZHAO Yu, LIN Lin, WANG Qun, ZHANG Guozhe, WANG Jie, SHANG Linxue, HONG Sidan, MA Qingqing, GU Cuihua.  Screening and validation of reference genes in Heimia myrtifolia in different tissues and under drought stress . Journal of Zhejiang A&F University, 2023, 40(3): 665-672. doi: 10.11833/j.issn.2095-0756.20220342
    [4] CHEN Xuebing, LIU Cong, CHENG He, JIANG Tingbo, XIA De’an, WEI Zhigang.  Genome-wide identification of ZHD gene family of Populus trichocarpa and its expression under drought stress . Journal of Zhejiang A&F University, 2022, 39(3): 465-474. doi: 10.11833/j.issn.2095-0756.20210373
    [5] ZHOU Yong, XU Tongxin, LUO Shuwen, YANG Hao, CHANG Meng, ZHUANG Jiayao.  Response of rainfall runoff to forest quality in Shicheng County, Jiangxi Province . Journal of Zhejiang A&F University, 2021, 38(3): 502-509. doi: 10.11833/j.issn.2095-0756.20200505
    [6] CHEN Wenfei, DU Changxia, JIN Peiying, HE Yani, FAN Huaifu.  Histological structure of cucumber seedlings with drought stress . Journal of Zhejiang A&F University, 2017, 34(6): 1149-1154. doi: 10.11833/j.issn.2095-0756.2017.06.024
    [7] MAO Yongcheng, LIU Lu, WANG Xiaode.  Effect of drought stress on physiological characteristics of three plants of Aceraceae . Journal of Zhejiang A&F University, 2016, 33(1): 60-64. doi: 10.11833/j.issn.2095-0756.2016.01.008
    [8] CAI Qiong, DING Guijie, WEN Xiaopeng.  Cloning of the PmPIP1 gene from Pinus massoniana and its expression with drought stress . Journal of Zhejiang A&F University, 2016, 33(2): 191-200. doi: 10.11833/j.issn.2095-0756.2016.02.002
    [9] WU Luyi, YUE Yongjie, LIU Guohou, GAO Runhong, SU Zhicheng.  Climate changes affecting regional landscape patterns at Xanadu . Journal of Zhejiang A&F University, 2016, 33(2): 232-238. doi: 10.11833/j.issn.2095-0756.2016.02.007
    [10] ZHOU Zhixiu, DUAN Wenhua, WU Haiyan, SI Zhimin.  Investigation and analysis of consumptive request for Chinese premium teas . Journal of Zhejiang A&F University, 2013, 30(3): 412-416. doi: 10.11833/j.issn.2095-0756.2013.03.018
    [11] ZENG Xiao-hong, WU Jian-rong, MA Huan-cheng.  Biochemical response of drought stressed Acacia richii seedlings inoculated with rhizobia . Journal of Zhejiang A&F University, 2008, 25(2): 181-185.
    [12] YUWan-wen, CAO Bang-hua, CAO Fu-liang.  Growth, ionic absorption and ionic distribution responses to soil drought and drought-salt stresses in two Robinia pseudoacacia clones . Journal of Zhejiang A&F University, 2007, 24(3): 290-296.
    [13] XIANG Zuo-xiang, XUGui-fang, JIANG Wen-jun.  Drought stress on physiological and biochemical processes in four spiny plant species . Journal of Zhejiang A&F University, 2007, 24(1): 7-11.
    [14]

    PU Guang-lan, YUAN Da-gang, HU Xue-hua, ZHOU Lan-ying, DENG Jia-lin, LIU Yong-hong.  Effect of soil drought stress on physiological and biochemical characteristics in three Armeniaca vulgaris cultivars . Journal of Zhejiang A&F University, 2005, 22(4): 375-379.

    [15] CAO Bang-hua, ZHANG Ming-ru, ZHAI Ming-pu, MAO Pei-li.  Growth and osmotic adjustment of Robinia pseudoacacia clones under drought stress . Journal of Zhejiang A&F University, 2005, 22(2): 161-165.
    [16] MA Li-feng, SHI Yuan-zhi, HAN Wen-yan, RUAN Jian-yun.  Mass fraction of fluorine in some tea gardens of Hunan and Zhejiang . Journal of Zhejiang A&F University, 2005, 22(1): 28-32.
    [17] WEN Guo-sheng, WANG Lin-he, ZHANG Guo-sheng.  Gas exchanges and chlorophyll fluorescence characteristics of Sabina vulgaris under drought stress . Journal of Zhejiang A&F University, 2004, 21(4): 361-365.
    [18] WEN Guo-sheng, ZHANG Guo-sheng, ZHANG Ming-ru, WANG Lin-he, YOSHIKAWA Ken.  Stomatal transpiration and cuticular transpiration of Sabina vulgaris under drought stress . Journal of Zhejiang A&F University, 2003, 20(3): 268-272.
    [19] ZHAO Qin, TONG Qi-qing, TU You-ying, LUO Yao-ping.  Effect of temperature and organic fertilizer on β-glucosidase activity and contents of alcoholic aroma in fresh tea leaves . Journal of Zhejiang A&F University, 2000, 17(1): 28-31.
    [20] CHEN Liang, ZHOU Zhi-xiu, SHU Ai-min, LIU Xiao.  Comparison of organoleptic evaluation and chemical composition among three kinds of kudingcha and tea . Journal of Zhejiang A&F University, 2000, 17(3): 298-300.
  • [1]
    YANG Yajun. Chinese Tea Cultivation[M]. Shanghai: Shanghai Scientific and Technical Press, 1986: 15 − 20.
    [2]
    JIN Zhifeng, HUANG Jingfeng, LI Bo, et al. Suitability evaluation of tea trees cultivation based on GIS in Zhejiang Province [J]. Transactions of the Chinese Society of Agricultural Engineering, 2011, 27(3): 231 − 236.
    [3]
    HU Xiaoyun, WEI Chunli, CHEN Taolue. 2022 China tea regional public brand value evaluation report [J]. China Tea, 2022, 44(5): 22 − 37.
    [4]
    ZHOU Zhixiu, DUAN Wenhua, WU Haiyan, et al. Investigation and analysis of consumptive request for Chinese premium teas [J]. Journal of Zhejiang A&F University, 2013, 30(3): 412 − 416.
    [5]
    SHEN Jinghua, HU Bo. Analysis of laws and sudden-change of drought/flood for last 534 years in Zhejiang Province [J]. Meteorological Monthly, 2005, 31(10): 76 − 79.
    [6]
    YANG Fei. Study on the Characteristics and Defensive Technologies of High Temperature and Drought Disasters on Tea Plants in Zhejiang Province During the Past 55 Years[D]. Nanjing: Nanjing University of Science and Technology, 2017.
    [7]
    HAN Dong, YANG Fei, YANG Zaiqiang, et al. Effects of high temperature stress and recovery on photosynthesis and stress tolerance of tea leaves [J]. Chinese Journal of Agrometeorology, 2016, 37(3): 297 − 306.
    [8]
    SHEN Ruihan, MA Lifeng. Damage and countermeasures of autumn drought in tea gardens [J]. China Tea, 2021, 43(12): 42 − 45.
    [9]
    YANG Fei, LI Beibei, HE Chengyu. Research progress of effects of high temperature and drought on growth of Camellia sinensis and tea quality [J]. Jiangsu Agricultural Sciences, 2017, 45(3): 10 − 13, 40.
    [10]
    HUANG Jingping, CHENG Dan, TAO Yao. Impact analysis of rare high temperature and drought on Wuyuan Green Tea in 2019 [J]. Acta Agriculturae Jiangxi, 2021, 33(2): 109 − 115.
    [11]
    LIAO Liufeng, YANG Fuyan, ZHANG Donghai, et al. Characteristics analysis of the summer drought in Guizhou under the background of climate change [J]. Mid-Low Latitude Mountain Meteorology, 2019, 43(2): 29 − 33.
    [12]
    JIN Zhifeng, HU Bo, YAN Jiazhen, et al. Agro-meteorological disaster risk evaluation of tea planting in Zhejiang Province [J]. Chinese Journal of Ecology, 2014, 33(3): 771 − 777.
    [13]
    ZHANG Xiaofang, ZHANG Bo, MA Shangqian, et al. Analysis on temporal and spatial variation of spring maize drought in dryfarming area of northern China based on crop water deficit index [J]. Chinese Journal of Agrometeorology, 2022, 43(9): 749 − 760.
    [14]
    ZENG Xiaoshan, FENG Liping, GAO Jiachen, et al. Spatial distribution and temporal variation characteristics of rice drought in southwest China in 1960−2015 [J]. Meteorological and Environmental Sciences, 2021, 44(6): 20 − 29.
    [15]
    ZHANG Qingwen, CUI Ningbo, ZHAO Lushan, et al. Seasonal drought characteristics based on relative moisture index in Yunnan Province [J]. Agricultural Research in the Arid Areas, 2020, 38(4): 278 − 284.
    [16]
    Standardization Administration of the People’s Republic of China. Grades of Meteorological Drought: GB/T 20481−2017[S]. Beijing: Standards Press of China, 2017.
    [17]
    WANG Mingtian, WANG Xiang, HUANG Wanhua, et al. Temporal and spatial distribution of seasonal drought in southwest of China based on relative moisture index [J]. Transactions of the Chinese Society of Agricultural Engineering, 2012, 28(19): 85 − 92, 295.
    [18]
    LIU Yonglin, YAN Junping, CEN Minyi. Comprehensive evaluation of precipitation heterogeneity in China [J]. Acta Geographica Sinica, 2015, 70(3): 392 − 406.
    [19]
    WEI Fengying. Climatological Statistical Diagnosis and Prediction Technology[M]. Beijing: China Meteorological Press, 2007.
    [20]
    JIA Yue, CUI Ningbo, WEI Xinping, et al. Applicability evaluation of different algorithms for reference crop evapotranspiration in Yangtze River Basin based on inverse distance weighted method [J]. Transactions of the Chinese Society of Agricultural Engineering, 2016, 32(6): 130 − 138.
    [21]
    ZENG Lihong, SONG Kaishan, ZHANG Bai, et al. Spatiotemporal variability of reference evapotranspiration over the northeast region of China in the last 60 years [J]. Advances in Water Science, 2010, 21(2): 194 − 200.
    [22]
    PEI Lin, YAN Zhongwei, YANG Hui. Multidecadal variability of dry/wet patterns in eastern China and their relationship with the Pacific Decadal Oscillation in the last 413 years [J]. Chinese Science Bulletin, 2015, 60(1): 97 − 108.
    [23]
    TORRENCE C, COMPO G P. A practical guide to wavelet analysis [J]. Bulletin of the American Meteorological Society, 1998, 79(1): 61 − 78.
    [24]
    HARALD K J, KROGATAD P. Wavelet-based method for burst detection [J]. Fluid Dynamics Research, 2001, 28: 223 − 236.
    [25]
    NORTH G R, BELL T L, CAHALAN R F, et al. Sampling errors in the estimation of empirical orthogonal functions [J]. Monthly Weather Review, 1982, 110(7): 699 − 706.
    [26]
    DONG Hao, DING Lixia. A comparison of different radiation use efficiency models in gross primary production accuracy under drought [J]. Journal of Zhejiang A&F University, 2021, 38(6): 1109 − 1116.
  • 加载中
通讯作者: 陈斌, bchen63@163.com
  • 1. 

    沈阳化工大学材料科学与工程学院 沈阳 110142

  1. 本站搜索
  2. 百度学术搜索
  3. 万方数据库搜索
  4. CNKI搜索

Figures(8)  / Tables(1)

Article views(251) PDF downloads(30) Cited by()

Related
Proportional views

Meteorological drought characteristics of tea in Zhejiang based on relative humidity index

doi: 10.11833/j.issn.2095-0756.20220724

Abstract:   Objective  The objective is to study the evolution law of tea meteorological drought in Zhejiang, which is important for safe production of tea.   Method  Based on the daily data (temperature, precipitation and sunshine duration) of 68 meteorological observation stations in Zhejiang Province for 50 years (1971−2020), the spatial and temporal distribution characteristics of tea meteorological drought in Zhejiang were studied by relative humidity index, orthogonal empirical function (EOF), and wavelet analysis.   Result  The intensity and frequency of tea drought in summer were higher than those in autumn in Zhejiang, higher in the west and lower in the east. The drought intensity and frequency of drought were the strongest in the central and western parts of the province, especially in Jinqu Basin, followed by northern Zhejiang, and the least in coastal areas. The proportion of tea drought stations in summer decreased year by year, while in autumn it increased first and then decreased. After 2000, there was an increase in years of extreme large-scale tea drought in the summer and autumn seasons. The first modal of EOF of tea drought intensity in summer and autumn showed the consistency of changes in the whole province. In the second modal, local coastal areas and inland areas showed an inverse phase change. The main mode time series of drought intensity in summer and autumn had oscillation periods of 2−6, 2−4, and 6−10 years respectively.   Conclusion  The frequency of tea drought during summer and autumn in Zhejiang is decreasing, but the probability of extreme droughts has increased in recent years. Special attention should be paid to the improvement of drought monitoring and warning capability in the main tea producing regions. [Ch, 8 fig. 1 tab. 26 ref.]

LU Xiang, HAN Furong, GAO Xinyu, SHU Sufang, LU Debiao, JIN Zhifeng. Meteorological drought characteristics of tea in Zhejiang based on relative humidity index[J]. Journal of Zhejiang A&F University, 2024, 41(1): 57-66. doi: 10.11833/j.issn.2095-0756.20220724
Citation: LU Xiang, HAN Furong, GAO Xinyu, SHU Sufang, LU Debiao, JIN Zhifeng. Meteorological drought characteristics of tea in Zhejiang based on relative humidity index[J]. Journal of Zhejiang A&F University, 2024, 41(1): 57-66. doi: 10.11833/j.issn.2095-0756.20220724
  • Camellia sinensis作为一种经济价值较高的作物,广泛分布于浙、闽、皖、鄂、湘、云、贵、川等省。浙江省位于中国四大茶区之一的江南茶区,地处亚热带季风气候区,境内以盆地、丘陵地貌为主,气候、地形、土壤条件适合茶树种植[12],杭州、湖州等是全国知名的茶叶产地,西湖龙井、安吉白茶等是享誉世界的知名品牌[3]。近年来,随着人民生活水平的提高,对于茶叶,特别是名优茶的需求逐年增加[4]。2020年,浙江省茶叶种植面积达20.5万hm2,产量19.1万t,茶叶产值238.6亿元。

    在全球变暖的大背景下,极端气候事件发生的概率增加,浙江茶叶产区虽然降水丰沛,但在夏秋两季仍易遭受干旱[5],特别是近年以来,极端干旱事件频发,给全省的茶叶生产造成了巨大的损失。如2019年9—11月,安吉县发生严重干旱,茶树受灾严重,受灾面积达1.13万hm2。茶树干旱灾害主要分为伏天(7—8月)高温干旱和秋季(9—11月)干旱。出梅后,整个浙江地区受副热带高压控制,形成高温、少雨的伏旱天气。此时茶树易发生旱害,轻则叶片凋零、生长迟缓,重则叶片枯萎、植株枯死[67]。进入秋季,全省降水减少,易出现干旱。当气温下降时,茶树生长速度减缓。发生干旱后茶树根系水分吸收不足,体内平衡破坏,导致枝梢生长停滞,对来年春茶的产量和品质产生一定的影响[8]。因此,开展茶叶气象干旱灾害的研究,有助于提高浙江对茶叶气象干旱灾害的防御能力。

    国内外的学者开展了一些针对茶叶夏秋两季气象干旱灾害的研究,主要有夏季的高温干旱对茶叶生长品质的影响研究[9],典型气象干旱过程对茶叶生长和产量的影响[10]以及高温热旱害的气候变化特征[11]等。金志凤等[12]通过研究茶叶气象干旱灾害风险,确定了浙江省发生夏季高温干旱的高风险地区。但针对茶叶生产气象干旱变化规律特征分析的研究相对较少。因此,本研究结合浙江茶叶生产现状和实际干旱灾害个例,根据张晓芳等[13]通过实际蒸散率研究作物干旱的经验,运用相对湿润指数分析浙江省夏季和秋季茶叶干旱的时间变化规律和空间分布特征,为浙江省茶叶生产优化布局提供科学依据。

    • 采用1971—2020年浙江省68个代表性国家气象站逐日数据,包括气温、降水量、相对湿度、日照时数、水汽压等。茶园面积、茶叶产量和茶叶产值等农业统计数据来自2021年《浙江统计年鉴》。

      浙江省降水存在明显的季节性,区域分布不均匀,导致茶叶生产在夏季出梅后和秋季易遭受旱害的侵袭,影响茶树的正常生长和夏秋茶叶产量,灾情严重的甚至危害第2年春茶的产量和品质。为此,选择对茶叶生产影响最主要的2个时间段:夏季出梅后和秋季,具体时间为夏季干旱选取出梅后(浙江省平均出梅日期为7月10日)至8月31日,秋季选取9月1日至11月30日。

    • 一些学者的研究[1415]表明:相对湿润指数在月、季等时间尺度上表征农作物的气象干旱具有较好的适用性,因此,采用相对湿润指数研究浙江夏秋季节的茶叶气象干旱特征。

      式(1)中:$I_{\mathrm{M}} $为相对湿润指数,P为作物某一生育阶段的降水量,E为实际蒸散量。根据联合国粮农组织推荐,E的计算公式为:

      式(2)中:Kc为作物系数,采用联合国粮农组织推荐的茶树成熟期的作物系数Kcmid=1.15;E0为参考作物蒸散量,采用联合国粮农组织推荐Penman-Monteith方法计算,此方法中定义作物的蒸散量为一种假象参照作物冠层的蒸散速率。

      式(3)中:Rn为地表净辐射(MJ·m−1·d−1),G为土壤热通量(MJ·m−2·d−1),Tmean为日平均气温(℃),u2为2 m高处风速(m·s−1),es为饱和水汽压(kPa),ea为实际水汽压(kPa),Δ为饱和水汽压曲线斜率(kPa·℃−1),γ为干湿表常数(kPa·℃−1)。

      参考GB/T 20481—2017《气象干旱等级》[16]中提出的相对湿润指数气象干旱等级划分法和王明田等[17]、张青雯等[15]的研究,本研究在季尺度上将相对湿润指数干旱等级划分为5级(表1)。

      等级类型相对湿润指数(IM)等级类型相对湿润指数(IM)
      1 无旱 −0.30<IM 4 重旱 −0.80<IM≤−0.65
      2 轻旱 −0.50<IM≤−0.30 5 特旱 IM≤−0.80
      3 中旱 −0.65<IM≤−0.50

      Table 1.  Drought classification base on relative humidity

    • 干旱强度(H)用来表征某一地区干旱的严重程度,利用曾晓珊等[14]的方法计算浙江省各地相对湿润指数多年平均值代表该站点的平均干旱强度。指数越小,表示干旱程度越严重。

      式(4)中:n为统计年数,IM为历年相对湿润指数,当IM≥0时,该站点的指数数值按0处理。

    • 出现干旱的年数与统计总年数之比:F=N/n×100%,其中:N为出现干旱的年数,n为统计总年数。根据刘永林等[18]的结果,把干旱发生频率分为以下5个等级(下限排除法):极少发生(0~20%)、较少发生(20%~40%)、经常发生(40%~60%)、频繁发生(60%~80%)、极频繁发生(80%~100%)。干旱站次比是指某一区域内发生干旱的站点数占全部站点数的百分比,主要用于评价干旱影响范围的大小及严重程度。

    • y表示序列长度为n的气候要素,t表示y所对应的时间。一元线性回归方程:

      式(5)中:a为回归常数,b为回归系数,ab用最小二乘法进行估计,回归系数b的符号表示气候变量y的趋势倾向,即当b>0,说明随时间t的增加y呈上升趋势,b<0时,说明随时间t的增加y呈下降趋势,通常将b的10倍称为气候要素的气候倾向率[19]

    • 根据贾悦等[20]和曾丽红等[21]的研究结果,反距离权重法在空间插值中能够对缺测的数据进行有效的填补,尤其是对蒸散量及其相关气象变量空间分布的插值具有较好的计算效果,因此,采用该插值方法对浙江省夏季和秋季的茶叶相对湿润指数的空间分布进行空间插值模拟。

    • 通常情况下经验正交函数第一模态表征原始序列的主要空间分布特征,第二模态代表剩余变率的主要分布特征[22]。EOF分解的详细计算过程根据《现代气候统计诊断与预测技术》[19],首先计算得浙江省的相对湿润指数场,然后将指数场分解为空间函数和时间函数的乘积之和:X=VT,其中VT分别为相对湿润指数场EOF分解后的空间模态和时间系数,具有正交关系。

    • 小波分析是一种具有时间—频率多分辨功能的统计学方法,其理论广泛应用于气象领域的周期分析,优点是可以分辨时间序列中隐藏的结构特性信息,充分反映所研究时间序列中不同时间尺度上的发展规律。常用的小波分析方法有Morlet小波、交叉小波和墨西哥小波等[2324]。本研究运用Morlet小波分析对不同尺度气象干旱指数的变化趋势和变化周期进行分析。

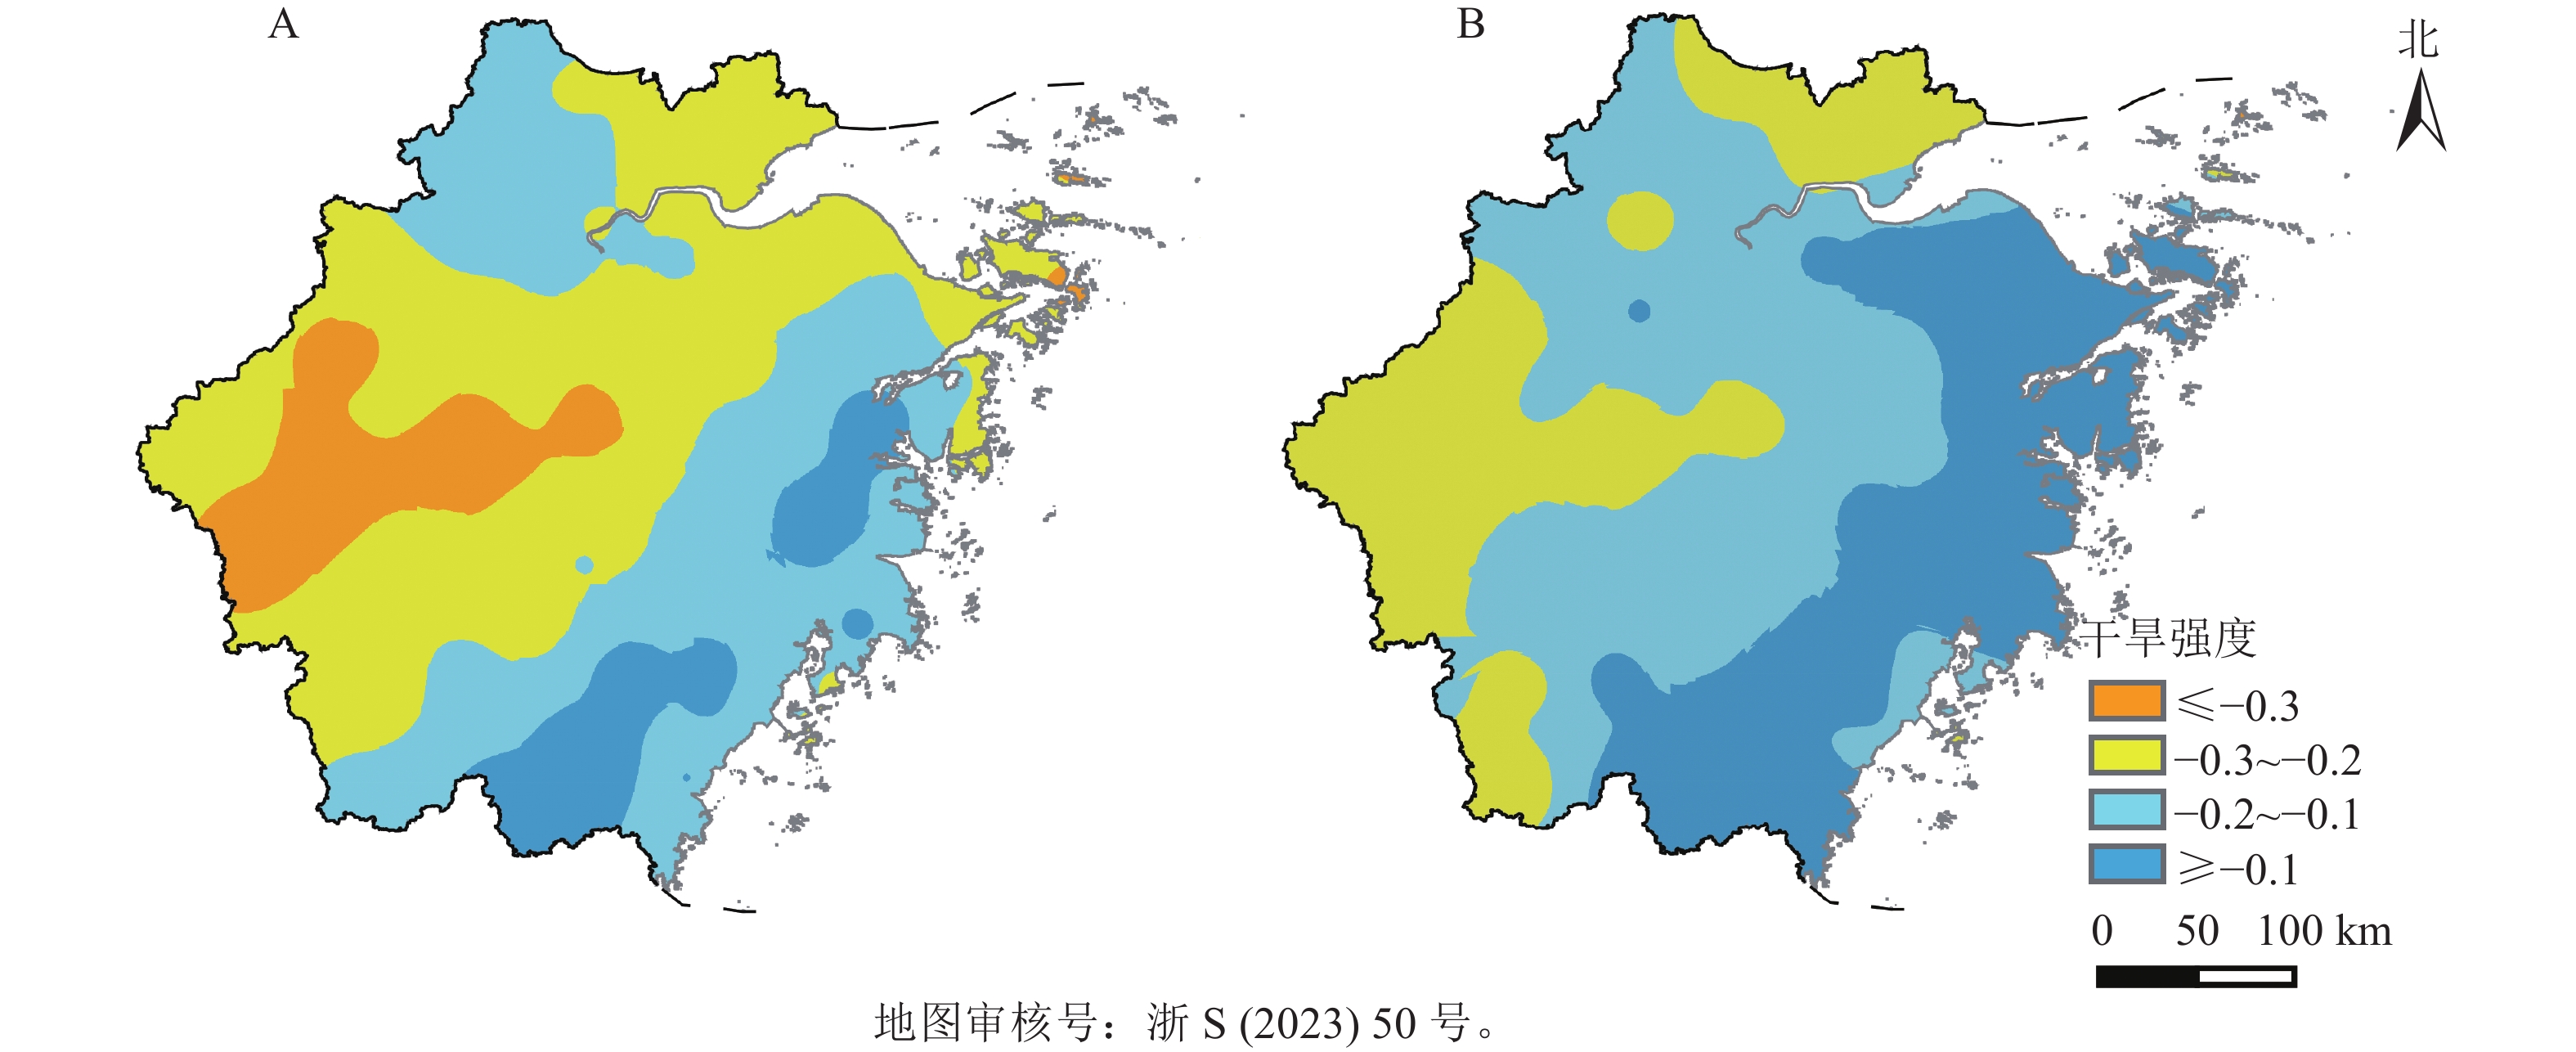
    • 根据浙江省各站点的相对湿润指数计算得夏季和秋季的历年平均茶叶气象干旱强度(图1)。夏季茶树生长旺盛,需水量大,对干旱更加敏感。由图1A可知:浙江省夏季茶叶干旱主要出现在浙中南地区,特别是金衢盆地,大部分区域相对湿润指数小于−0.3,干旱强度较强;沿海地区和浙西北山区相对湿润指数大于−0.2,干旱强度低。根据图1B,秋季茶叶干旱强度明显小于夏季,干旱主要出现在浙北和浙中局部地区,相对湿润指数达−0.3~−0.2;其他大部分地区干旱强度偏弱,其中宁波、台州和温州等沿海地区相对湿润指数大于−0.1,表明这些区域秋季基本无明显干旱发生。可知浙中地区在夏季和秋季降水相对偏少,蒸散量大,干旱强度较高,对当地茶叶生产影响较大。

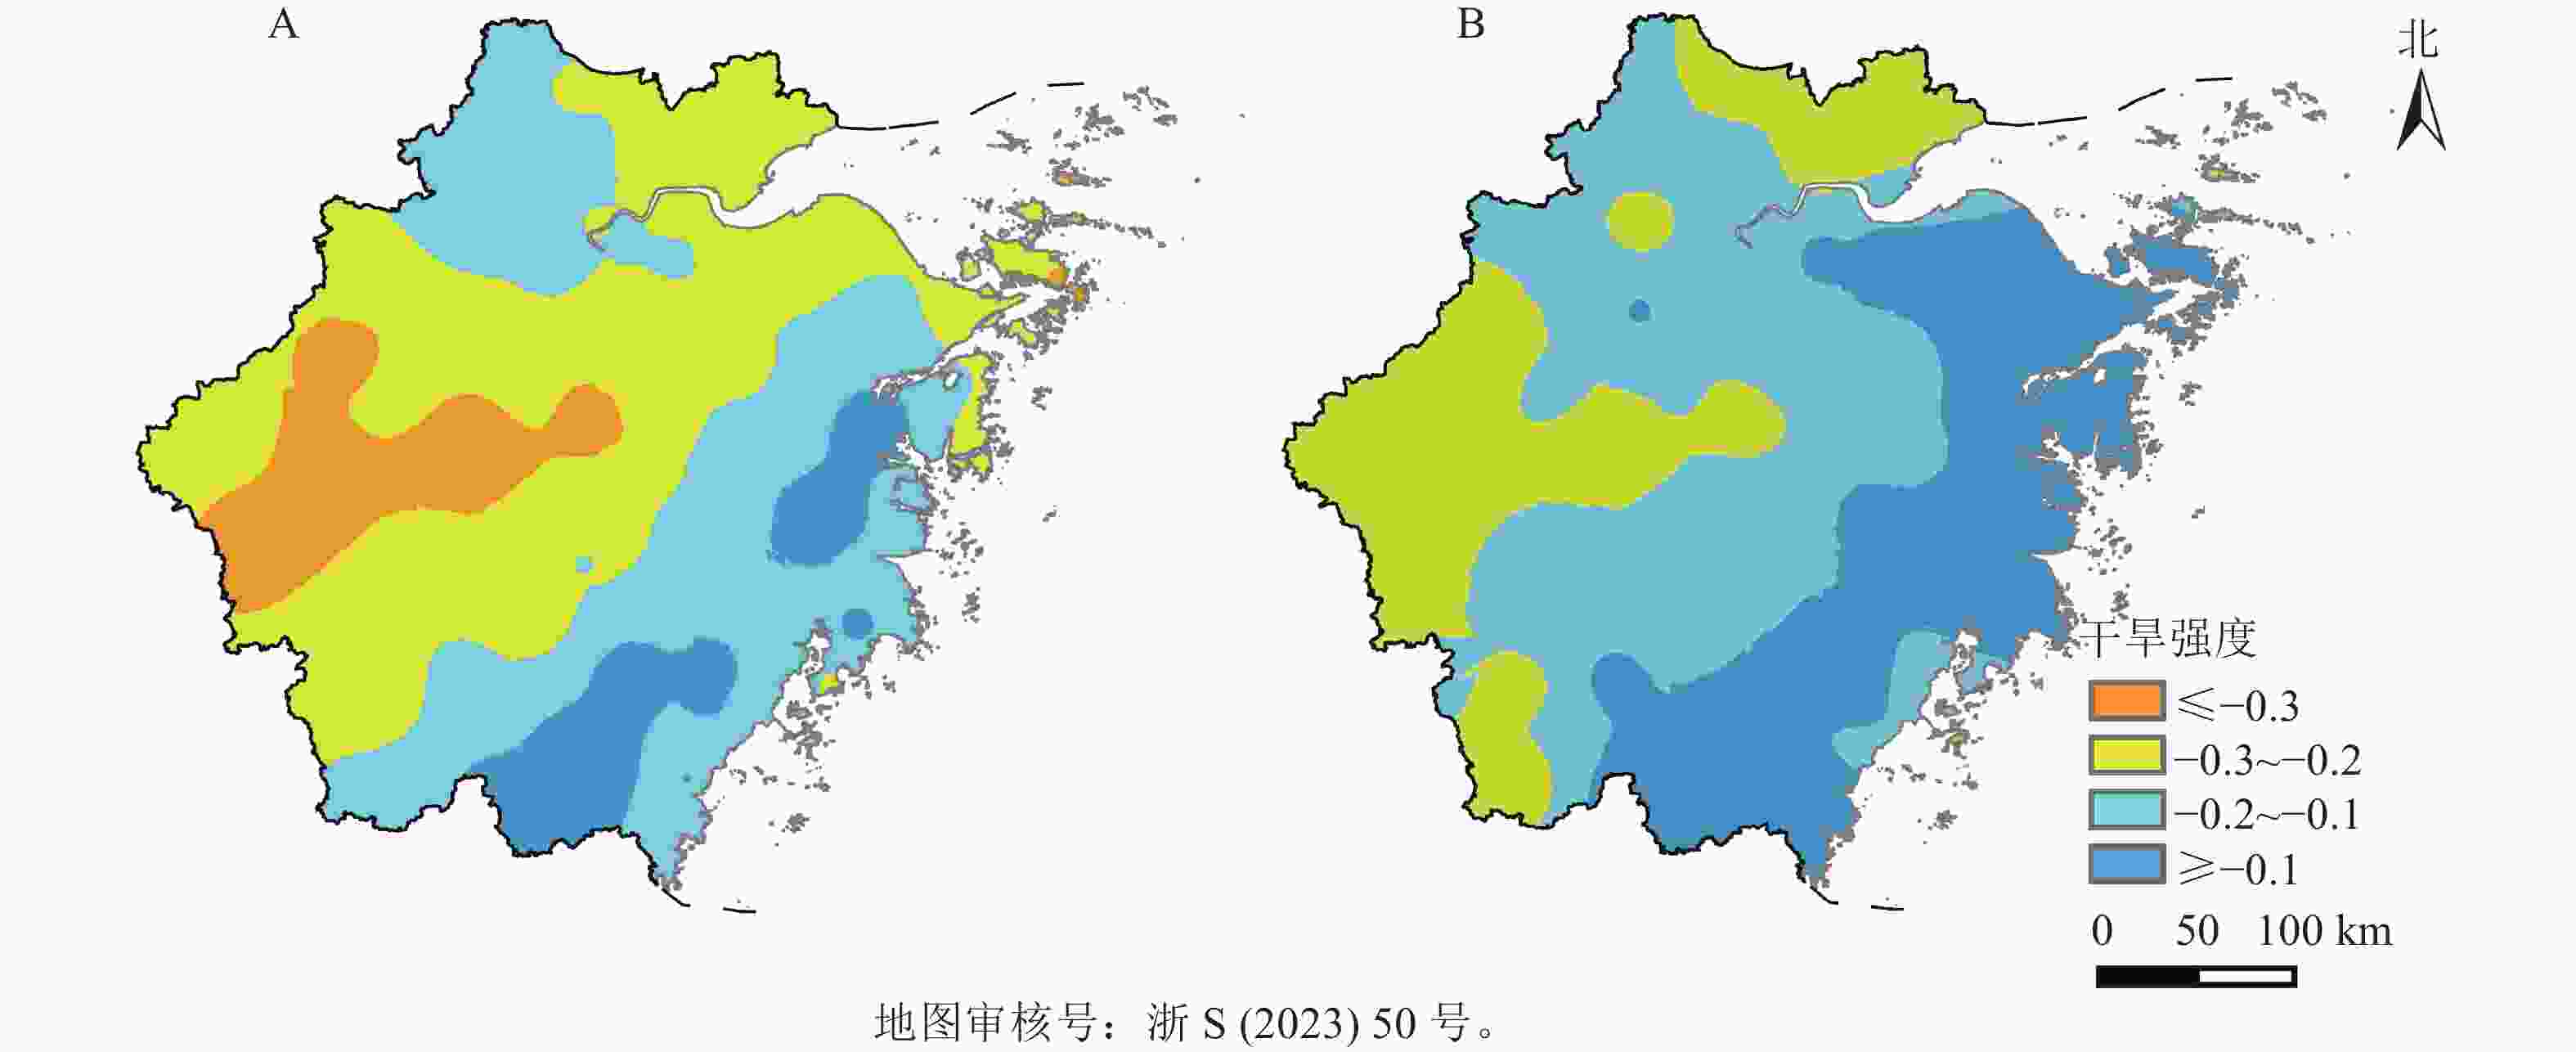
      Figure 1.  Spatial distribution of drought intensity of tea in summer (A) and in autumn (B) in Zhejiang from 1971 to 2020

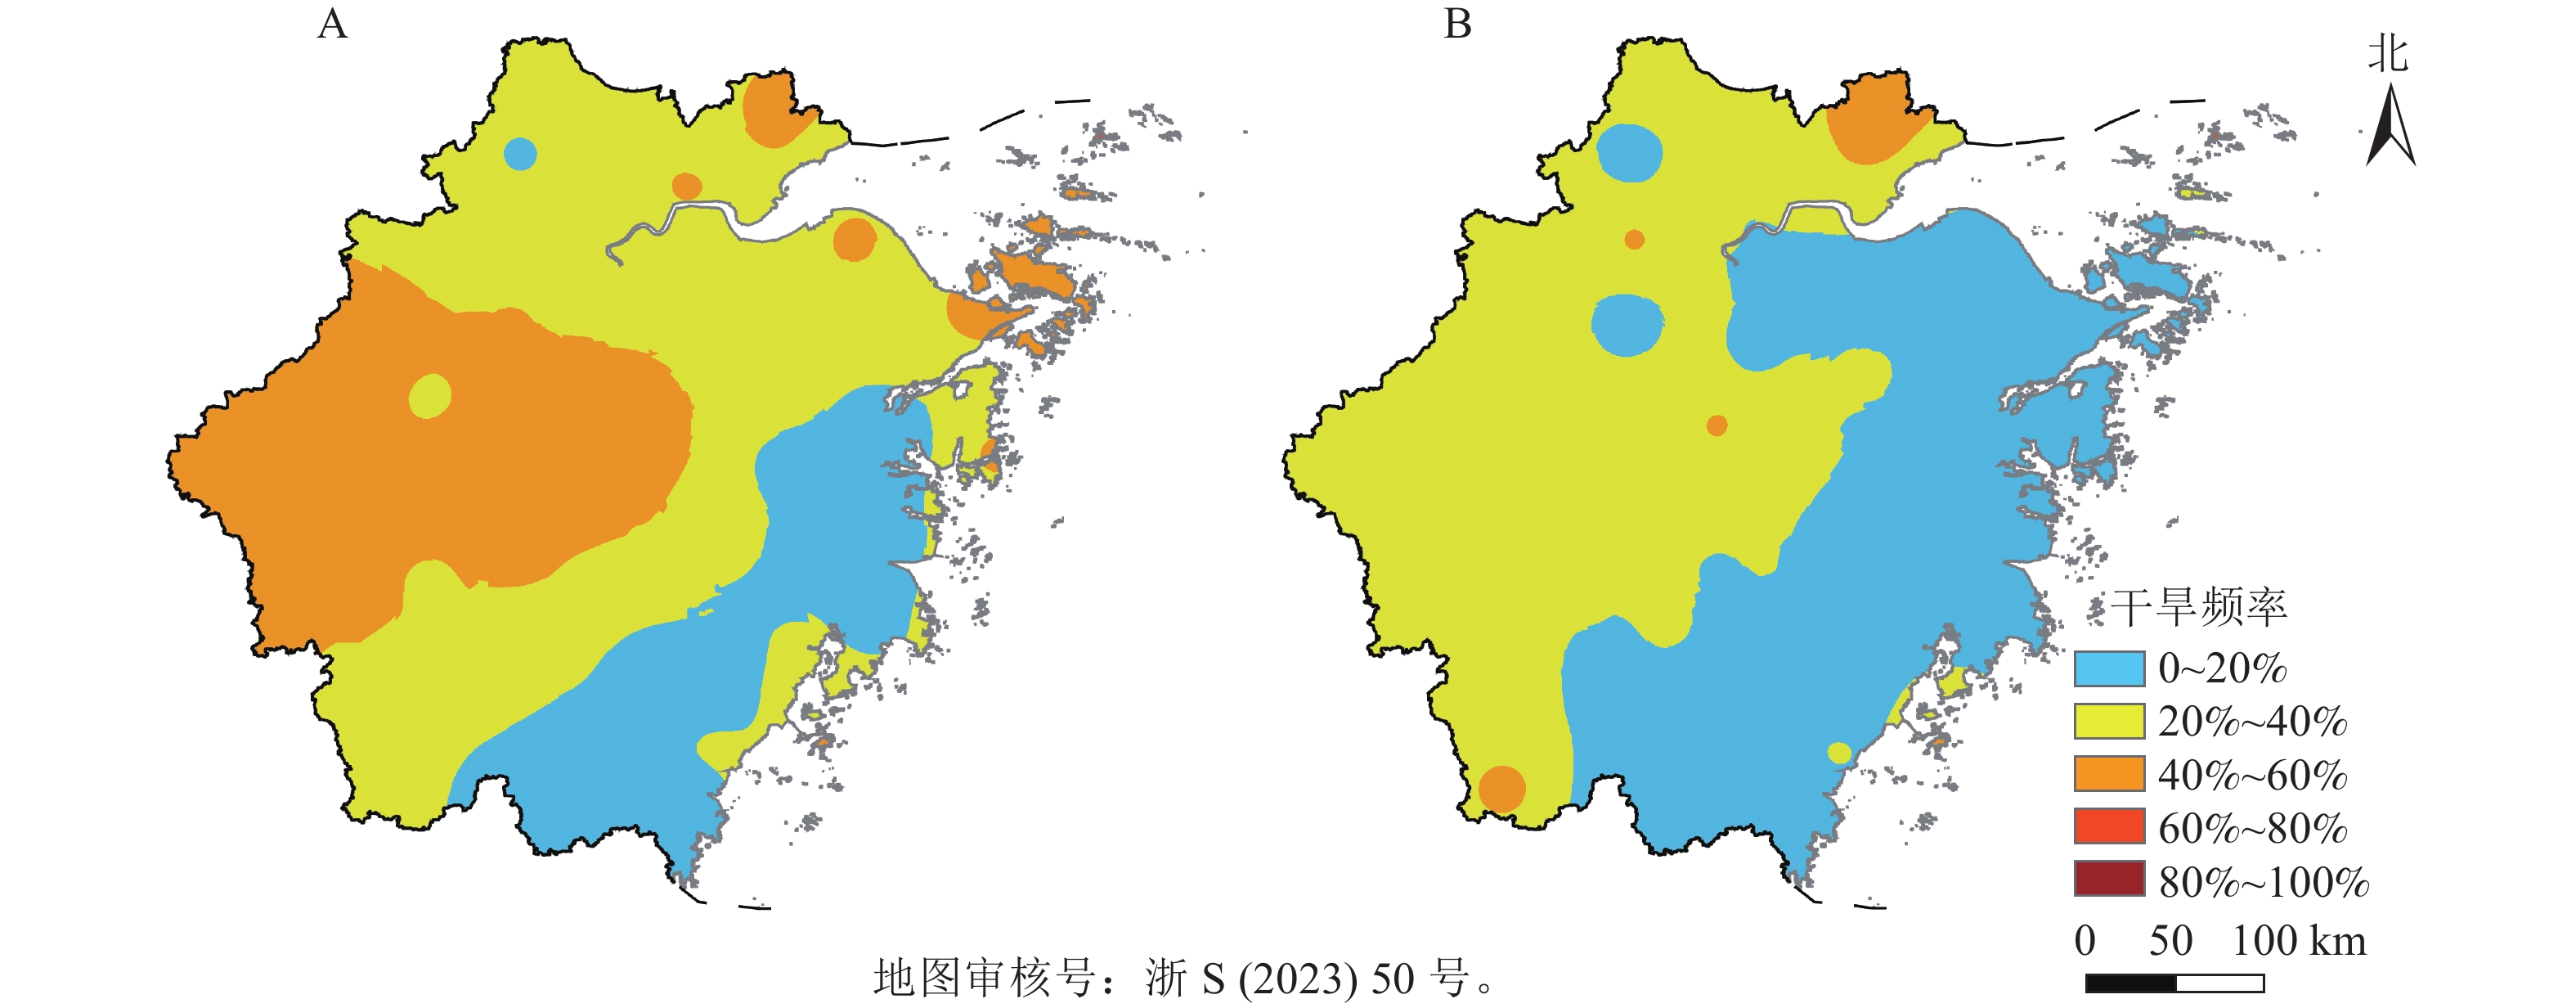
      根据浙江省各站点的相对湿润指数计算发生气象干旱年数与统计年数之比得到夏季和秋季的历年平均茶叶气象干旱频率分布(图2)。由图2A可知:近50 a来,浙江省绝大部分地区茶叶夏季干旱的发生频率在2%~62%,干旱频率平均为34%,茶叶干旱频率总体较高,主要呈现由浙西北向浙东南沿海递减的分布。金华、衢州和杭州部分地区发生干旱的频率为40%~60%,经常发生干旱;台州和温州等沿海地区发生干旱的频率为0~20%,极少发生干旱;其他地区发生干旱的频率为20%~40%,属于较少发生干旱的等级。图2B为发生茶叶秋季干旱的频率分布。浙江省出现茶叶秋季干旱的频率为2%~70%,平均值为23%,总体低于夏季,呈现西高东低的分布规律。杭州、湖州、金华、衢州和丽水部分地区发生干旱的频率为20%~40%,较少发生干旱,沿海地区(宁波、舟山、绍兴、台州和温州)发生干旱的频率为0~20%,属于极少发生干旱的等级。表明浙江省茶叶夏旱和秋旱的分布特征具有一定的相似性,夏季茶叶干旱发生的频率相对更高。

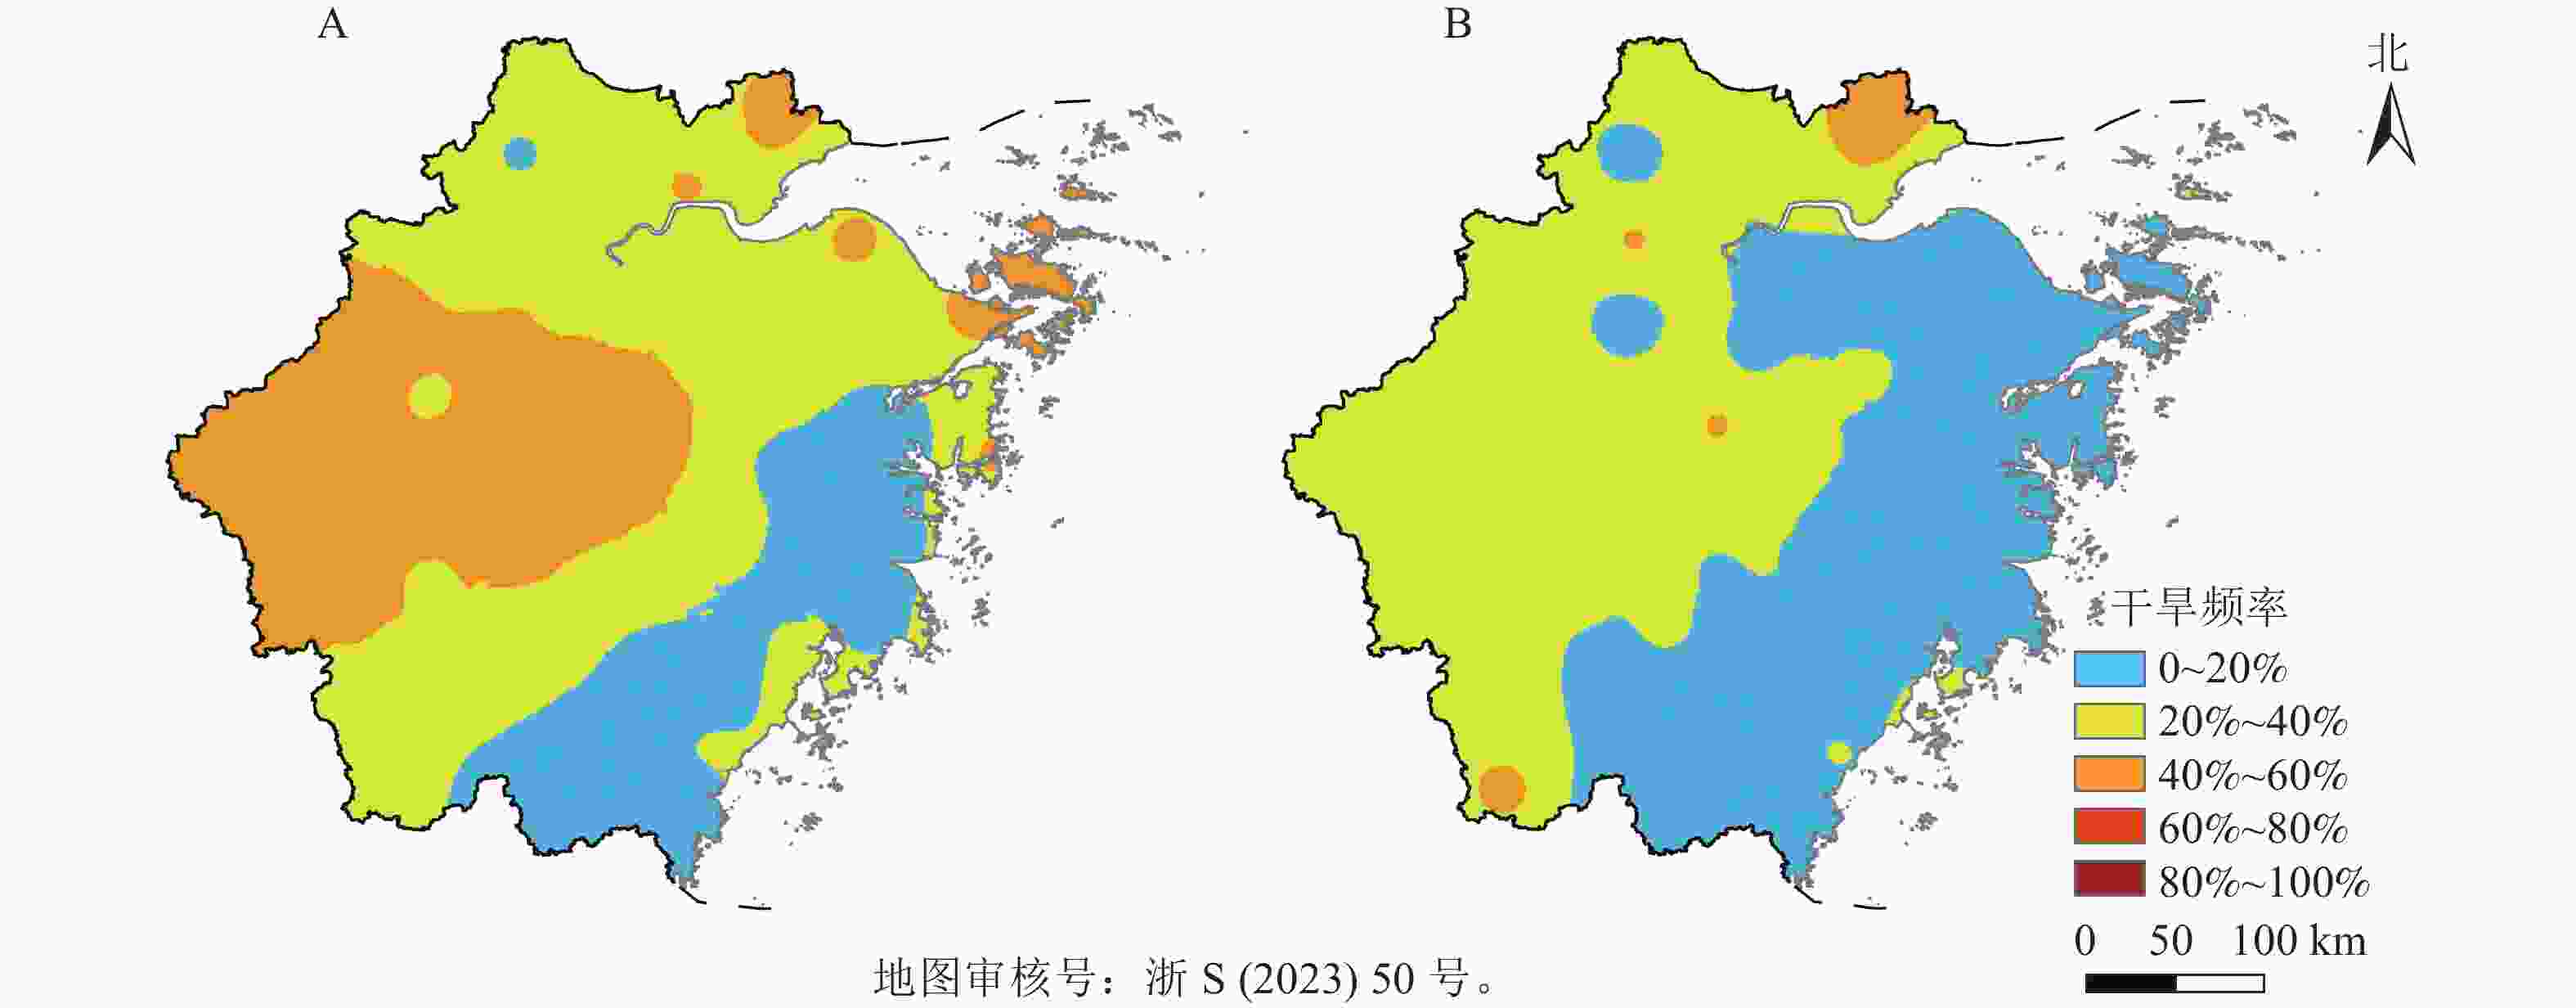
      Figure 2.  Spatial distribution of drought frequency of tea in summer(A) and in autumn(B) in Zhejiang from 1971 to 2020
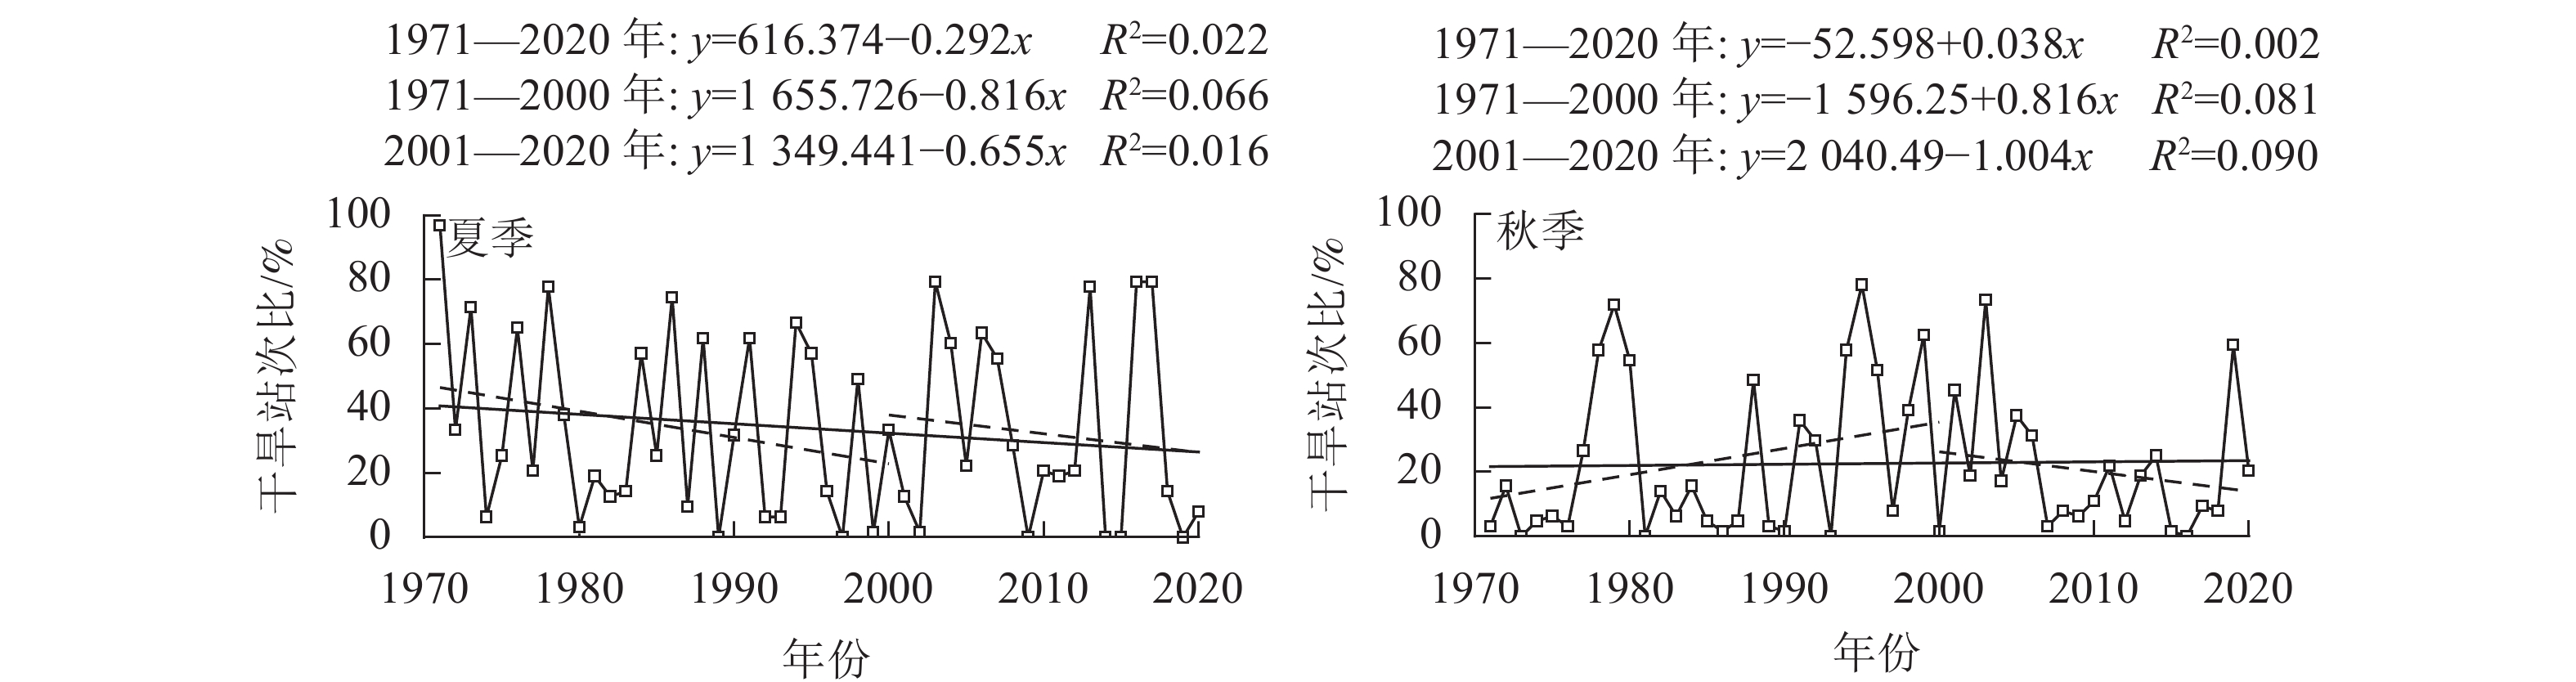
    • 图3可知:浙江省夏季和秋季茶叶干旱的站次比分别为33.7%和22.6%,夏季发生茶叶气象干旱的范围大于秋季。其中夏季茶叶干旱的站次比总体呈下降趋势,气候倾向率为−0.290 a−1,但2000年以后有4 a的站次比超过75%,2000年之前只出现过2次,说明虽然夏季干旱的站次比呈逐年下降的趋势,但出现极端大范围干旱的概率在增加。秋季茶叶干旱的站次比呈上升趋势,气候倾向率为0.038 a−1。1971—2000年,干旱站次比呈上升趋势,气候倾向率为0.820 a−1,近20 a (2001—2020年)呈下降趋势,气候倾向率为−1.000 a−1

      Figure 3.  Trend of drought station ratio in summer and autumn in Zhejiang from 1971 to 2020

      综上所述,浙江省茶叶夏季干旱的发生范围逐渐缩小,而茶叶秋季干旱的发生范围在2000年以后也在逐渐缩小。但在进入21世纪后,浙江省出现极端大范围茶叶干旱的频率增加,比如在2003、2013、2016和2017年的夏季以及2019年的秋季都出现了罕见的大范围茶叶干旱事件。

    • 对1971—2020年浙江省68站的茶叶夏季和秋季的相对湿润指数(IM)进行正交经验函数分解,得到2个茶叶生长季节相对湿润指数的时间和空间分布模态。根据NORTH等[25]的相关研究,其第一模态特征值与典型误差之差均大于第二模态特征值与典型误差之和,通过NORTH检验,第一模态和第二模态显著分离。

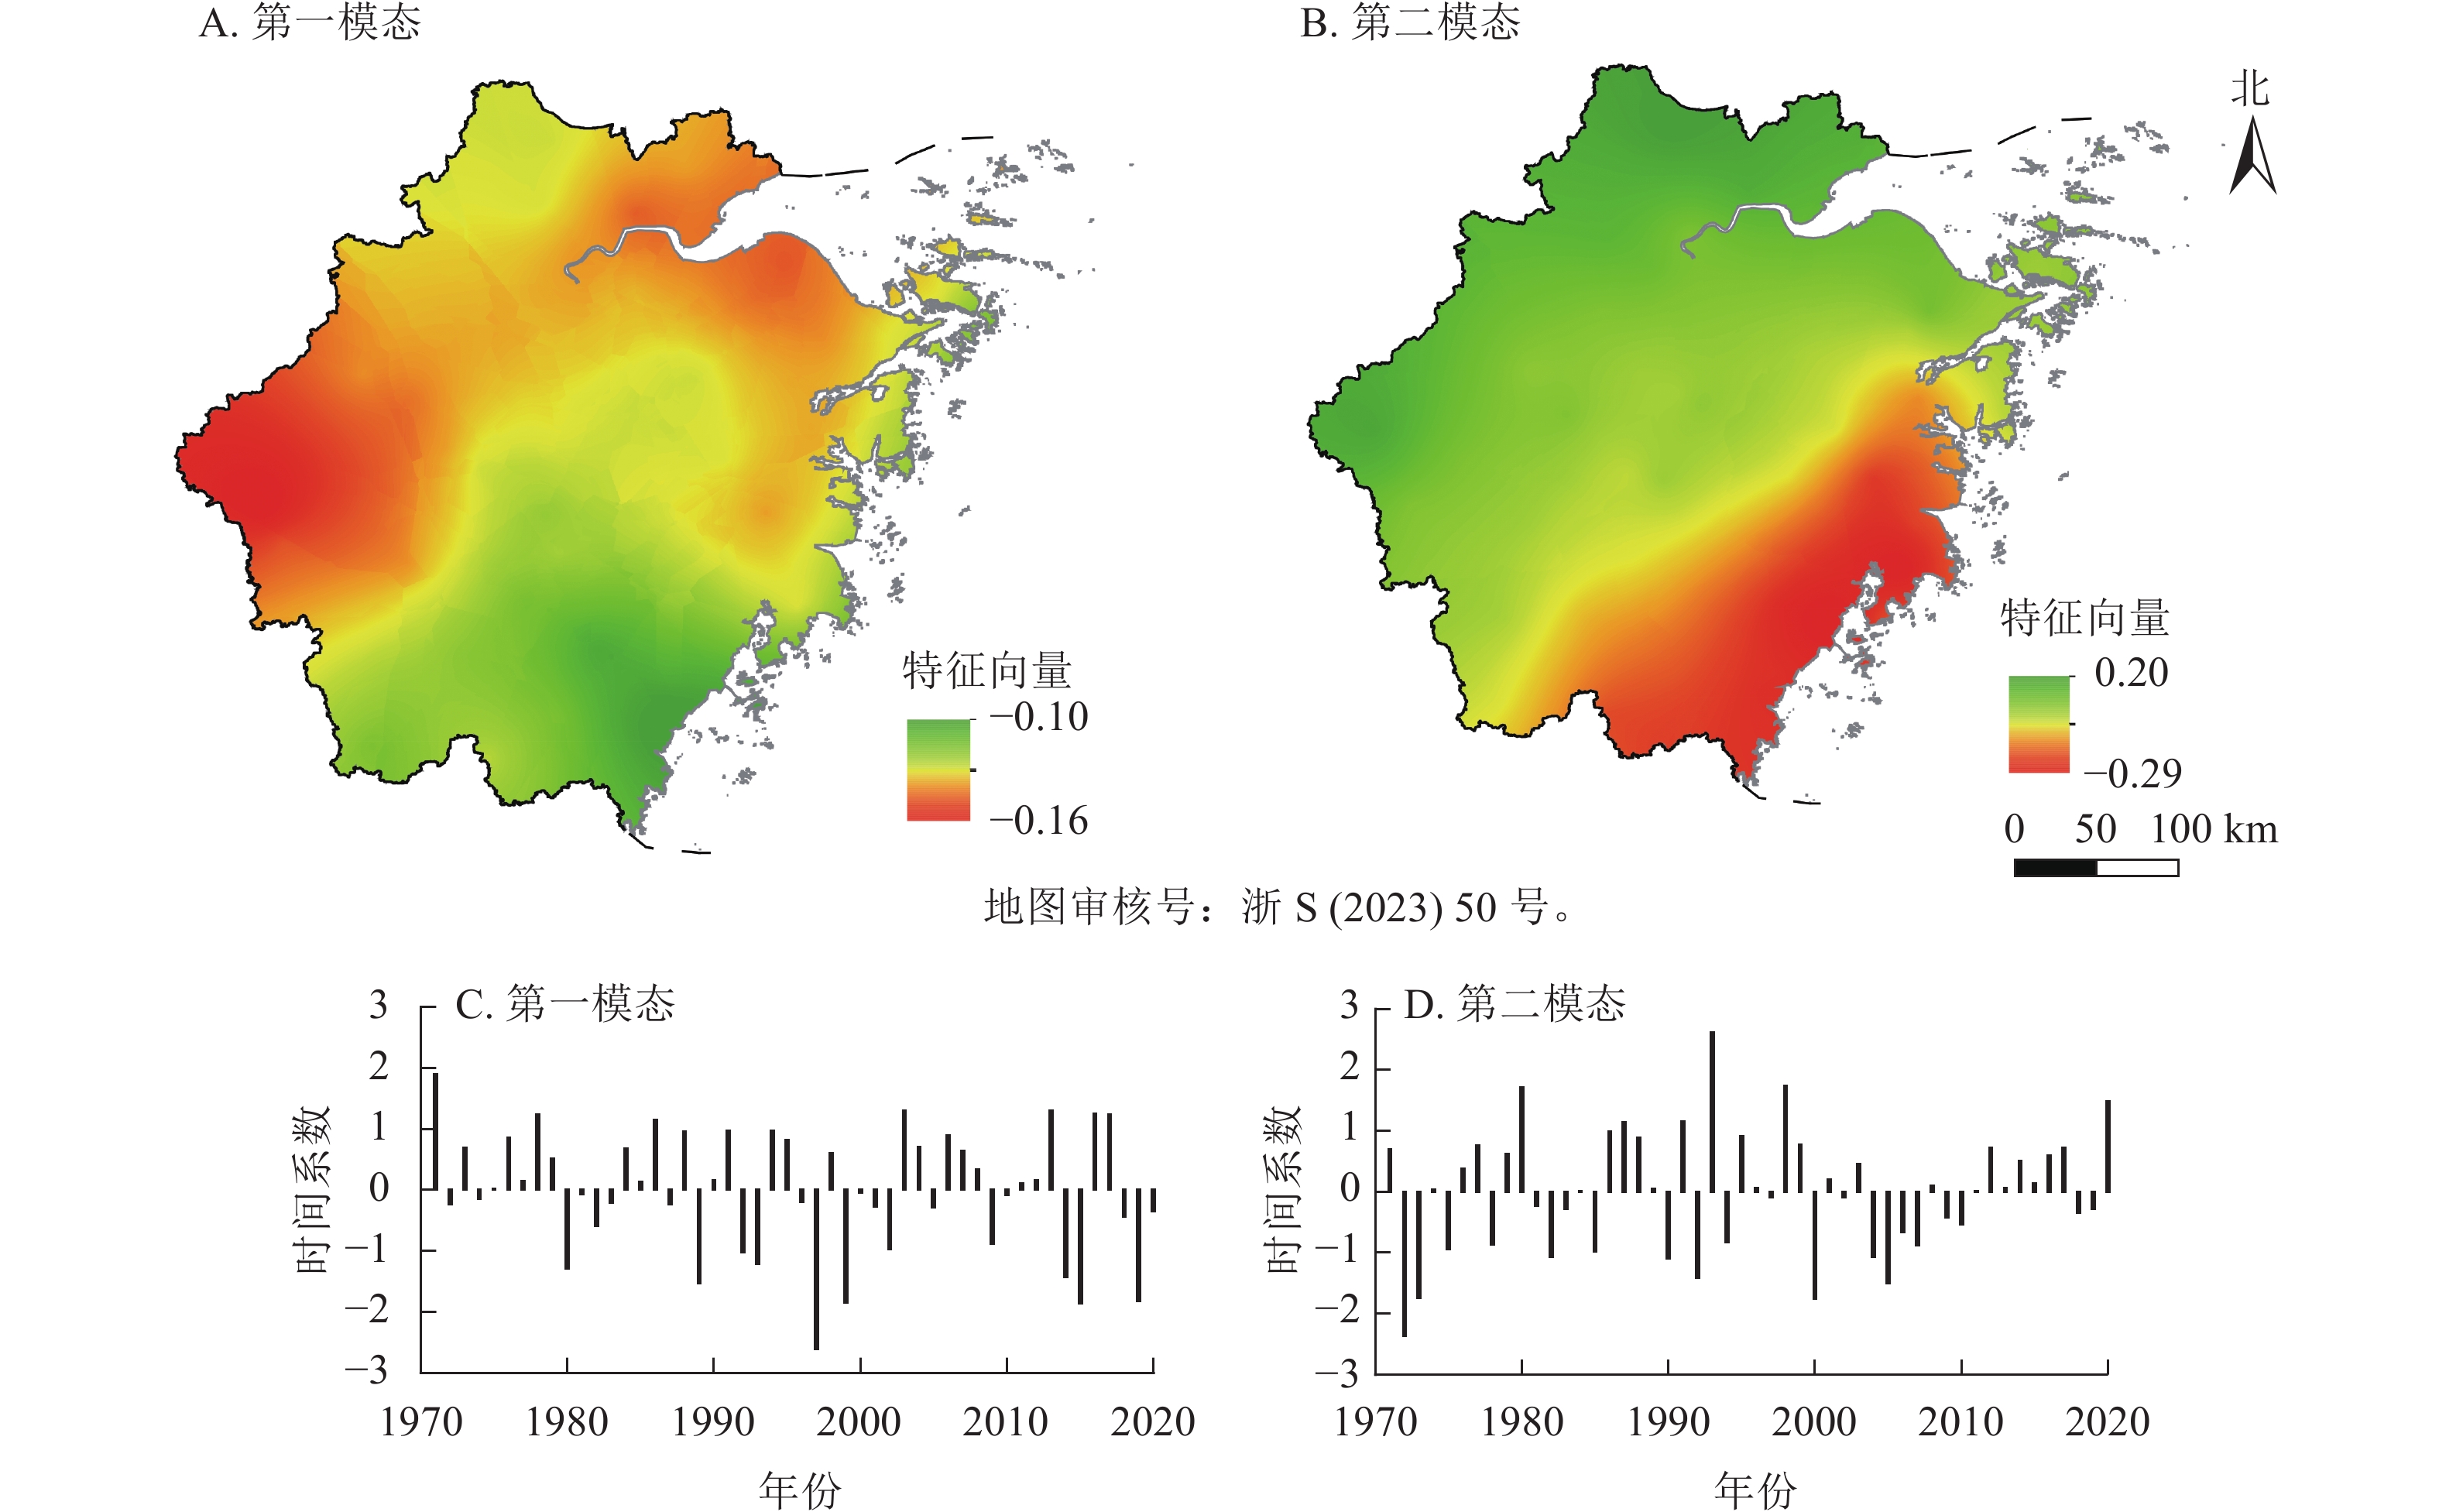
      分析结果表明:浙江省茶叶夏季干旱的前2个特征向量的方差贡献率分别为57%和14%,累计贡献率达71%,可以代表茶叶夏季干旱的主要特征。茶叶夏季干旱第一模态空间分布如图4A所示。该模态的特征向量的空间分布均为负值,表明浙江省茶叶夏季干旱的变化趋势基本一致,即干旱强度普遍较强或较轻,但是全省各区域干旱强度变化的幅度存在差异,主要的绝对值大值区域位于浙江西部和北部地区。这些区域特征向量变化幅度最大,对干旱的反应最为敏感,而南部的丽水和温州地区绝对值较小,变化幅度相对较小。第一模态的空间分布说明:浙江西部和北部地区干旱强度的波动比南部大,夏季更容易出现严重的茶叶干旱。茶叶夏季干旱第二模态空间分布如图4B所示,该模态与第一模态的空间分布存在显著差异,浙东南温州、台州等地为负值,北部大部分区域为正值,表明浙东南区域和北部区域的干旱强度呈现相反的空间分布特征。特征向量对应的时间系数代表其分布的时间变化特征。从茶叶夏季干旱第一模态对应的时间系数(图4C)来看,20世纪90年代以前时间系数以正值居多,说明该时段浙江省出现茶叶夏季干旱的年份较多,20世纪90年代以后出现明显的年代际振荡特征,负值增多,表明这一时期浙江省出现茶叶干旱的年份相对减少,但严重干旱年份仍然存在,如2003、2013、2016和2017年。第二模态对应的时间系数(图4D)呈现波动变化,表明当温州、台州等地茶叶夏季干旱偏强(弱)时,北部大部分区域偏弱(强)。

      Figure 4.  First two mode distribution and the time coefficient variation of Zhejiang’s tea drought intensity EOF in summer

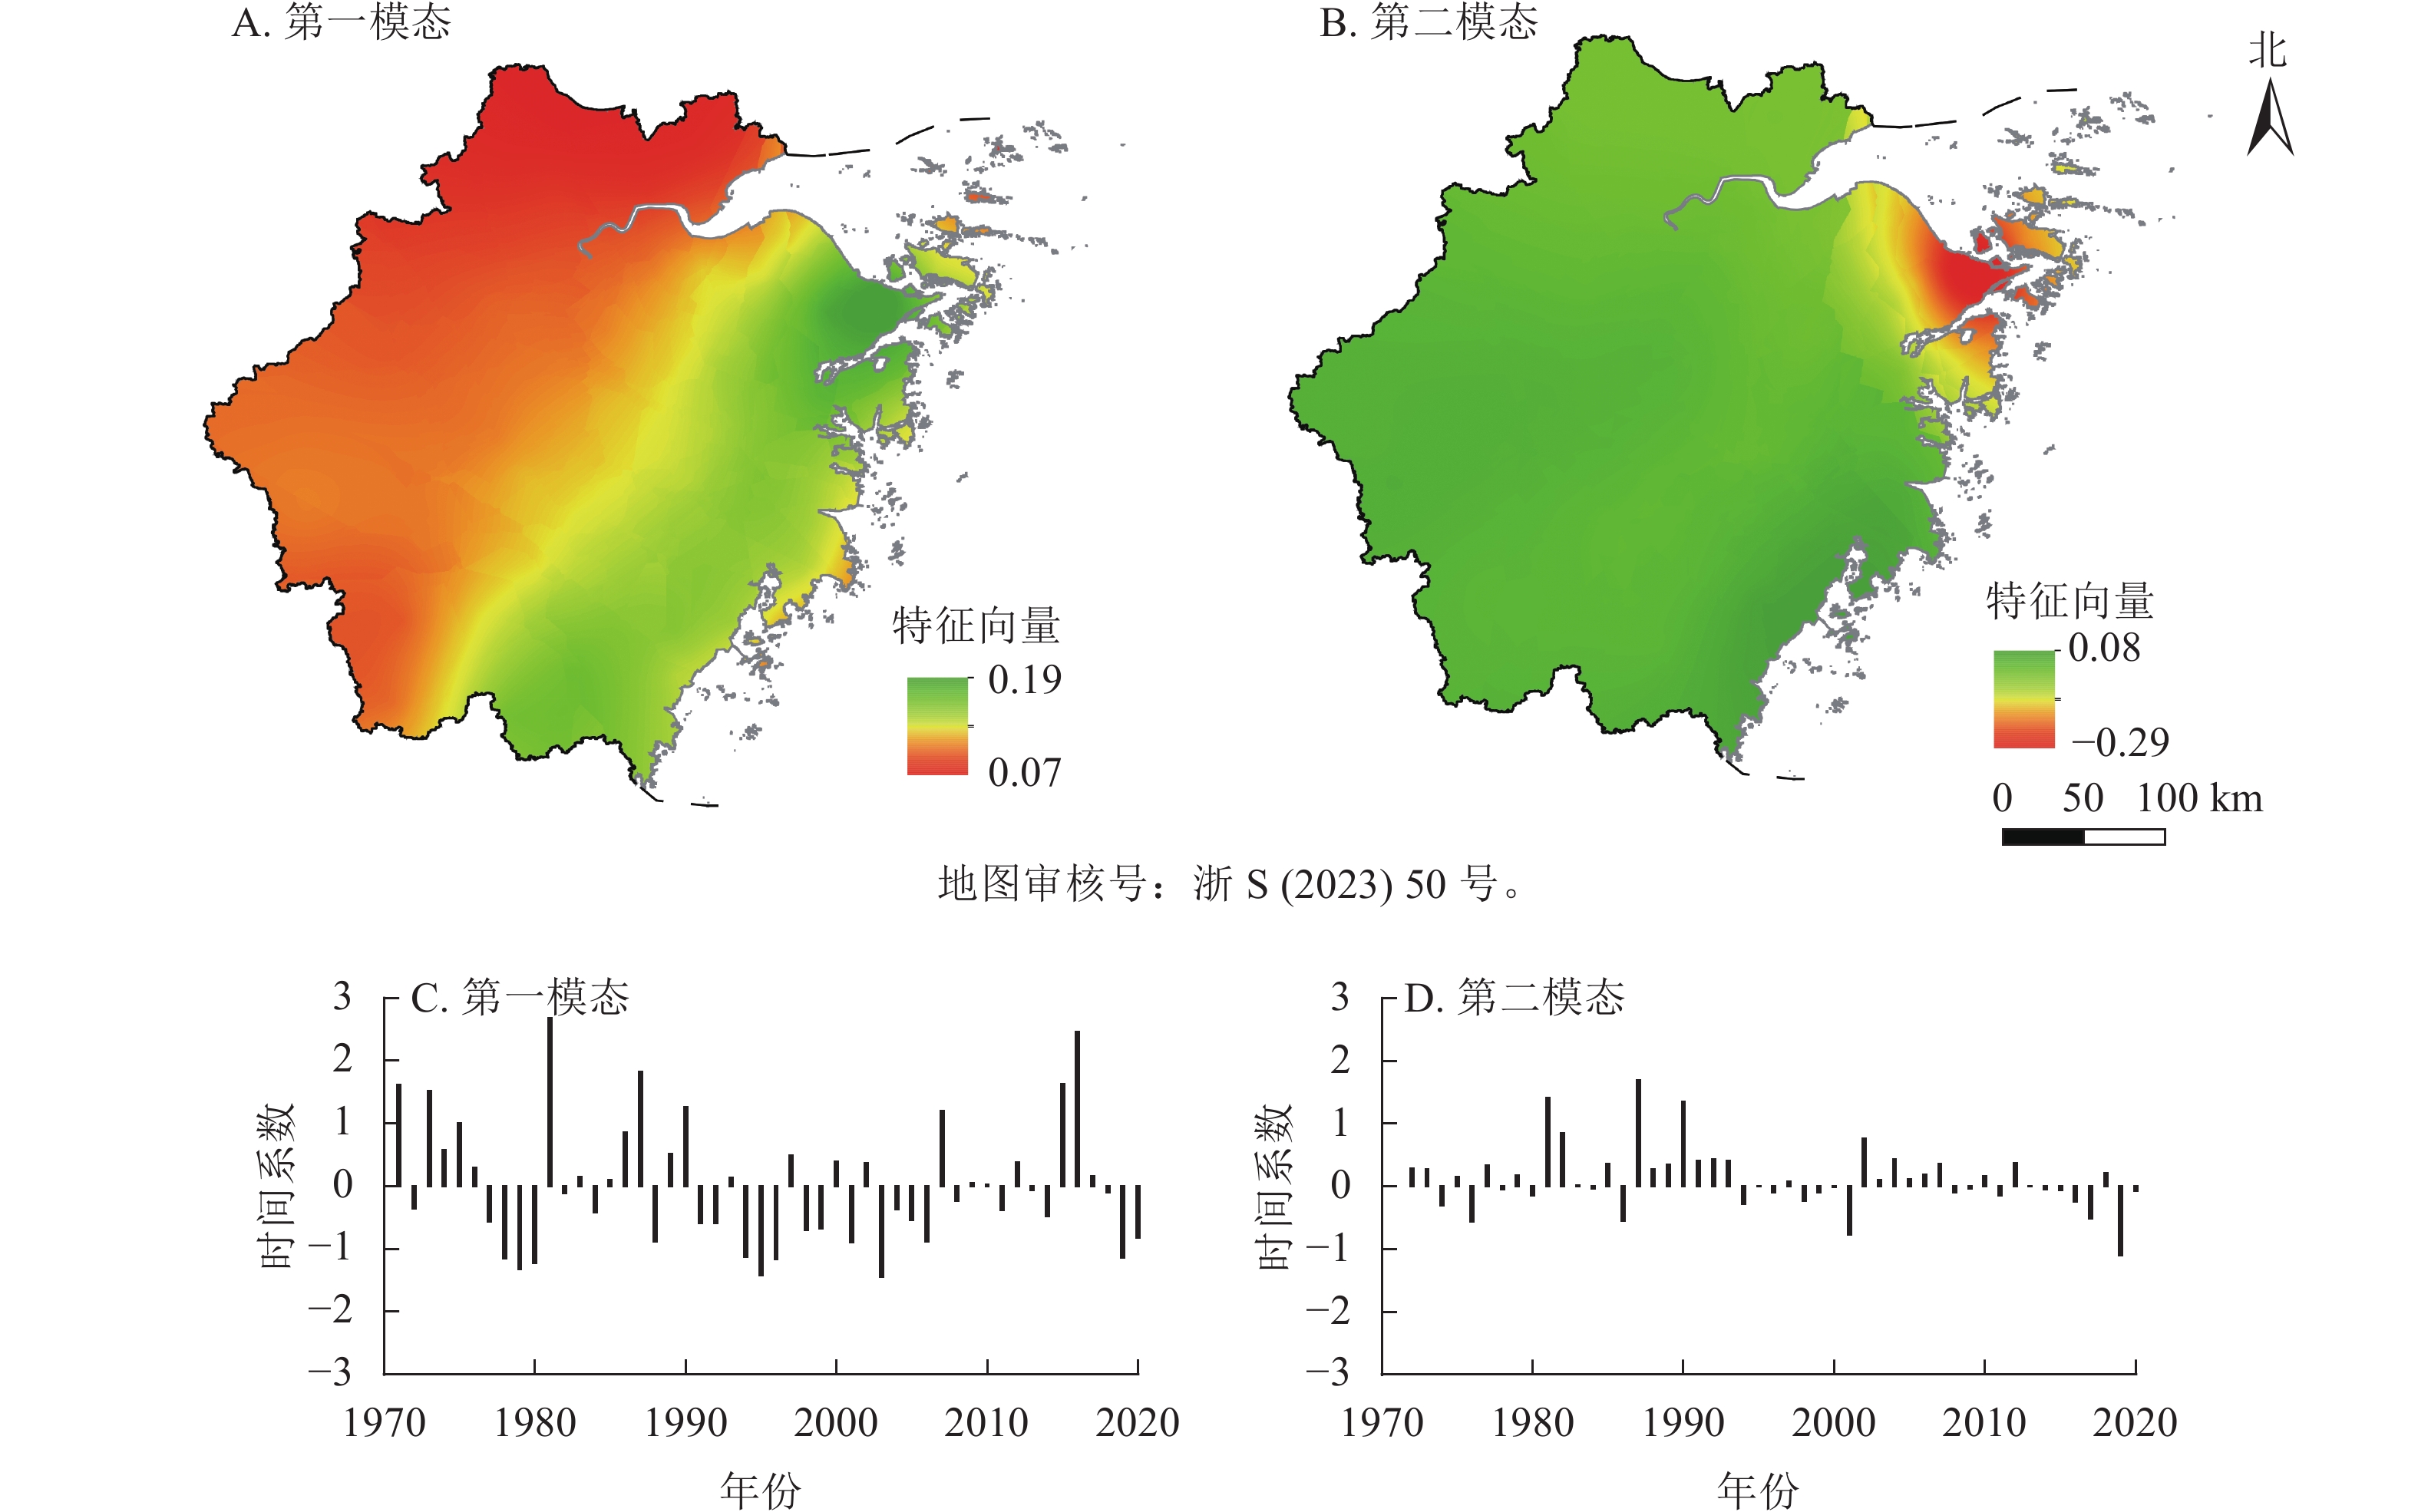
      浙江省茶叶秋季干旱的前2个特征向量方差贡献率分别为46%和13%,累计贡献率达59%。茶叶秋季干旱第一模态空间分布如图5A所示,该模态特征向量的空间分布均为正值,表明茶叶秋季干旱变化趋势基本一致,即干旱强度普遍较强或较轻,但是不同区域干旱强度变化幅度存在差异,主要绝对值大值区域位于浙江宁波、台州和温州。该区域特征向量变化幅度大,对干旱的反应最为敏感,而西北部地区绝对值较小,变化幅度相对较小。第一模态的空间分布说明:浙江东南部地区干旱强度的波动比西北部大,秋季更容易出现严重的茶叶干旱。茶叶秋季干旱第二模态空间分布(图5B)与第一模态的空间分布存在显著差异,全省大部分地区为正值,宁波和舟山为负值,表明宁波和舟山与全省其他大部分地区的干旱强度呈现相反的空间分布特征。从茶叶秋季干旱第一模态对应的时间系数(图5C)来看,20世纪90年代以前时间系数呈现波动变化,茶叶秋季干旱与湿润交替出现,20世纪90年代以后以负值居多,表明这一时期浙江省出现茶叶秋季干旱的年份相对增加,如2003和2019年。第二模态对应的时间系数(图5D)呈现波动变化,表明当宁波、舟山等地茶叶秋季干旱偏强(弱)时,其他区域偏弱(强)。

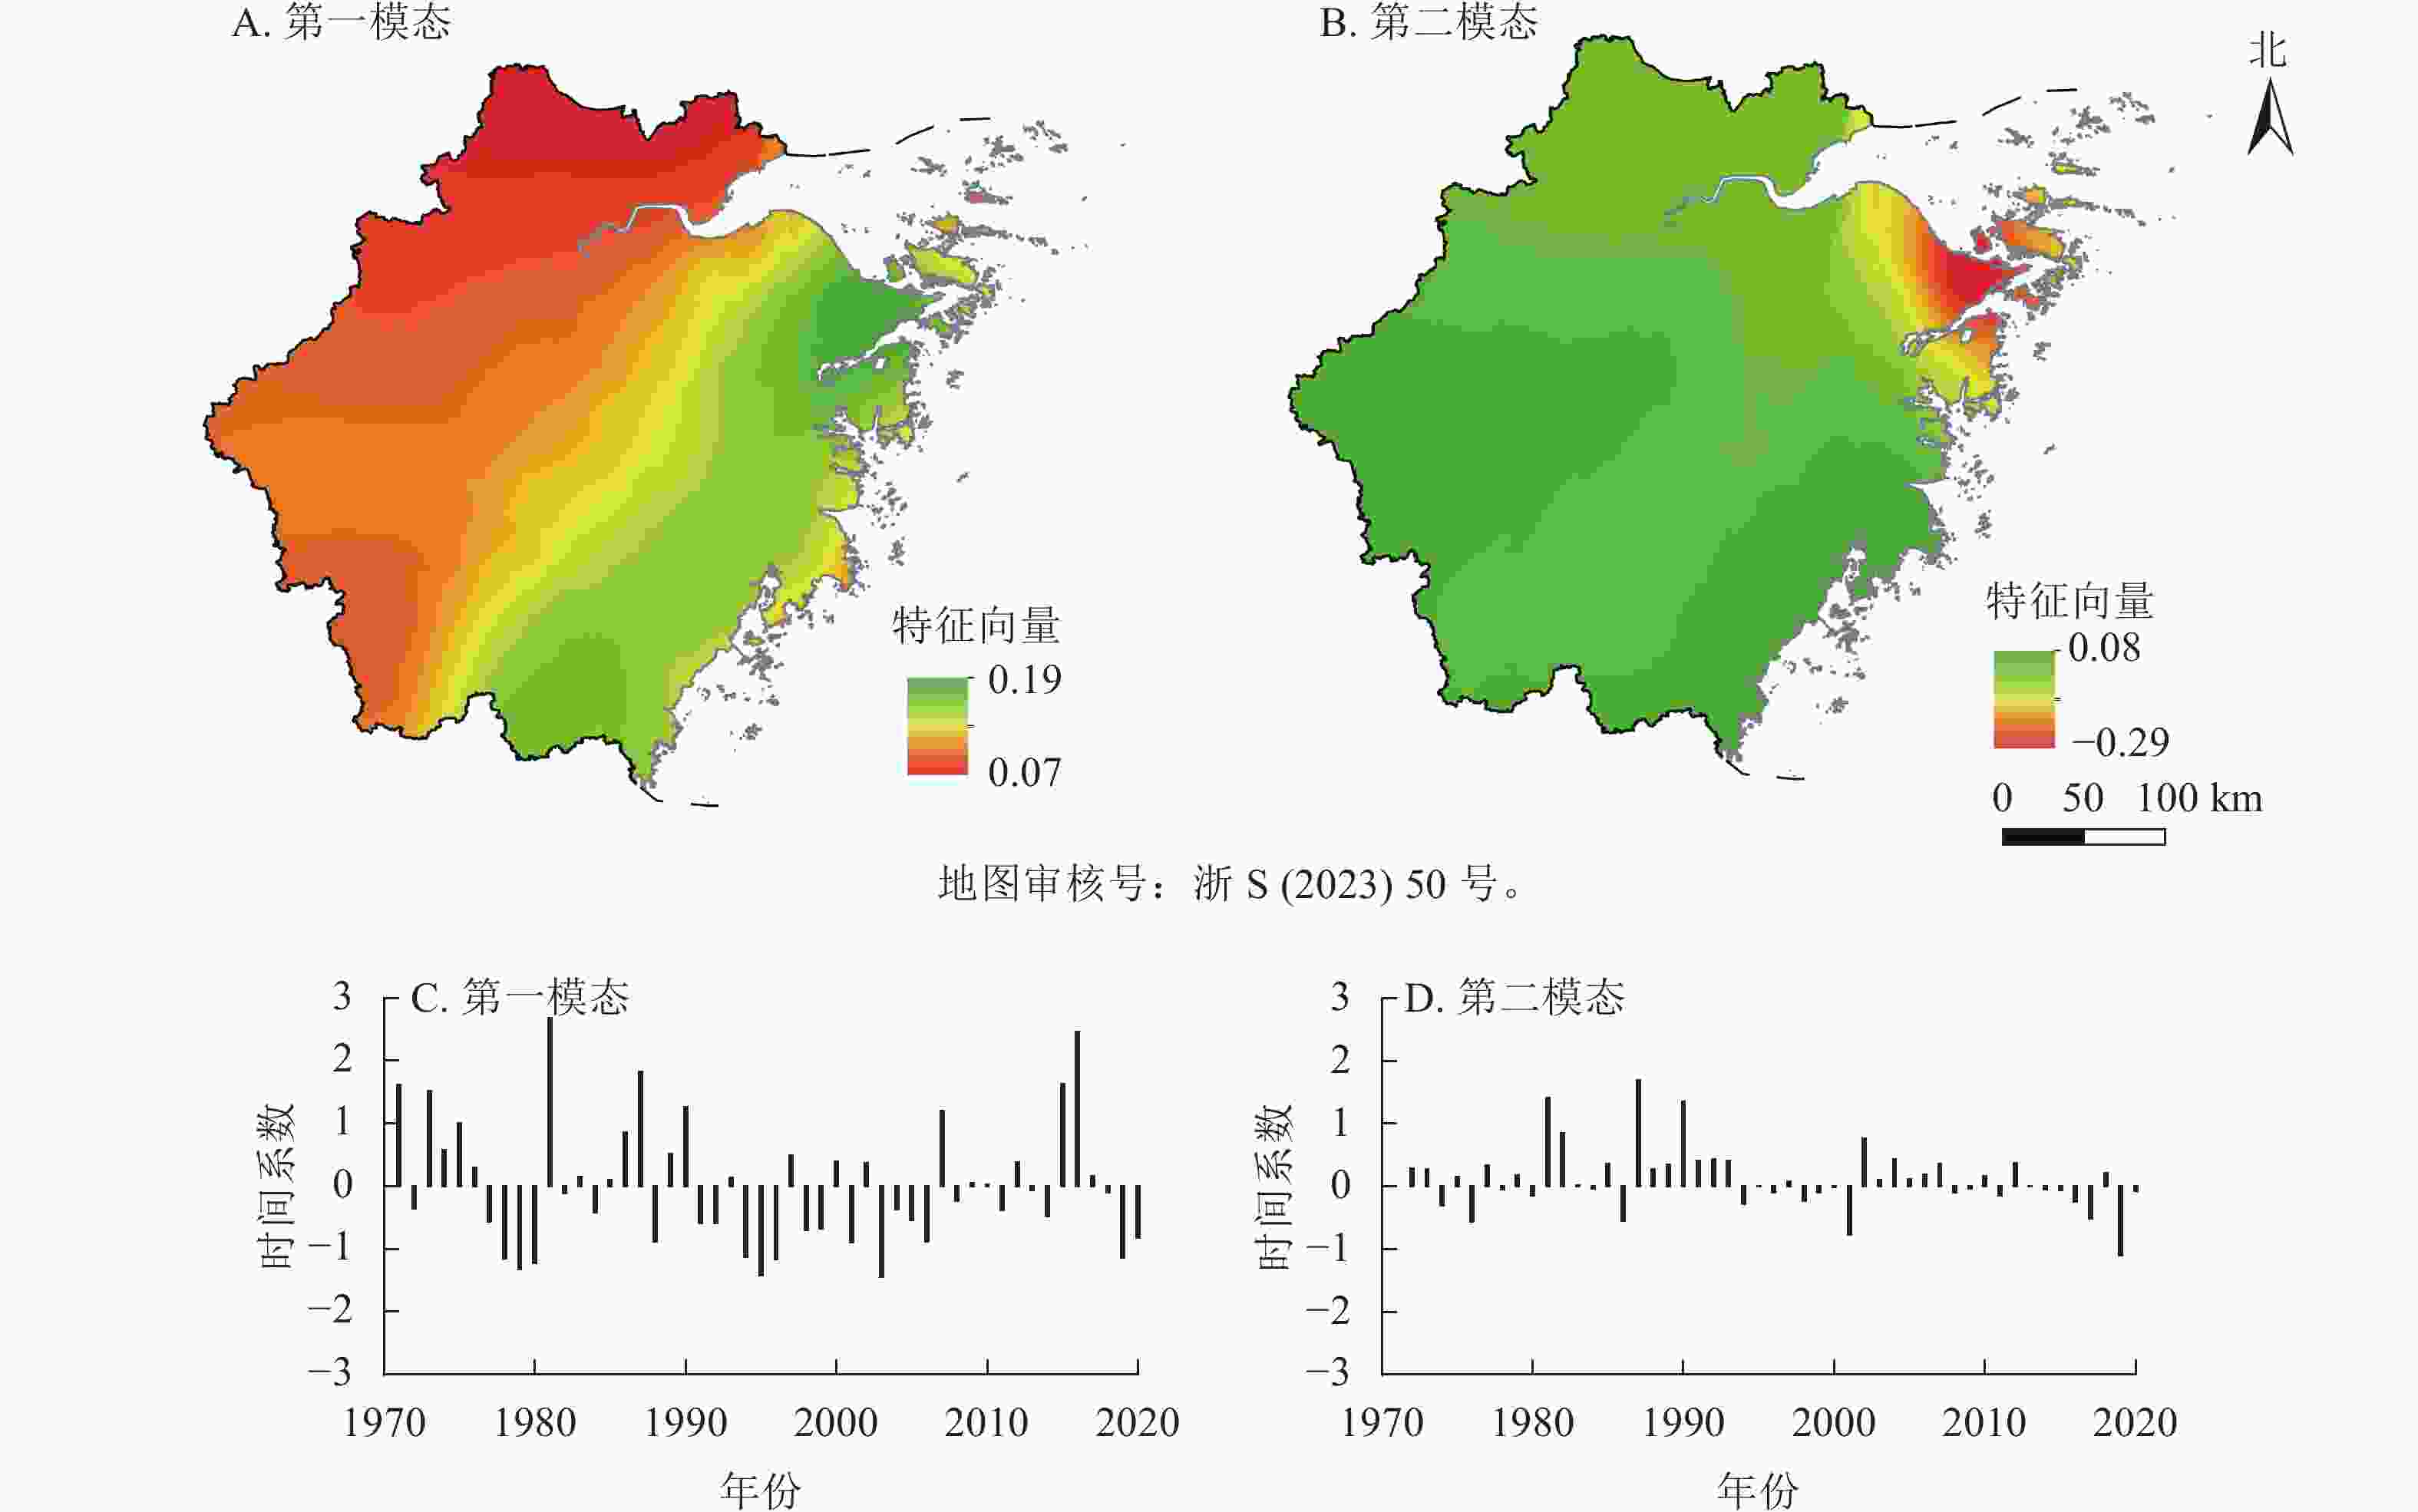
      Figure 5.  First two mode distribution and the time coefficient variation of Zhejiang’s tea drought intensity EOF in autumn

    • 分别将EOF变换得到的茶叶夏季和秋季干旱强度场主要模态的时间序列进行小波变换分析,小波系数实部反映的是茶叶气象干旱在不同时间尺度的周期变化及在时间域中的分布,小波系数的模则是用来分析其信号的强弱从而确定茶叶气象干旱变化的主周期。分析可知:浙江茶叶夏季和秋季干旱强度都存在显著的周期性变化,但不同季节的年际变化存在一定差异。

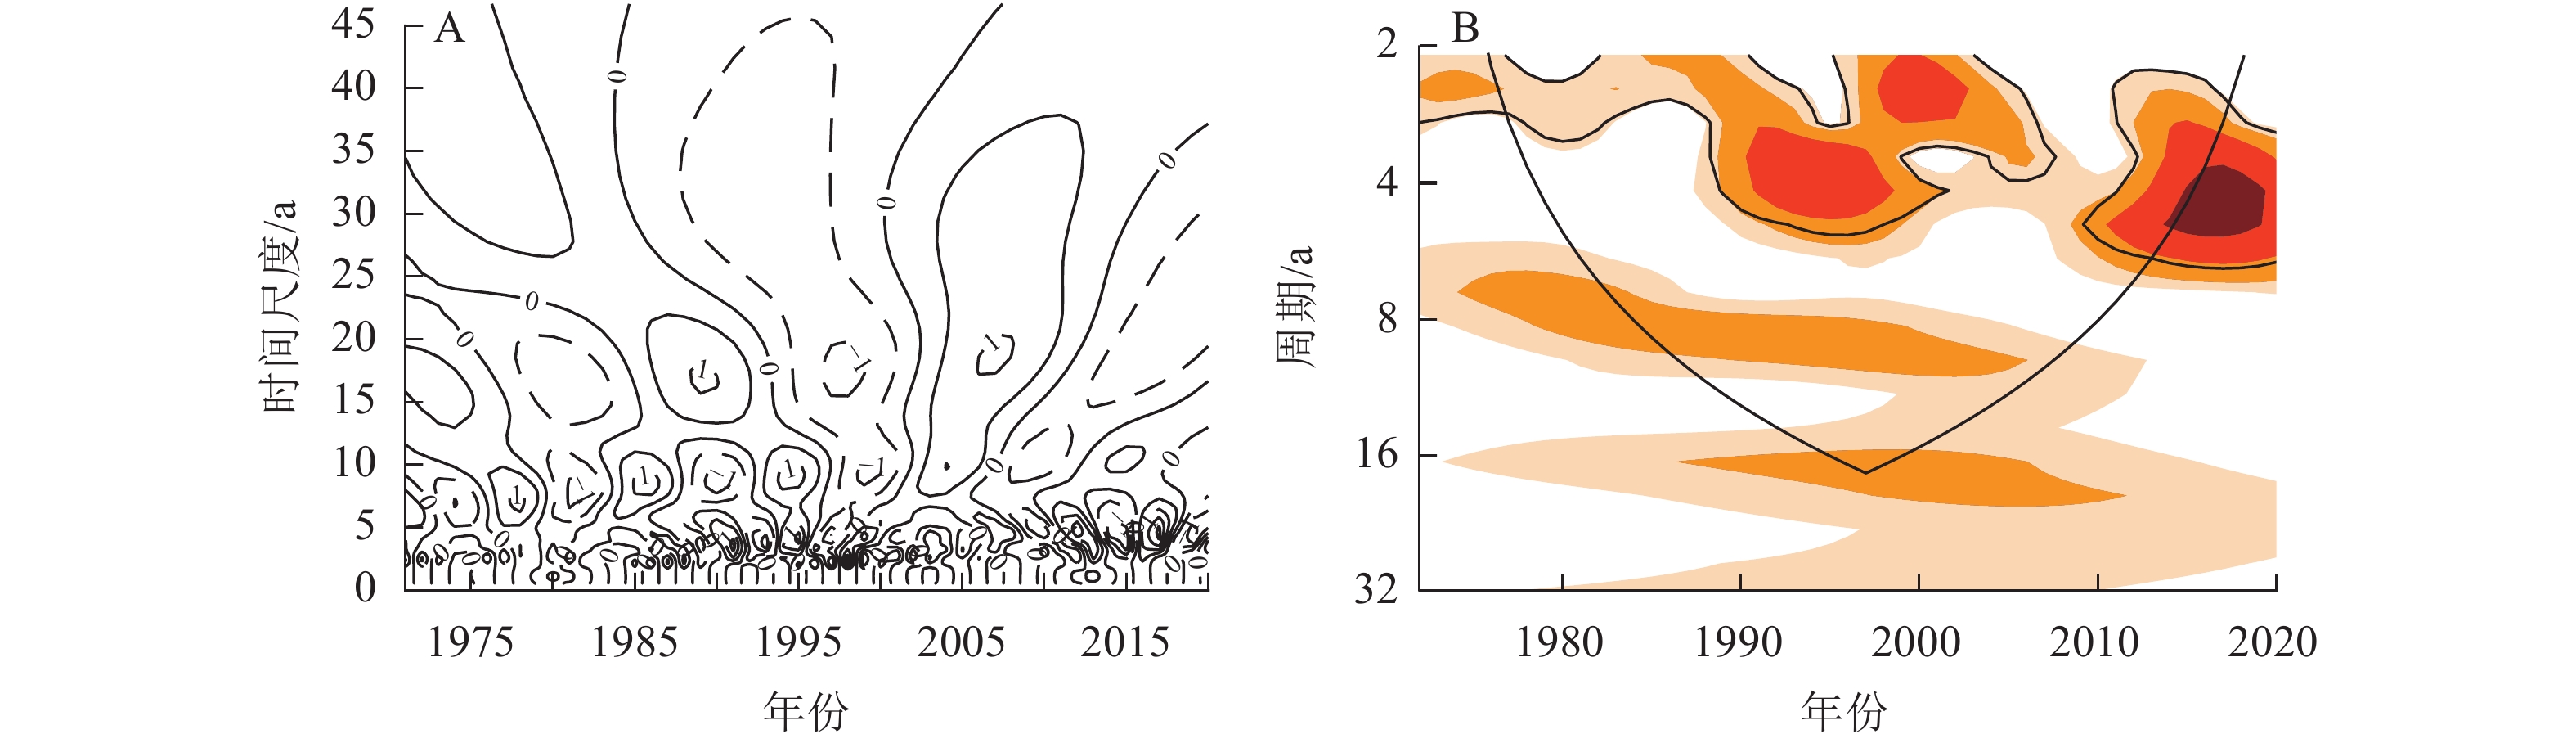
      根据图6A,茶叶夏季干旱强度第一模态时间序列存在明显的不同时间尺度的振荡信号,主要是准2~6、6~10以及15~20 a尺度的变化周期,其中1985—2005、2010—2015年存在2~6 a的周期振荡信号,1985—2005和2010—2015年均通过了0.05显著性水平的高斯白噪声检验(以下简称“检验”);1971—2010年存在6~10 a周期,其在1980—2005年通过了检验;1971—2010还存在15~20 a的变化周期,但没有通过显著性检验。根据小波系数模的分布(图6B),2~6 a周期的能量密度最大,该尺度的周期性最强,且茶叶夏季干旱的主要模态表现为全区一致性,说明浙江省茶叶夏季干旱存在明显的2~6 a的强弱变化周期。

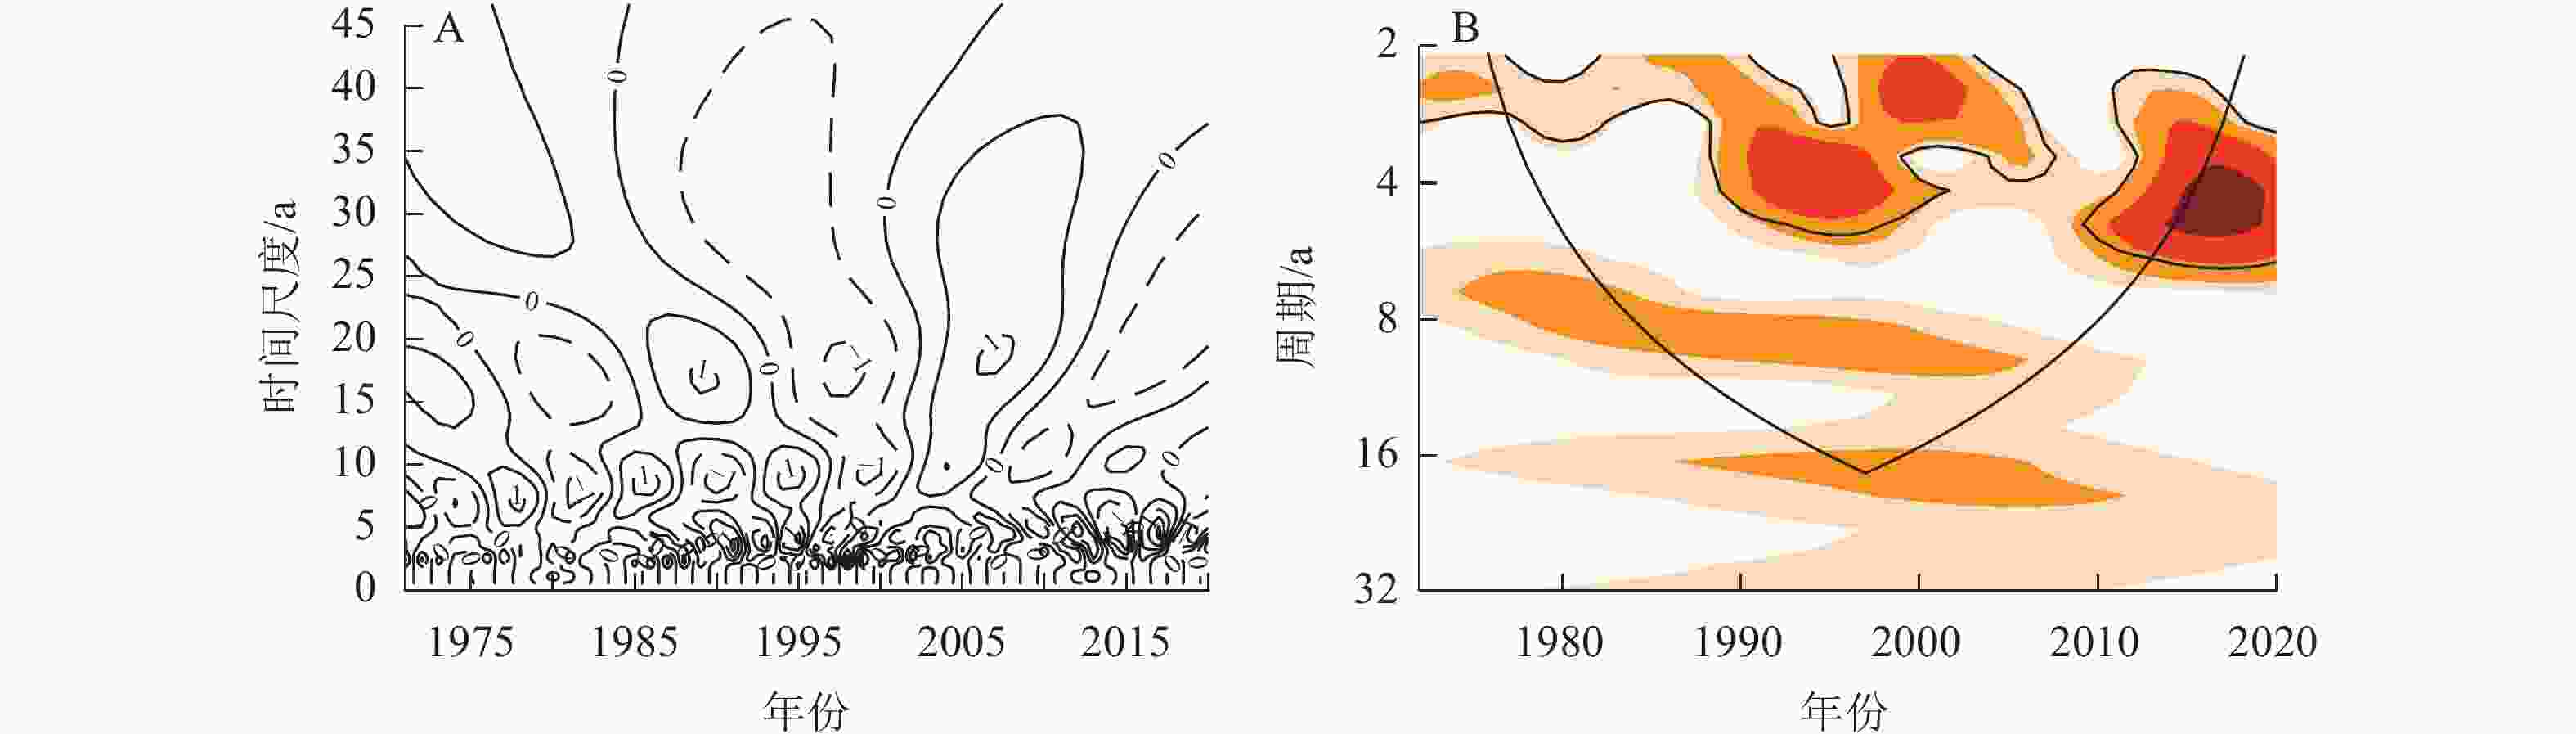
      Figure 6.  Wavelet spectrum analysis of the First Mode time coefficient of EOF of Zhejiang’s tea drought intensity in summer

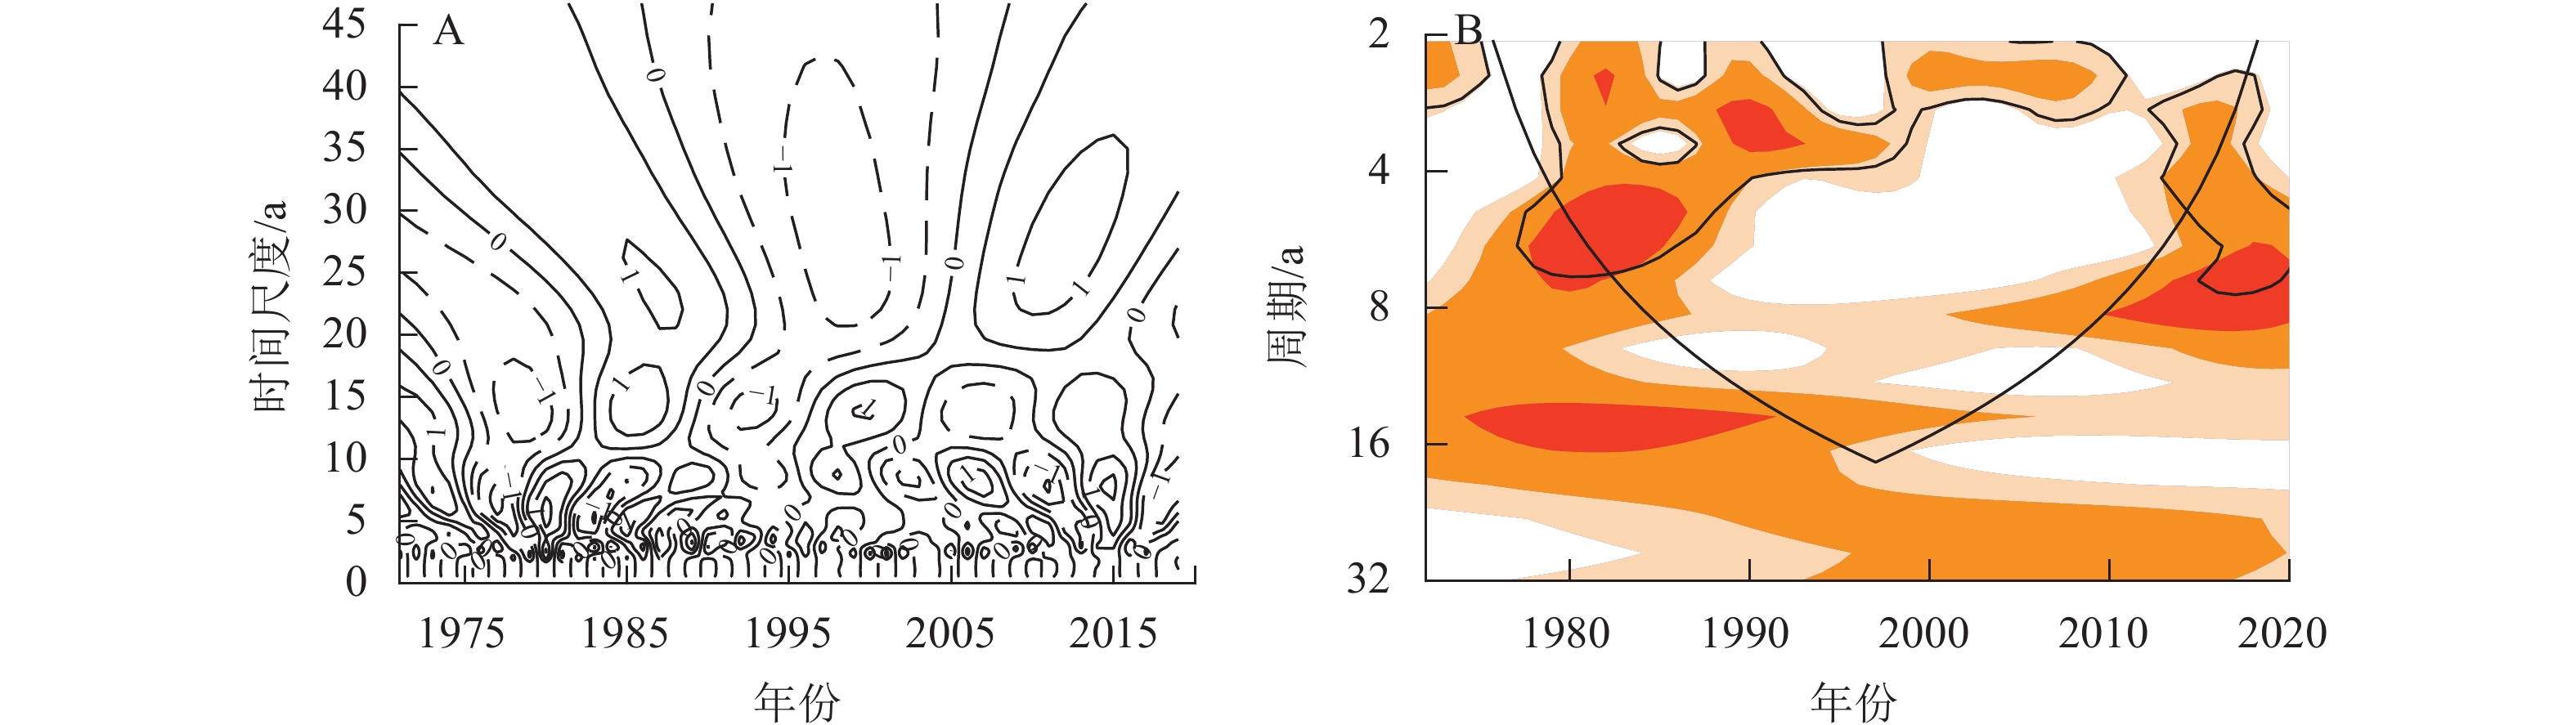
      根据图7A,茶叶秋季干旱强度第一模态时间序列存在准2~4、6~10以及12~16 a的变化周期,其中1980—2010年存在2~4 a的周期振荡信号,并且通过了显著性检验;1971—1990、2000—2020年存在6~10 a周期,其中在1980—1990、2000—2010年通过了检验;12~16 a尺度的周期贯穿整个50 a,但只在1990—2000年通过检验。根据小波系数模的分布(图7B),2~4和6~10 a周期的能量密度最大,该尺度的周期性最强,且茶叶秋季干旱的主要模态表现为为全区一致性,说明浙江省茶叶秋季干旱存在明显的2~4和6~10 a的强弱变化周期。

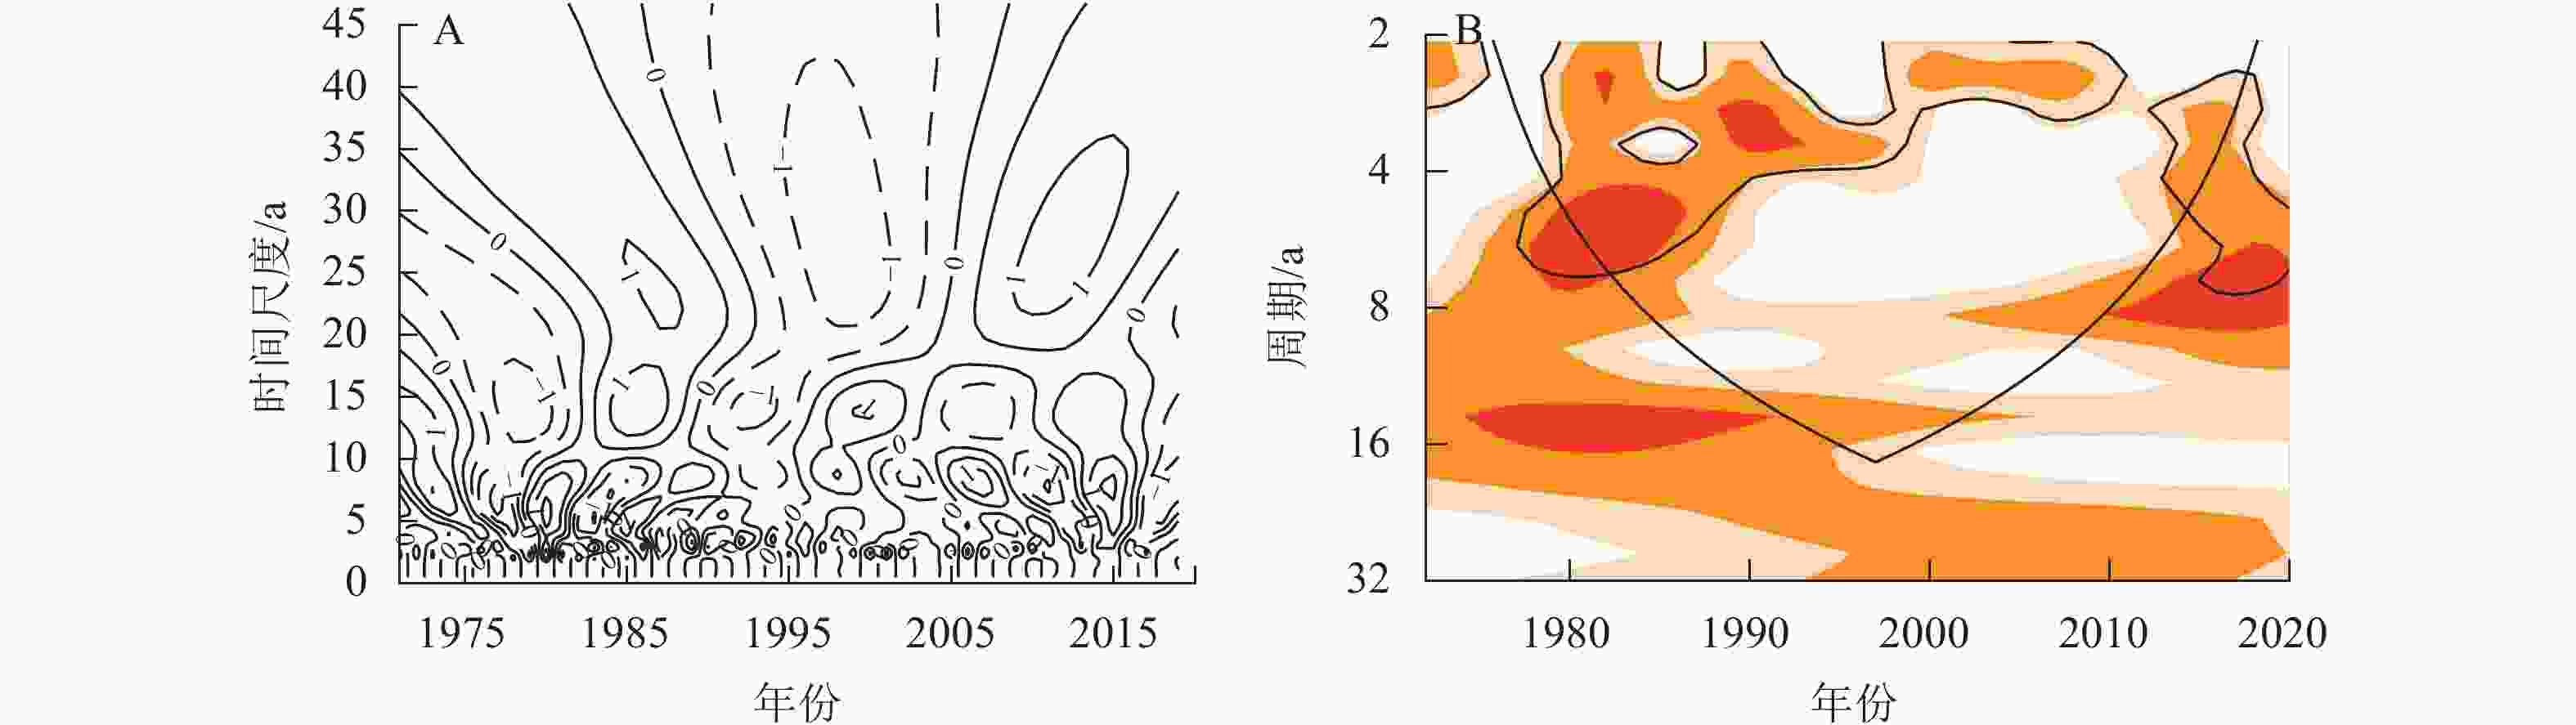
      Figure 7.  Wavelet spectrum analysis of the First Mode time coefficient of EOF of Zhejiang’s tea drought intensity in autumn

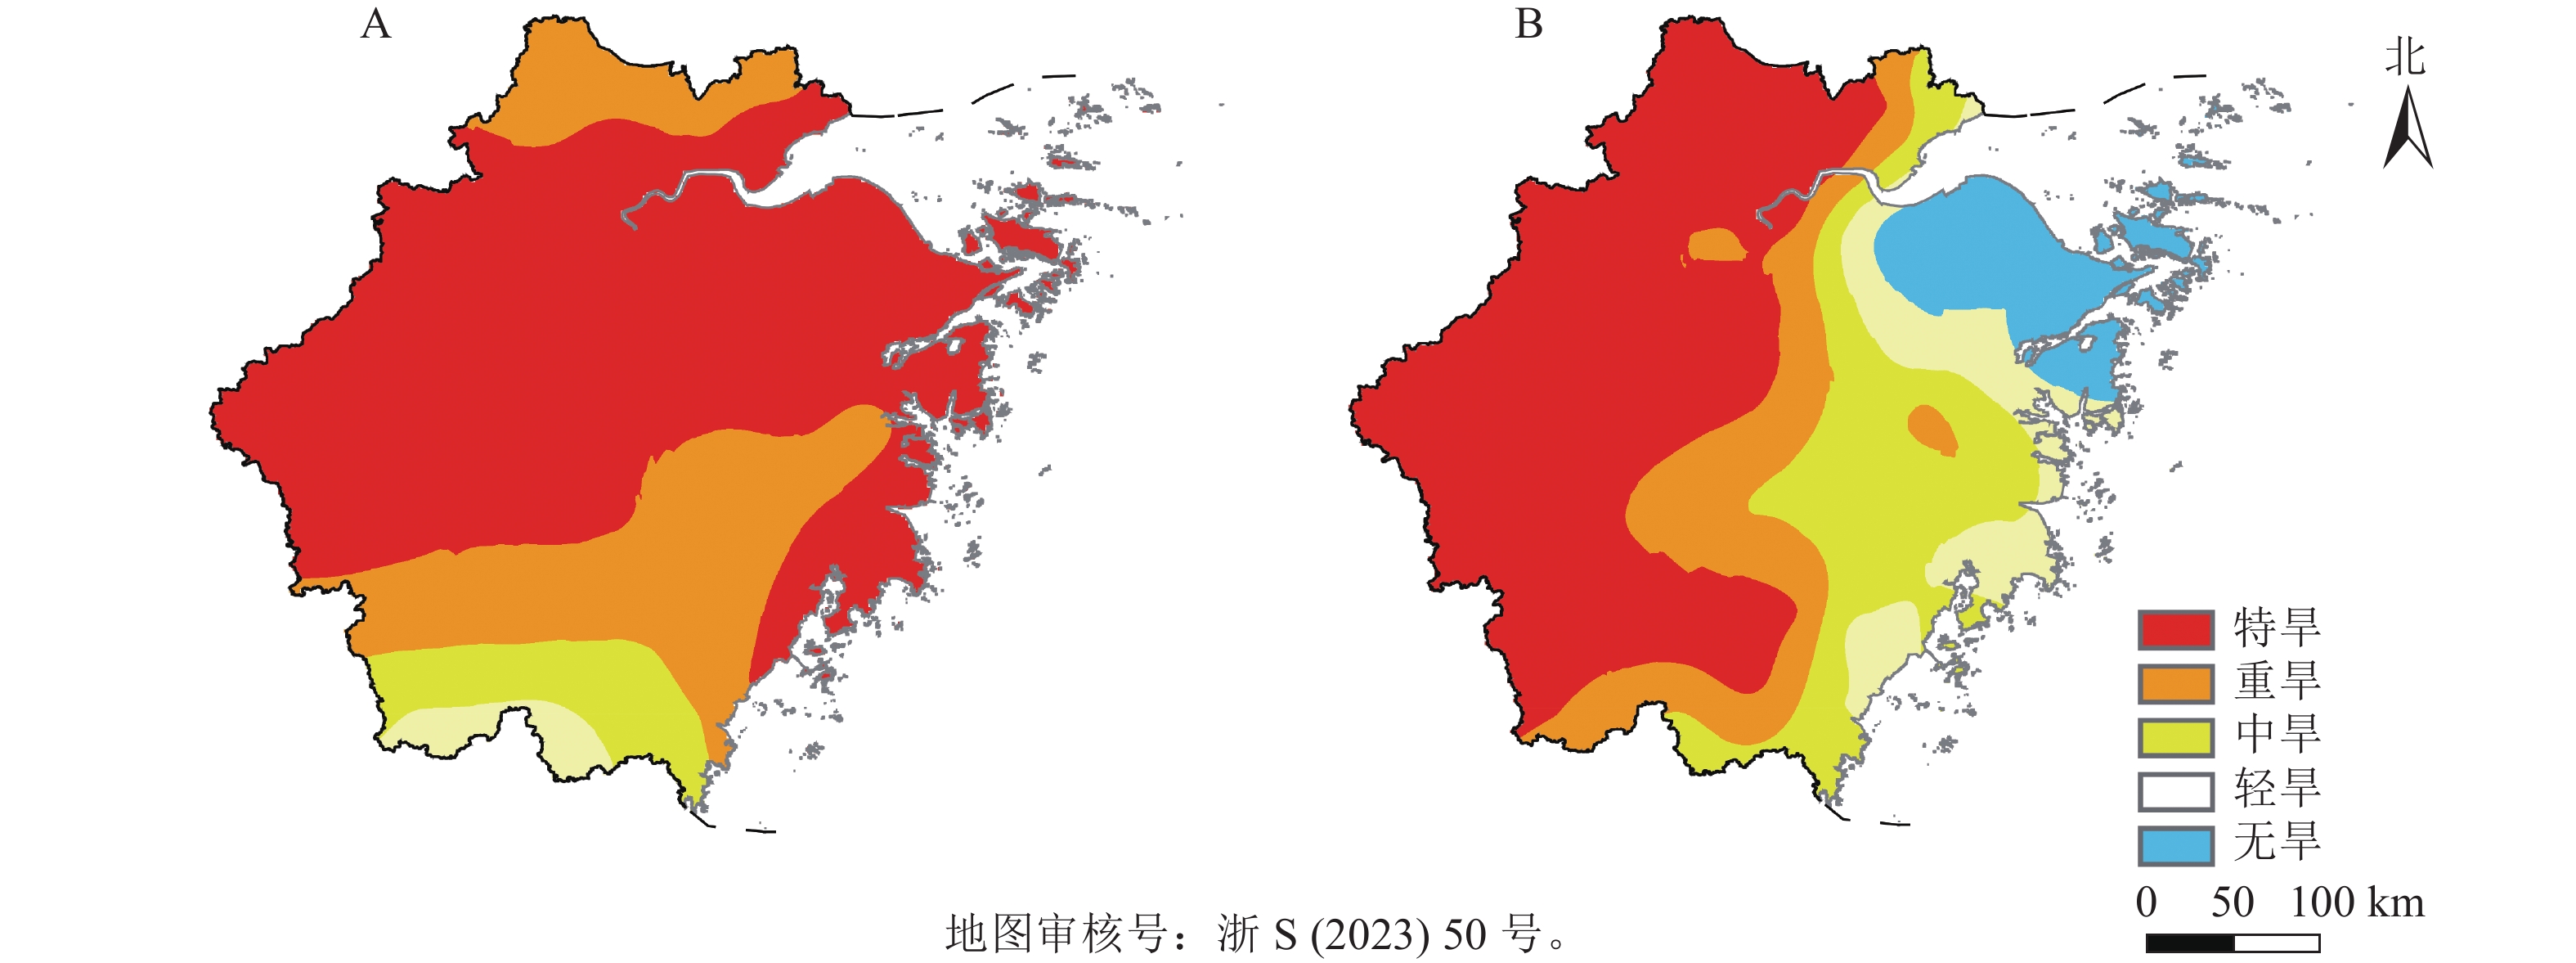
    • 运用相对湿润指数分别监测2013年夏季(7月1日至8月18日)和2019年秋季(2019年9月8日至11月18日) 2次发生在浙江省的茶叶干旱事件。如图8A所示:2013年夏季全省绝大部分地区出现了气象干旱,其中杭州、宁波、绍兴、金华和衢州地区都达到了重旱的级别。根据农业部门统计,全省茶园受灾面积达18.3万hm2,杭州、宁波等地的的茶园受灾比例高达95%以上,绍兴等地受灾比例为80%,实际受灾区域和强度与本研究的计算结果基本一致。根据图8B,2019年秋季全省大部分地区出现气象干旱,其中湖州、杭州、衢州和丽水都出现了重旱及以上级别的旱情,无论是干旱强度还是范围也都与农业部门所监测到的茶叶旱情相一致。由此可见,相对湿润指数能够较好地适用于茶叶干旱的研究。

      Figure 8.  Distribution of tea meteorological drought in Zhejiang in summer 2013 (A) and autumn 2019 (B)

    • 浙江省主要由浙北的杭嘉湖平原、浙中金衢盆地和浙南山区组成,各区域之间的地形地貌和气候条件都存在明显差异,干旱的发生规律及茶叶对干旱的敏感程度也有所不同。比如2022年浙江遭遇了历史罕见的夏秋连季高温干旱灾害,全省的茶叶也出现了不同程度的受灾情况,其中浙北杭州、湖州等地的茶园受灾相对较轻,而浙中金衢盆地作为此次高温干旱中心,茶叶生产受灾情况极其严重,其中浙中金华武义县的茶园受灾面积为全省之最。2022年干旱天气所造成的茶叶受灾情况与本研究结论基本一致。本研究所利用的相对湿润指数过去主要用于监测年、季尺度干旱状况[15, 17]和分析水稻Oryza sativa等大田作物的干旱情况[1314],并取得了良好的效果。本研究首次基于相对湿润指数从降水和茶树水分蒸散的角度定量分析了浙江省茶叶夏秋两季气象干旱的时空分布特征,发现相对湿润指数变化与近年来浙江省典型干旱过程具有较好一致性,但本研究用来验证的典型干旱个例较少,后期将利用浙江省历年茶叶干旱灾情数据,对全省茶叶干旱灾害作更全面分析。此外,目前卫星遥感技术的发展也改变了基于传统气象站点的灾害监测方法[26],使得在更大范围和更高频次上监测干旱及相关变量成为可能,且实际生产中茶叶干旱还受到土壤、植被、地形地貌、灌溉条件和社会经济发展水平等诸多因素的影响[12]。今后将结合卫星遥感与气象站点数据,同时加入土壤等自然地理环境以及各地致灾因子、孕灾环境和防灾减灾能力等因素,对茶叶气象干旱的监测预警和防灾减灾能力进行更有针对性的研究,减少气象干旱对茶叶生产带来的损失。

    • 浙江省茶叶夏季干旱平均站次比为33.7%,呈逐年下降的趋势,但2000年以后发生极端大范围干旱的年份增多。全省茶叶夏季干旱强度的分布呈现西强东弱的态势,中西部在夏季发生的茶叶干旱强度较高,强度明显高于其他地区,而且该区域出现茶叶气象干旱的频率在40%以上。沿海地区干旱强度较弱,发生茶叶干旱的频率低于20%。

      茶叶秋季干旱的强度和频率都弱于夏季,干旱平均站次比为22.6%,2000年以前呈上升趋势,2000年以后呈下降趋势。干旱强度呈现西强东弱的分布,干旱高发区在金衢盆地以及嘉兴和湖州部分区域,干旱频率为20%~40%。沿海地区干旱强度较弱,干旱频率在20%以下,干旱对茶叶的影响相对有限。

      根据EOF分析,浙江省茶叶夏季干旱主要分解为2个模态:第一模态反映全省干旱强度变化趋势整体一致性,即浙江全省茶叶气象干旱普遍较重或较轻,但西部和北部地区的变化更为明显;第二模态反映全省干旱西北—东南反相位分布的特征。秋季茶叶干旱主要分解为2个模态,第一模态反映全省干旱具有一致性分布,但东南地区干旱强度的变化比西北更明显,第二模态反映宁波和舟山与全省其他地区呈现反相位的空间分布特征。根据小波变换分析,浙江省茶叶夏季和秋季干旱存在强弱交替出现的变化特征,其中夏季具有显著的2~6 a的振荡周期,秋季具有显著的2~4和6~10 a的振荡周期。

Reference (26)

Catalog

    /

    DownLoad:  Full-Size Img  PowerPoint
    Return
    Return