Turn off MathJax
Article Contents

CAO Haoyang, DU Apeng, XU Yuxing, ZHU Wankuan, HUANG Runxia, LIU Yusheng, WANG Zhichao. Age effect on biomass distribution pattern and optimization of allometric growth equation in Eucalyptus urophylla×E. grandis plantations[J]. Journal of Zhejiang A&F University. doi: 10.11833/j.issn.2095-0756.20240180
Citation: CAO Haoyang, DU Apeng, XU Yuxing, ZHU Wankuan, HUANG Runxia, LIU Yusheng, WANG Zhichao. Age effect on biomass distribution pattern and optimization of allometric growth equation in Eucalyptus urophylla×E. grandis plantations[J]. Journal of Zhejiang A&F University. doi: 10.11833/j.issn.2095-0756.20240180

OnlineFirst articles are published online before they appear in a regular issue of the journal. Please find and download the full texts via CNKI.

Age effect on biomass distribution pattern and optimization of allometric growth equation in Eucalyptus urophylla×E. grandis plantations

doi: 10.11833/j.issn.2095-0756.20240180
  • Received Date: 2024-02-14
  • Accepted Date: 2024-05-28
  • Rev Recd Date: 2024-05-26
  •   Objective  This study aims to analyze the biomass distribution pattern of Eucalyptus plantations at different ages, so as to provide theoretical basis and data support for accurate assessment of carbon storage and carbon sink in China’s Eucalyptus industry.  Method  Eucalyptus urophylla×E. grandis plantation in Leizhou Peninsula was taken as the research object. The whole-plant harvesting method was used to measure the biomass of various organs in 57 trees aged 1, 2, 3, 6 and 10. Using diameter at breast height (DBH), height (H), and diameter at breast height-tree height (DBH 2 H and DBHH) as independent variables, allometric growth models for organ biomass, aboveground biomass, and total biomass without and with age variables were established, respectively, to screen for the optimal model.   Result  The biomass of different parts of E. urophylla×E. grandis increased with age, but the proportion of each organ to the total biomass varied with age. The proportion of stem biomass increased with age, from 45.21% at 1 year old to 68.25% at 10 years old, whereas the proportion of branch and leaf biomass decreased with forest age, from 19.43% and 16.31% at 1 year old to 10.51% and 2.91% at 10 years old , respectively. The proportion of root biomass first increased from 19.05% at 1 year old to 25.21% at 3 years old, and then gradually decreased to 18.33% at 10 years old. The root to shoot ratio of E. urophylla×E. grandis ranged from 0.16 to 0.39. In selecting the optimal model for biomass of various organs, the model with DBH as the independent variable (without age variable) had better predictions for root biomass and total biomass than other models. The model with DBH 2 H plus age as independent variables had the best predictions for leaf biomass and aboveground biomass. The model with DBH, H, and age as independent variables had the best predictions for branch biomass. Regarding the prediction accuracy for stem biomass, there was no significant difference between the prediction models with DBHH and DBH 2 H plus age as independent variables, and both models could predict stem biomass well.   Conclusion  Forest age has significant impacts on the biomass allocation ratio of various organs in E. urophylla×E. grandis plantations. The prediction accuracy of branch, leaf, and aboveground biomass in E. urophylla×E. grandis plantations significantly improves if forest age is included in the allometric growth model. [Ch. 2 fig. 4 tab. 45 ref.]
  • [1] WANG Zhichao, XU Yuxing, ZHU Wankuan, DU Apeng.  Difference in water use sources of Eucalyptus urophylla×E. grandis plantation in the Leizhou Peninsula during dry and rainy seasons . Journal of Zhejiang A&F University, doi: 10.11833/j.issn.2095-0756.20220481
    [2] CHENG Haotian, KONG Tao, LÜ Gang, WANG Dongli, ZHANG Lili.  Ecological stoichiometric characteristics of rhizosphere and non-rhizosphere soil of Pinus sylvestris var. mongolica plantations at different ages . Journal of Zhejiang A&F University, doi: 10.11833/j.issn.2095-0756.20210211
    [3] YUAN Ya’nan, LI Zhengcai, WANG Bin, ZHANG Yujie, HUANG Shengyi.  Stoichiometric characteristics of soil C, N and P in Torreya grandis stands of different ages . Journal of Zhejiang A&F University, doi: 10.11833/j.issn.2095-0756.20200761
    [4] WANG Jiajia, ZHANG Mingru, YI Lita, ZHANG Rumin, HE Yunhe.  Effects of light and nitrogen on clonal reproduction characteristics and biomass allocation of Dicranopteris dichotoma . Journal of Zhejiang A&F University, doi: 10.11833/j.issn.2095-0756.20200199
    [5] LAN Jie, XIAO Zhongqi, LI Jimei, ZHANG Yutao.  Biomass allocation and allometric growth of Picea schrenkiana in Tianshan Mountains . Journal of Zhejiang A&F University, doi: 10.11833/j.issn.2095-0756.20190384
    [6] LIANG Yang, SHAO Sen, MA Bingqian.  Soil quality development in Pinus tabuliformis plantations with different forest ages on Taiyue Mountain . Journal of Zhejiang A&F University, doi: 10.11833/j.issn.2095-0756.2019.03.020
    [7] ZHANG Zhen, JIN Guoqing, ZHOU Zhichun, SUN Linshan.  Biomass allocation differences with Pinus massoniana in Guangdong and Hubei provenances . Journal of Zhejiang A&F University, doi: 10.11833/j.issn.2095-0756.2019.02.008
    [8] WANG Zhichao, ZHU Wankuan, DU Apeng.  Variation in stem sap flow of Eucalyptus urophylla×E. grandis during rainy and dry seasons . Journal of Zhejiang A&F University, doi: 10.11833/j.issn.2095-0756.2017.02.016
    [9] CHAO Lin, HONG Tao, LI Jian, CHEN Can, HONG Wei, WU Chengzhen.  Intraspecific competition in a Cunninghamia lanceolata plantation with different age and diameter classes . Journal of Zhejiang A&F University, doi: 10.11833/j.issn.2095-0756.2015.03.004
    [10] WANG Jinliang, CHENG Pengfei, XU Shen, WANG Xiaohua, CHENG Feng.  Forest biomass estimation in Shangri-La based on the remote sensing . Journal of Zhejiang A&F University, doi: 10.11833/j.issn.2095-0756.2013.03.003
    [11] XIE Anqiang, HONG Wei, WU Chengzhen.  Phosphorus absorption with ten fungi inoculants in Eucalyptus urophylla × Eucalyptus grandis . Journal of Zhejiang A&F University, doi: 10.11833/j.issn.2095-0756.2013.06.010
    [12] YU Bao, ZHANG Qiu-liang, WANG Li-ming, WU Jisiguleng.  Characteristics of biomass and productivity in Larix gmelinii natural forests with different stand structures . Journal of Zhejiang A&F University, doi: 10.11833/j.issn.2095-0756.2011.01.009
    [13] HAO Jian, CHEN Hou-rong, WANG Ling-hui, QIN Wu-ming, ZENG Ji, ZHANG Ming-hui.  Physiological responses of four crops in aqueous extracts of soil from Eucalyptus urophylla × Eucalyptus grandis forests . Journal of Zhejiang A&F University, doi: 10.11833/j.issn.2095-0756.2011.05.024
    [14] YANG Qian-yu, XIE Jin-zhong, ZHANG Wei, LIN Zhen-qing.  Biomass models for Bambusa textilis var. tasca . Journal of Zhejiang A&F University, doi: 10.11833/j.issn.2095-0756.2011.03.027
    [15] LI Yan-yan, FAN Hou-bao, LIN De-xi, SU Bing-qiang, LIU Chun-hua, SUN Xin.  Biomass and distribution of stands mixed Pinus massoniana with broad leaved species . Journal of Zhejiang A&F University,
    [16] LIN Xin-chun, FANG Wei, YU Jian-xin, YU Xue-jun, HU Chao-zong, ZHOU Lin.  Biomass models of organs of Pleioblastus amarus . Journal of Zhejiang A&F University,
    [17] ZHOU Yong-xue, FAN Jun-feng, YANG Pei-hua, GAO Jian-he, LIU Yong-hong.  Comparative studies on growth and biomass of one-year-old seedlings of Pinus nigra var. austriaca and Pinus tabuleaformis . Journal of Zhejiang A&F University,
    [18] XIE Jin-sheng, HUANG Rong-zhen, CHEN Yin-xiu, YANG Yu-sheng, WANG Wei-ming.  Change of biomass and productivity of Pinus massoniana community after closing of hillsides and management in serious eroded red soil . Journal of Zhejiang A&F University,
    [19] He Dongbei, Luo Qibang, Zeng Weisheng.  Study on linear simultaneous model of tree biomass . Journal of Zhejiang A&F University,
    [20] Xu Youming, Lin Han, WanFuhong.  Variation of Pulpwood Characteristics and Cutting Age of Masson Pine . Journal of Zhejiang A&F University,
  • [1]
    GUO Zexin, CAO Cong, LIU Ping. Construction of biomass models of Cunninghamia lanceolata plantation based on continuous forest inventory in Guangdong [J]. Journal of Central South University of Forestry &Technology, 2022, 42(8): 78 − 89.
    [2]
    ZHOU Hao, Yeerjiang Baiketuerhan, HE Huaijiang, et al. Biomass distribution characteristics and species-specific allometric equations for afforestation species in Northeast China [J]. Scientia Silvae Sinicae, 2023, 59(11): 23 − 32.
    [3]
    WANG Haijun, LI Feng, XIAO Nan. Allomteric equation fog biomass of the main carbon sink species in Heilongjiang Province [J]. Protection Forest Science and Technology, 2016(5): 21 − 22.
    [4]
    SOLTANI A. Mathematical Modeling in Field Crops [M]. Mashhad: JMD Press, 2009.
    [5]
    NIKLAS K J. Plant Allometry: the Scaling of Form and Process [M]. Chicago: University of Chicago Press, 1994.
    [6]
    SUN Han, WANG Xiaoping, FAN Dayong. Effects of climate, biotic factors, and phylogeny on allometric relationships: testing the metabolic scaling theory in plantations and natural forests across China [J/OL]. Forest Ecosystems, 2020, 7: 51[2024-01-14]. doi: 10.1186/s40663-020-00263-y.
    [7]
    CHEN Dongsheng, SUN Xiaomei, JIN Yingbo, et al. Effects of stand age and competition on allometric relationships for biomass partitioning in Larix kaempferi plantation [J]. Acta Ecologica Sinica, 2020, 40(3): 843 − 853.
    [8]
    DONG Dian, LIN Tianxi, TANG Jingyi, et al. Biomass allocation patterns and allometric models of Tilia amurensis [J]. Journal of Beijing Forestry University, 2014, 36(4): 54 − 63.
    [9]
    XUE Chunquan, XU Qihu, LIN Liping, et al. Biomass dynamic predicting for Schima superba in Guangdong based on allometric and theoretical growth equation [J]. Scientia Silvae Sinicae, 2019, 55(7): 86 − 94.
    [10]
    LAN Jie, XIAO Zhongqi, LI Jimei, et al. Biomass allocation and allometric growth of Picea schrenkiana in Tianshan Mountains [J]. Journal of Zhejiang A&F University, 2020, 37(3): 416 − 423.
    [11]
    LIU Kun, CAO Lin, WANG Guibin, et al. Biomass allocation patterns and allometric models of Ginkgo biloba [J]. Journal of Beijing Forestry University, 2017, 39(4): 12 − 20.
    [12]
    PICARD N, RUTISHAUSER E, PLOTON P, et al. Should tree biomass allometry be restricted to power models? [J]. Forest Ecology and Management, 2015, 353: 156 − 163.
    [13]
    DJOMO A N, CHIMI C D. Tree allometric equations for estimation of above, below and total biomass in a tropical moist forest: case study with application to remote sensing [J]. Forest Ecology and Management, 2017, 391: 184 − 193.
    [14]
    GOODMAN R C, PHILLIPS O L, BAKER T R. The importance of crown dimensions to improve tropical tree biomass estimates [J]. Ecological Applications, 2014, 24(4): 680 − 698.
    [15]
    SATOO T, MADGWICK H A I. Forest Biomass [M]. Boston: Martinus Nijhoff /Dr. W. Junk Publishers, 1982: 152.
    [16]
    HELMISAARI H, MAKKONEN K, KELLOMÄKI S, et al. Below- and above-ground biomass, production and nitrogen use in scots pine stands in eastern Finland [J]. Forest Ecology and Management, 2002, 165(1/3): 317 − 326.
    [17]
    National Forestry and Grassland Administration. China Forest Resources Report (2014−2018) [M]. Beijing: China Forestry Publishing House, 2019
    [18]
    YANG Zhong, ZHANG Jianping, WANG Daojie, et al. Preliminary study on the biomass of artificial Eucalyptus camaldulensis Dehnl forests in Arid-Hot Valleys, Yuanmou [J]. Journal of Mountain Science, 2001, 19(6): 503 − 510.
    [19]
    ZHANG Lili, WANG Zhichao, CHEN Shaoxiong, et al. Biomass allocation pattern of Eucalyptus urophylla×Eucalyptus grandis plantation at different ages [J]. Journal of Northwest A&F University (Natural Science Edition), 2017, 45(6): 61 − 68.
    [20]
    JIE Fan, DU Apeng, ZHU Wankuan. Allometry equations for estimating Eucalyptus tree biomass and comparison with IPCC method [J]. Eucalypt Science &Technology, 2019, 36(1): 1 − 8.
    [21]
    XU Yuxing, DU Apeng, WANG Zhichao, et al. Effects of different rotation periods of eucalyptus plantations on soil physiochemical properties, enzyme activities, microbial biomass and microbial community structure and diversity [J/OL]. Forest Ecology and Management, 2020, 456: 117683[2024-01-14]. doi: 10.1016/j.foreco.2019.117683.
    [22]
    WANG Zhichao, LIU Siru, XU Yuxing, et al. Differences in transpiration characteristics among Eucalyptus plantations of three species on the Leizhou Peninsula, Southern China [J/OL]. Forests, 2022, 13(10): 1544[2024-01-14]. doi: 10.3390/f13101544.
    [23]
    XIANG Wenhua, LI Linhua, OUYANG Shuai, et al. Effects of stand age on tree biomass partitioning and allometric equations in Chinese fir (Cunninghamia lanceolata) plantations [J]. European Journal of Forest Research, 2021, 140(2): 317 − 332.
    [24]
    AKAIKE H. A new look at the statistical model identification [J]. IEEE Transactions on Automatic Control, 1974, 19(6): 716 − 723.
    [25]
    MENSAH S, KAKAÏ R G, SEIFERT T. Patterns of biomass allocation between foliage and woody structure: the effects of tree size and specific functional traits [J]. Annals of Frest Research, 2016, 59(1): 49 − 60.
    [26]
    LIU Xuan, XIAO Sa, ZHU Peng, et al. Difference of biomass and understory vegetation diversity among different subtropical plantations in common gardens [J]. Journal of Zhejiang A&F University, 2022, 39(4): 717 − 726.
    [27]
    HOUGHTON R A, LAWRENCE K T, HACKLER J L, et al. The spatial distribution of forest biomass in the Brazilian Amazon: a comparison of estimates [J]. Golbal Change Biology, 2001, 7(7): 731 − 746.
    [28]
    SAATCHI S S, HOUGHTON R A, ALVALÁ R C D S, et al. Distribution of aboveground live biomass in the Amazon Basin [J]. Global Change Biology, 2007, 13(4): 816 − 837.
    [29]
    SAINT-ANDRÉ L, M BOU A T, MABIALA A, et al. Age-related equations for above- and below-ground biomass of a eucalyptus hybrid in Congo [J]. Forest Ecology and Management, 2005, 205(1): 199 − 214.
    [30]
    PEICHL M, ARAIN M A. Allometry and partitioning of above- and belowground tree biomass in an age-sequence of white pine forests [J]. Forest Ecology and Management, 2007, 253(1/3): 68 − 80.
    [31]
    SEO Y O, LEE Y J, LUMBRES R I C, et al. Influence of stand age class on biomass expansion factor and allometric equations for Pinus rigida plantations in South Korea [J]. Scandinavian Journal of Forest Research, 2013, 28(6): 566 − 573.
    [32]
    LIM H W, LEE K H, LEE K H, et al. Biomass expansion factors and allometric equations in an age sequence for Japanese cedar (Cryptomeria japonica) in Southern Korea [J]. Journal of Forest Research, 2013, 18(4): 316 − 322.
    [33]
    LI Hui, LI Chunyi, ZHA Tianshan, et al. Patterns of biomass allocation in an age-sequence of secondary Pinus bungeana forests in China [J]. The Forestry Chronicle, 2014, 90(2): 169 − 176.
    [34]
    FATEMI F R, YANAI R D, HAMBURG S P, et al. Allometric equations for young northern hardwoods: the importance of age-specific equations for estimating aboveground biomass [J]. Canadian Journal of Forest Research, 2011, 41(4): 881 − 891.
    [35]
    TOBIN B, NIEUWENHUIS M. Biomass expansion factors for Sitka spruce (Picea sitchensis (Bong. ) Carr. ) in Ireland [J]. European Journal of Forest Research, 2007, 126(2): 189 − 196.
    [36]
    ZIANIS D, MENCUCCINI M. On simplifying allometric analyses of forest biomass [J]. Forest Ecology and Management, 2004, 187(2/3): 311 − 332.
    [37]
    PILLI R, ANFODILLO T, CARRER M. Towards a functional and simplified allometry for estimating forest biomass [J]. Forest Ecology and Management, 2006, 237(1/3): 583 − 593.
    [38]
    VERÓNICA G, LUIS P P, GERARDO R. Allometric relations for biomass partitioning of Nothofagus antarctica trees of different crown classes over a site quality gradient [J]. Forest Ecology and Management, 2010, 259(6): 1118 − 1126.
    [39]
    MOROTE F A G, SERRANO F R L, ANDRÉS M, et al. Allometries, biomass stocks and biomass allocation in the thermophilic Spanish juniper woodlands of Southern Spain [J]. Forest Ecology and Management, 2012, 270: 85 − 93.
    [40]
    SINGNAR P, DAS M C, SILESHI G W, et al. Allometric scaling, biomass accumulation and carbon stocks in different aged stands of thin-walled bamboos Schizostachyum dullooa, Pseudostachyum polymorphum and Melocanna baccifera [J]. Forest Ecology and Management, 2017, 395: 81 − 91.
    [41]
    WAGNER R G, TER-MIKAELIAN M T. Comparison of biomass component equations for four species of northern coniferous tree seedlings [J]. Annals of Forest Science, 1999, 56(3): 193 − 199.
    [42]
    XIAO Chunwang, CEULEMANS R. Allometric relationships for below- and aboveground biomass of young scots pines [J]. Forest Ecology and Management, 2004, 203(1/3): 177 − 186.
    [43]
    CIENCIALA E, ČERNÝ M, TATARINOV F, et al. Biomass functions applicable to scots pine [J]. Trees, 2006, 20(4): 483 − 495.
    [44]
    JENKINS J C, CHOJNACKY D C, HEALTH L S, et al. National scale biomass estimators for United States tree species [J]. Forest Science, 2003, 49(1): 12 − 35.
    [45]
    BOND-LAMBERTY B, WANG C, GOWER S T. Aboveground and belowground biomass and sapwood area allometric equations for six boreal tree species of northern Manitoba [J]. Canadian Journal of Forest Research, 2002, 32(8): 1441 − 1450.
  • 加载中
通讯作者: 陈斌, bchen63@163.com
  • 1. 

    沈阳化工大学材料科学与工程学院 沈阳 110142

  1. 本站搜索
  2. 百度学术搜索
  3. 万方数据库搜索
  4. CNKI搜索

Figures(2)  / Tables(4)

Article views(32) PDF downloads(1) Cited by()

Related
Proportional views

Age effect on biomass distribution pattern and optimization of allometric growth equation in Eucalyptus urophylla×E. grandis plantations

doi: 10.11833/j.issn.2095-0756.20240180

Abstract:   Objective  This study aims to analyze the biomass distribution pattern of Eucalyptus plantations at different ages, so as to provide theoretical basis and data support for accurate assessment of carbon storage and carbon sink in China’s Eucalyptus industry.  Method  Eucalyptus urophylla×E. grandis plantation in Leizhou Peninsula was taken as the research object. The whole-plant harvesting method was used to measure the biomass of various organs in 57 trees aged 1, 2, 3, 6 and 10. Using diameter at breast height (DBH), height (H), and diameter at breast height-tree height (DBH 2 H and DBHH) as independent variables, allometric growth models for organ biomass, aboveground biomass, and total biomass without and with age variables were established, respectively, to screen for the optimal model.   Result  The biomass of different parts of E. urophylla×E. grandis increased with age, but the proportion of each organ to the total biomass varied with age. The proportion of stem biomass increased with age, from 45.21% at 1 year old to 68.25% at 10 years old, whereas the proportion of branch and leaf biomass decreased with forest age, from 19.43% and 16.31% at 1 year old to 10.51% and 2.91% at 10 years old , respectively. The proportion of root biomass first increased from 19.05% at 1 year old to 25.21% at 3 years old, and then gradually decreased to 18.33% at 10 years old. The root to shoot ratio of E. urophylla×E. grandis ranged from 0.16 to 0.39. In selecting the optimal model for biomass of various organs, the model with DBH as the independent variable (without age variable) had better predictions for root biomass and total biomass than other models. The model with DBH 2 H plus age as independent variables had the best predictions for leaf biomass and aboveground biomass. The model with DBH, H, and age as independent variables had the best predictions for branch biomass. Regarding the prediction accuracy for stem biomass, there was no significant difference between the prediction models with DBHH and DBH 2 H plus age as independent variables, and both models could predict stem biomass well.   Conclusion  Forest age has significant impacts on the biomass allocation ratio of various organs in E. urophylla×E. grandis plantations. The prediction accuracy of branch, leaf, and aboveground biomass in E. urophylla×E. grandis plantations significantly improves if forest age is included in the allometric growth model. [Ch. 2 fig. 4 tab. 45 ref.]

CAO Haoyang, DU Apeng, XU Yuxing, ZHU Wankuan, HUANG Runxia, LIU Yusheng, WANG Zhichao. Age effect on biomass distribution pattern and optimization of allometric growth equation in Eucalyptus urophylla×E. grandis plantations[J]. Journal of Zhejiang A&F University. doi: 10.11833/j.issn.2095-0756.20240180
Citation: CAO Haoyang, DU Apeng, XU Yuxing, ZHU Wankuan, HUANG Runxia, LIU Yusheng, WANG Zhichao. Age effect on biomass distribution pattern and optimization of allometric growth equation in Eucalyptus urophylla×E. grandis plantations[J]. Journal of Zhejiang A&F University. doi: 10.11833/j.issn.2095-0756.20240180
  • 森林生物量是森林碳储量的主要载体,约占陆地碳库的45%和全球碳库的31%,在维系陆地碳循环和稳定全球气候方面发挥着主导作用,因此准确估算乔木和林分生物量对于评估森林生态系统碳储量、碳汇及生态系统服务功能至关重要[1]。异速生长方程是将林木的胸径(DBH)和树高(H)等易测因子转换为林分生物量的常用方法[23]。该方法结构简单、精确度高并且可以获得树木各器官生物量的分配规律,已被广泛应用于树木生物量的估算[45]。树木的异速生长关系受树种、林龄、竞争关系、立地条件以及气候等因素的综合影响[67],如何研发高精度的异速生长方程一直是国内外学者研究的重点。

    以往的研究大多采用幂函数且多利用DBH作为预测变量,建立异速生长方程估算树木生物量[3, 811]。有研究认为:树木的高径比更能反映树木的形状,因此将H作为额外的预测变量来建立异速生长方程,这比仅基于DBH建立的异速生长方程的预测精度要高[12]。还有研究发现:树冠直径可以作为树木生物量的预测变量,且树冠直径的加入可改善生物量的预测精度[1314]。此外,树木的异速生长关系并非静态。随着林分的生长,微立地条件(如光照和土壤养分)以及单株树木之间相互作用关系都会发生巨大变化,这将导致树木的树形、树冠结构和根系特征发生变化,进而导致各组分生物量分配比例及其异速生长关系发生变化[7]。因此,采用没有考虑林龄的特定异速生长方程参数估算各组分生物量时可能出现较大误差[1516]。总之,在异速生长关系的众多影响因素中,选择最优参数组合作为预测变量来建立异速生长方程,是提高异速生长方程预测精度的核心。

    桉树Eucalyptus是中国南方重要的速生丰产林树种之一,种植面积已达546万hm2[17],其巨大的林分生产力和碳汇功能,关系着中国的木材供给安全和碳收支平衡,因此对桉树人工林生物量的精确估算意义重大。以往很多研究已对中国桉树人工林建立了异速生长方程,如杨忠等[18]对元谋干热河谷桉树人工林的研究发现:幂函数可较真实地反映桉树生物量随DBHH的变化趋势;张利丽等[19]建立了仅使用DBH的雷州半岛尾巨桉Eucalyptus urophylla×E. grandis人工林生物量各器官的异速生长模型;揭凡等[20]基于已发布文献数据,建立了桉树人工林地上部分和地下部分生物量异速生长模型。这些异速生长方程的研究大部分未加入林龄因素,也不清楚桉树的哪些生长指标受到林龄的显著影响,这限制了对中国桉树人工林碳储量及其固碳潜力的精确估算。为此,本研究以中国种植面积最大的尾巨桉为研究对象,采用整株收获法,测定1、2、3、6、10年生的57株尾巨桉各器官的生物量,分析其生物量分配格局随林龄的变化特征,并基于HDBH和林龄建立了各器官不同的异速生长模型,探讨不同异速生长模型的预测精度差异,确定加入林龄后预测精度显著提高的异速生长模型。研究结果可为桉树异速生长模型的优化提供参考,并为中国桉树产业碳储量及碳汇精准评估提供理论依据和数据支持。

    • 试验地设置于广东湛江桉树人工林生态系统国家定位观测研究站内(21°16′N,110°05′E)。海拔为80~220 m。根据1980—2020年的长期气象记录,该地属南亚热带海洋性季风气候,年平均降水量为1 760.9 mm,其中77%~85%出现在雨季(5—10月)。年平均气温为23.1 ℃。最低气温为1.4 ℃,出现在1月;最高气温为38.1 ℃,出现在7月,年相对湿度为80.4%[21]。根据世界土壤资源参考基准,该地区土壤属于由玄武岩风化沉积物发育的暗红湿润铁铝土,土壤呈酸性,0~80 cm土层土壤的平均pH为4.9[22]

    • 本研究选取的5个林龄(1、2、3、6和 10 a)的尾巨桉人工林均为平地造林,造林无性系为 DH32-29,造林方式均为挖穴造林,造林密度均为1 666株·hm−2。任意2块林分间直线距离均小于1 km,立地差异小,且经营方式完全相同。在每个林龄的尾巨桉人工林中分别建立3个20 m×20 m的正方形样地。对每个样地进行每木检尺,记录胸径(DBH)和树高(H),按径阶选取样树,其中1、2年生采用1 cm整化,3年生采用2 cm整化,6、10年生采用3 cm整化 (表1)。整株收割,测量其生物量。

      林分年
      龄/a
      平均胸
      径/cm
      平均树
      高/m
      径阶范
      围/cm
      样本
      数量
      活立木密度/
      (株·hm−2)
      林分年
      龄/a
      平均胸
      径/cm
      平均树
      高/m
      径阶范
      围/cm
      样本
      数量
      活立木密度/
      (株·hm−2)
      14.92±0.925.27±0.903.00~4.0031 666310.95±1.7912.51±0.877.00~9.0031 616
      4.00~5.0039.00~11.003
      5.00~6.00311.00~13.003
      6.00~7.003612.62±2.8016.09±1.958.00~11.0031 449
      28.71±1.3711.81±1.385.00~6.0031 61611.00~14.003
      6.00~7.00314.00~17.003
      7.00~8.0031022.35±2.8920.71±2.6818.00~21.0031 366
      8.00~9.00321.00~24.003
      9.00~10.00324.00~27.003
      10.00~11.003
        说明:径阶数值采用上限排除法,平均胸径与平均树高的表示形式为平均值±标准差。

      Table 1.  Basic informations of sample woods

    • 用油锯砍伐尾巨桉样树,测量树高、冠幅、胸径和枝下高。在测定干全长的同时,将干按照2 m规格分成若干木段(在1.3~2.0 m处额外增加1段),在每个区分段底直径的位置截取圆盘,所余不足2 m长度的干为梢头木,在梢头木底直径的位置也截取圆盘,称取全部木段与圆盘质量,作为干鲜质量。将枝从每个木段上分离,并将叶从枝上完全分离,在原地分别称取枝及叶鲜质量。在1株树中均匀收集圆盘、叶和枝的样本各50 g,送至实验室。

      根生物量的测量采用人工挖掘法。首先挖掘树桩,后挖掘其余的根系,并尽可能挖掘至根尖。清理粘附在根上的泥土,并在原地称其鲜质量。称量后收集树桩与根的样本50 g,送至实验室。

      将干、枝、叶、树桩和根的样本在恒温干燥箱中以85 ℃烘烤至恒量,计算各部分的含水量。树木各器官干质量均利用含水量由鲜质量换算。地上生物量为干、枝、叶生物量之和;根生物量为树桩与根生物量之和。将其相加得到单株树木总生物量,并计算出各林龄树木不同器官及整株平均生物量。

    • 分别计算每个林龄尾巨桉各器官生物量的平均值、各器官生物量占总生物量的百分比,及根生物量与地上部分生物量、叶生物量与干生物量、枝生物量与干生物量的比值,并研究其变化与林龄变化之间关系。绘制树木各器官生物量与地上部分生物量的关系。

      本研究参考XIANG等[23]的异速生长模型,将所有变量经过自然对数转换后(确保各变量之间的线性关系并使其满足异方差的要求),采用单独的胸径 (DBH)、单独的树高(H)、胸径和树高的组合(DBH 2 H),以及胸径(DBH)和树高(H)同时作为预测变量4种模型形式来建立不包含林龄的各器官异速生长模型1~24。另外,又将林龄作为补充变量引入上述4种模型形式,同时考虑林龄的个体效应及其与其他预测变量(即DBHHDBH 2 H)间的交互效应,建立包含林龄的各器官异速生长模型25~48,以验证引入林龄是否可以提升模型对生物量预测的准确性。

      在以前的研究中,只有使用最广泛的2个方程,即DBH模型和DBH 2 H模型有加入林龄的拟合研究。在本研究中则对上述所有方程均加入了林龄作为拟合变量,且同时选取每个树木器官的包含了林龄的最佳拟合方程。另外,由于对生物量进行对数转换会对回归估计带来偏差,因此,将用于预测的模型反向转换时需要计算矫正因子(FC)进行偏差矫正[11]

      本研究采用R-3.6.3的nlme包对模型进行拟合,并估计截距、斜率和树木各器官生物量与预测变量的固定效应之间的关系。

    • 对于拟合的结果,计算赤池信息准则(CAI)[24]和残差标准误(ERS),以确定模型的适用性。同时,为了比较各模型的拟合优度,随机选取70%的数据进行模型拟合,另外30%用于验证模型拟合能力。将验证集中使用模型计算的预测值与树木生物量的实测值进行对比,利用调整决定系数($ {{R}}_{\text{adj}}^{\text{2}} $)和平均预测误差(EMP)估计模型拟合优度。

      本研究利用R-3.6.3进行数据分析,利用Origin 2022绘图。
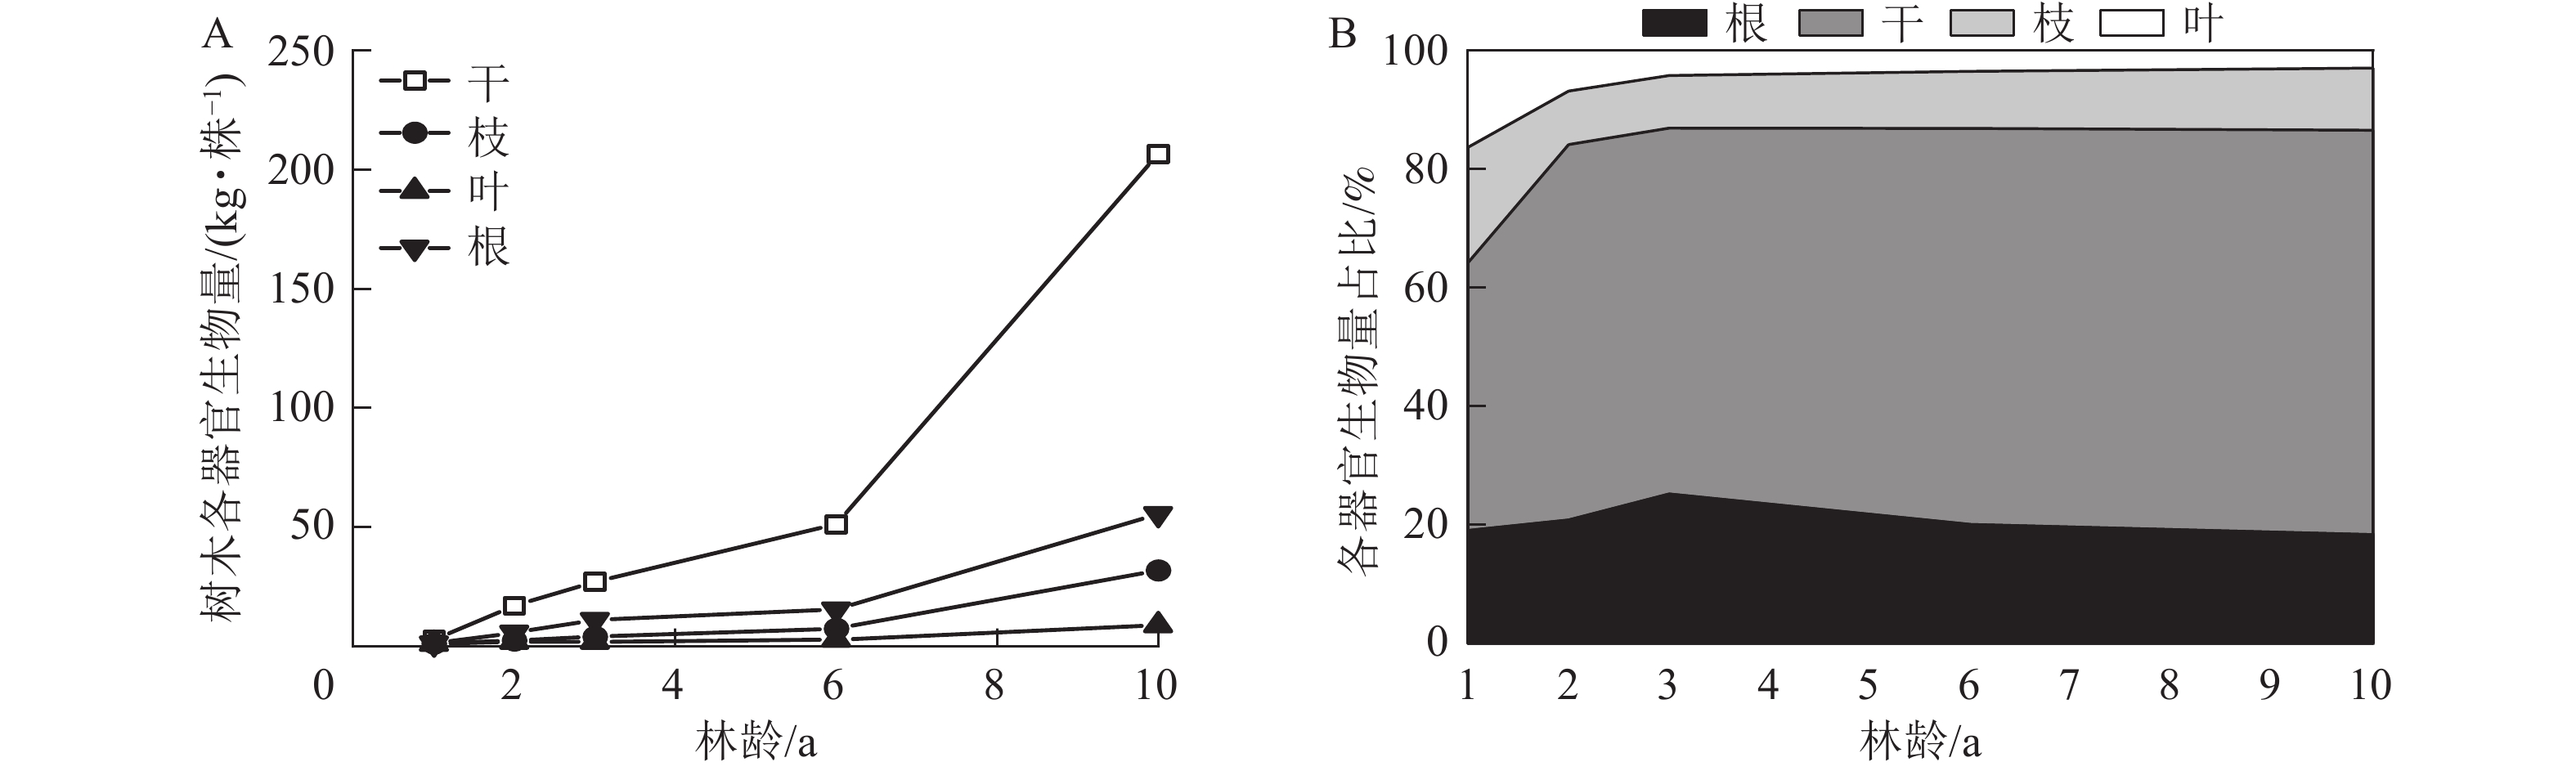
    • 图1A可知:尾巨桉各器官平均单株生物量随林龄增长而增加,其中干生物量由1年生的2.62 kg·株−1增长至10年生的206.67 kg·株−1;枝生物量由1年生的1.13 kg·株−1增长至10年生的31.81 kg·株−1;叶生物量由1年生的0.95 kg·株−1增加至10年生的8.81 kg·株−1;根生物量由1年生的1.10 kg·株−1增加至10年生的55.52 kg·株−1。在所有林龄中,干生物量均最大,其在总生物量中的占比随林龄增加而增加,从1年生的45.21%增加至10年生的68.25%,叶生物量及枝生物量均随林龄的增加而呈下降趋势,其中叶生物量占比由1年生的16.31%下降至10年生的2.91%,枝生物量占比由1年生的19.43%下降至10年生的10.51%。根生物量随年龄的变化则呈相对稳定趋势,自19.05%上升至25.21%后,又回落至18.33%(图1B)。

      Figure 1.  Patterns of biomass allocation in E. urophylla×E. grandis at different stand ages

      各器官生物量与地上生物量呈现出显著的线性关系(图2),其中干生物量的回归斜率最高,为0.849,决定系数(R2)为0.998;叶生物量的回归斜率最低,为0.030,R2为0.900;枝和根生物量的回归斜率分别为0.121和0.208,R2分别为0.923和0.884。这说明随着地上生物量的增加,各器官生物量的增长率不同,从大到小依次为干、根、枝、叶。由表2可见:根生物量与地上生物量的比值(根冠比)在各林龄间的平均值由0.235增加至0.337,后下降至0.225,总体趋势平稳。多重比较后发现:1、2、6、10年生林龄间根冠比数值无显著差异,所有林龄根冠比平均值为0.26。枝生物量与干生物量的比在2年生之前下降,此后维持在0.14左右。叶生物量与干生物量比在1~2年生时急剧下降,由0.361降至0.107,在3~10年生时略微下降(0.043~0.068)。

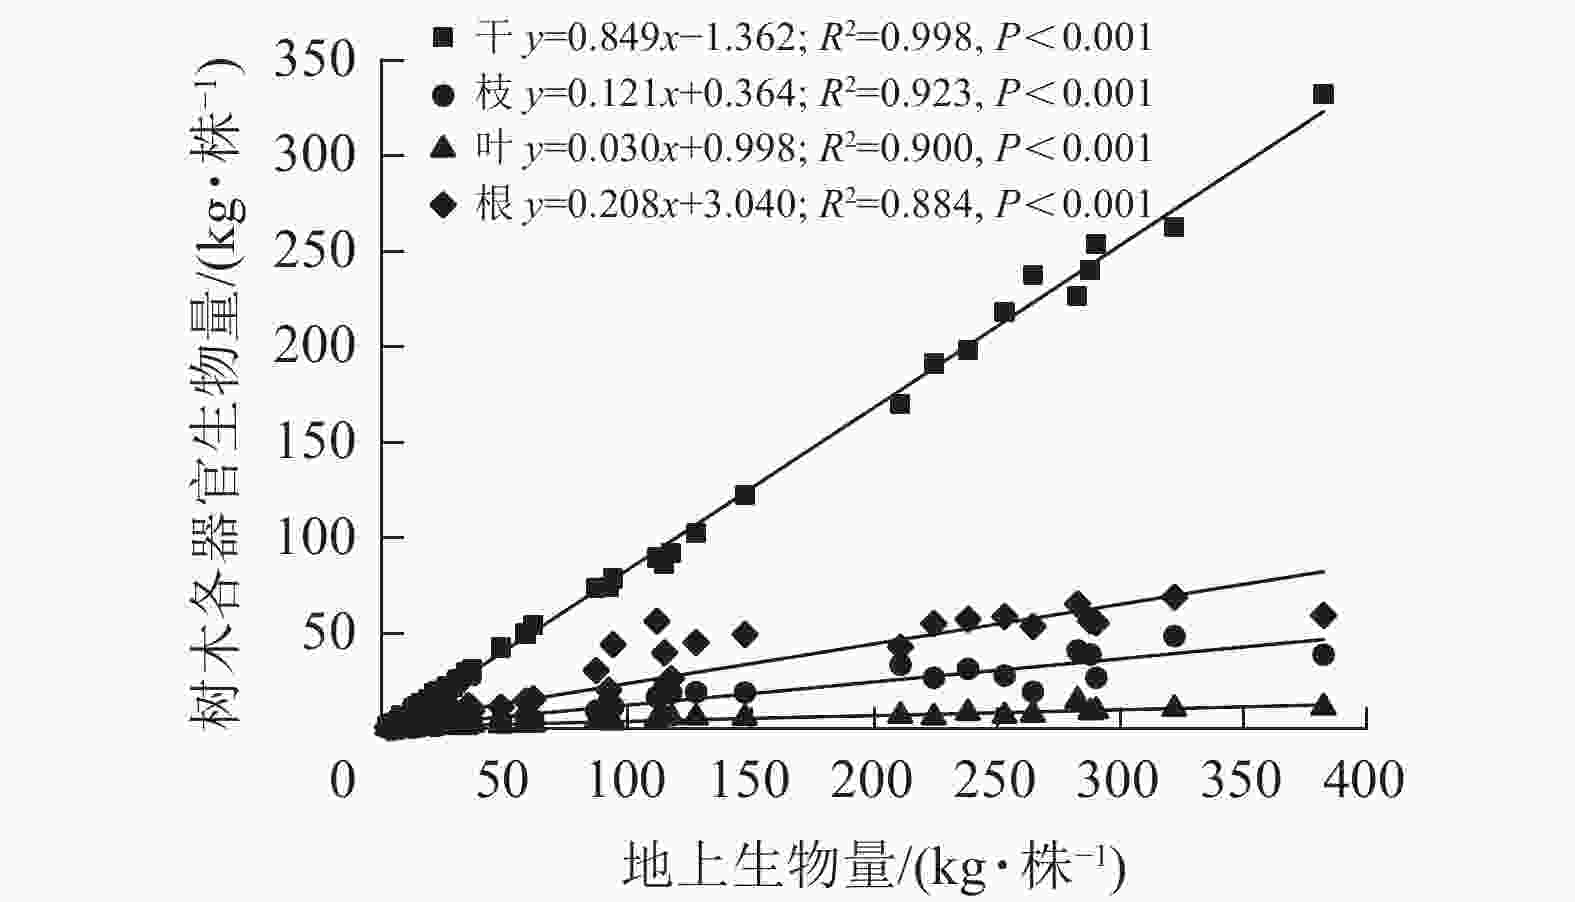
      Figure 2.  Fitting of individual tree biomass of various organs of E. urophylla×E. grandis with aboveground biomass.

      林龄/a根生物量/地上生物量枝生物量/干生物量叶生物量/干生物量林龄/a根生物量/地上生物量枝生物量/干生物量叶生物量/干生物量
      10.2350.4300.36160.2510.1440.052
      20.2630.1430.107100.2250.1540.043
      30.3370.1440.068

      Table 2.  Changes in single-tree biomass ratios among various organs of E. urophylla×E. grandis with stand age

    • 对尾巨桉各器官(根、枝、干、叶)地上生物量及总生物量进行回归分析,共建立24个不含林龄的尾巨桉生物量异速生长模型(表3)。依据$ {{R}}_{\text{adj}}^{\text{2}} $、EMPCAI对模型拟合效果进行评价。评价结果表明:干生物量最优模型为模型4 (DBHH模型),$ {{R}}_{\text{adj}}^{\text{2}} $=0.992, EMP=6.532%;枝生物量最优模型为模型8 (DBHH模型),$ {{R}}_{\text{adj}}^{\text{2}} $=0.880, EMP=4.654%;叶生物量最佳模型为模型12 (DBHH模型),$ {{R}}_{\text{adj}}^{\text{2}} $=0.684, EMP=3.131%;根生物量最优模型为模型13 (DBH模型),$ {{R}}_{\text{adj}}^{\text{2}} $=0.961, EMP=5.702%。对地上生物量和总生物量的拟合发现,无最大$ {{R}}_{\text{adj}}^{\text{2}} $和最小EMP的组合,因此引入CAI作为辅助评价指标。选取地上生物量各模型中具有最大${{R}}_{\text{adj}}^{\text{2}} $的模型17和具有最小EMP的模型20,并选取CAI最小的模型。对总生物量各模型采用相同选择方式,在模型21和模型24中,选取CAI最小的模型,即地上生物量最优拟合模型为模型17 (DBH模型),总生物量最优拟合模型为模型21 (DBH模型)。

      模型编号因变量预测变量βi0βi1βi2ERSFCCAI$ {{R}}_{\text{adj}}^{\text{2}} $EMP/%
      1lnBstlnDBH−3.390***2.819***0.1981.020−2.7960.98815.329
      2lnH−4.294***2.992***0.3791.07445.1390.76031.771
      3ln(DBH 2 H)−3.839***0.981***0.1271.008−35.8790.9916.594
      4lnDBH+lnH−3.819***2.008***0.931***0.1261.008−28.0360.9926.532
      5lnBbrlnDBH−3.900***2.266***0.4111.08851.1830.7798.105
      6lnH−3.980***2.139***0.7381.31394.5210.33712.947
      7ln(DBH 2 H)−4.073***0.761***0.5091.13867.0360.6609.651
      8lnDBH+lnH−3.078***3.820***−1.783***0.2891.04333.1410.8804.654
      9lnBlflnDBH−2.752***1.443***0.3091.04930.0820.6154.669
      10lnH−2.635***1.367***0.4941.13064.8800.2946.724
      11ln(DBH 2 H)−2.685***0.485***0.3621.06841.7570.5295.378
      12lnDBH+lnH−2.070***2.392***−1.089***0.2521.03223.0120.6843.131
      13lnBrtlnDBH−3.878***2.546***0.2961.04526.8360.9615.702
      14lnH−4.529***2.634***0.5151.14267.8300.58316.449
      15lnDBH 2 H−4.235***0.879***0.3151.05131.4700.8918.424
      16lnDBH+lnH−3.968***2.375***0.1950.2941.04434.4020.9445.982
      17lnBablnDBH−2.520***2.563***0.1511.011−23.1220.98415.244
      18lnH−3.179***2.653***0.4481.10557.5390.66251.487
      19ln(DBH 2 H)−2.881***0.885***0.1841.017−8.2710.94218.871
      20lnDBH+lnH−2.616***2.380***0.2100.1471.011−17.1000.97713.434
      21lnBttlnDBH−2.284***2.558***0.1611.013−18.2040.98817.691
      22lnH−2.940***2.648***0.4511.10758.1570.65567.534
      23ln(DBH 2 H)−2.644***0.883***0.1931.019−4.6950.94025.156
      24lnDBH+lnH−2.378***2.380***0.2040.1571.012−11.8370.98016.482
        说明:Bst. 干生物量;Bbr. 枝生物量;Blf. 叶生物量;Brt. 根生物量;Bab. 地上生物量;Btt. 总生物量。ERS. 残差标准误;FC. 矫正因子;CAI. 赤池信息准则;EMP. 平均预测误差。***表示P<0.001水平上有显著性;βi0βi1βi2为回归系数。

      Table 3.  Models for estimating biomass of eucalyptus plantation forests by organ without stand age

    • 将林龄作为自变量加入后再次进行回归分析,建立了加入林龄自变量的生物量异速生长模型共24个(表4),其中树干生物量最优模型为模型27(DBHH+林龄模型),$ {{R}}_{\text{adj}}^{\text{2}} $=0.993,EMP=7.167%;枝生物量最优模型为模型32 (DBHH+林龄模型),$ {{R}}_{\text{adj}}^{\text{2}} $=0.894,EMP=3.931%;根生物量最优模型为模型37 (DBH+林龄模型),$ {{R}}_{\text{adj}}^{\text{2}} $=0.959,EMP=7.164%;叶生物量、地上生物量及总生物量无最大$ {{R}}_{\text{adj}}^{\text{2}} $和最小EMP的组合。对于叶生物量,仅有模型35的$ {{R}}_{\text{adj}}^{\text{2}} $在0.9以上,因此可认为模型35为最佳模型(DBH 2 H+林龄模型)。对于地上生物量和总生物量,和不含林龄的异速生长模型选取的方式相同,于模型43、模型44和模型47、模型48中分别选取CAI最低拟合方程,得出地上生物量最优模型为模型43 (DBH 2 H+林龄模型),总生物量最优模型为模型47 (DBH 2 H+林龄模型)。

      模型
      编号
      因变量预测变量βi0βi1βi2βi3βi4βi5ERSFCCAI$ {{R}}_{\text{adj}}^{\text{2}} $EMP/%
      25lnBstlnDBH+a−3.617***2.829***0.291***−0.089**0.1711.0154.3990.96314.593
      26lnH +a−2.721***2.156***−0.1510.0970.2251.02638.5630.97320.152
      27ln(DBH 2 H)+a−3.516***0.908***0.084−0.0050.1151.007−0.9470.9937.167
      28lnDBH+lnH+a−3.552***1.378***1.318**0.1400.066−0.0940.1111.00622.2080.9887.957
      29lnBbrlnDBH+a−2.619***1.671***−0.399*0.155**0.3681.07071.8970.8726.345
      30lnH+a−1.0040.683*−0.7200.312*0.5191.14493.7970.7877.458
      31ln(DBH 2 H)+a−2.154***0.464***−0.591*0.077**0.4151.09083.8920.8226.935
      32lnDBH+lnH+a−2.495***4.076***−2.258***−0.408−0.1780.3190.2991.04683.6200.8943.931
      33lnBlflnDBH+a−1.938***1.282***−0.507***0.163***0.2641.03650.0660.6863.955
      34lnH+a−0.7510.548*−0.805*0.300**0.3881.07874.7260.5985.271
      35ln(DBH 2 H)+a−1.620***0.364***−0.638***0.077***0.2951.04461.3710.9694.151
      36lnDB+lnH+a−1.992***2.235***−0.862−0.3950.0650.0540.2541.03373.5410.6703.160
      37lnBrtlnDBH+a−4.083***2.544***0.290−0.0880.2951.04457.3070.9597.164
      38lnH+a−3.141***1.788***0.233−0.0220.4211.09380.0240.90613.746
      39ln(DBH 2 H)+a−3.873***0.788***0.170−0.0120.3201.05266.7390.9538.777
      40lnDBH+lnH+a−4.358***2.484***0.1430.597*0.010−0.2000.2971.04583.2760.9427.110
      41lnBablnDBH+a−2.218***2.333***0.114−0.0220.1331.009−14.1210.97614.261
      42lnH+a−1.236***1.650***−0.2900.150*0.2571.03347.3850.95031.455
      43ln(DBH 2 H)+a−2.050***0.734***−0.0790.017*0.1311.0097.6310.99413.088
      44lnDBH+lnH+a−2.131***1.775***0.486*−0.0160.0170.0080.1301.00932.1340.98513.055
      45lnBttlnDBH+a−2.076***2.373***0.146−0.0340.1551.01214.6860.96020.894
      46lnH+a−1.106**1.675***−0.1870.1160.2821.04153.5880.94344.784
      47ln(DBH 2 H)+a−1.903***0.744***−0.0320.0110.1571.01219.8700.98719.751
      48lnDBH+lnH+a−2.069***1.905***0.4280.1090.019−0.0370.1521.01241.8690.98618.834
        说明:a. 林龄。Bst. 干生物量;Bbr. 枝生物量;Blf. 叶生物量;Brt. 根生物量;Bab. 地上生物量;Btt. 总生物量;ERS. 残差标准误;FC. 矫正因子;CAI. 赤池信息准则;EMP. 平均预测误差。***表示P<0.001水平上有显著性;**表示P<0.01水平上有显著性;*表示P<0.05水平上有显著性。βi0βi1βi2βi3βi4βi5为回归系数。

      Table 4.  Models for estimating the biomass of eucalyptus plantation forests by adding organs to stand age

    • 将不含林龄的各器官异速生长方程和加入林龄的各器官异速生长方程对比。在干水平上,不含林龄的异速生长方程最优模型为模型4,加入林龄后的异速生长方程最优模型为模型27。将两者进行比较,模型4的$ {{R}}_{\text{adj}}^{\text{2}} $小于模型27,模型27的EMP大于模型4,且两者$ {{R}}_{\text{adj}}^{\text{2}} $均大于0.99,将两者的预测值进行T检验,结果无显著差异(P=0.978)。由此可知:在干生物量预测方面,模型4与模型27均可视为最佳预测模型。在枝水平上,不含林龄的异速生长方程最优模型为模型8,加入林龄的最优异速生长模型为模型32,比较发现模型32的$ {{R}}_{\text{adj}}^{\text{2}} $大于模型8,且EMP小于模型8。由此可知:在枝水平上,加入林龄的模型32为最优预测模型。在叶生物量的8个模型中,仅有加入林龄的模型35的$ {{R}}_{\text{adj}}^{\text{2}} $>0.9,因此选择模型35为叶生物量预测的最佳模型。在根水平上,不含林龄的最优模型(模型13)拥有比加入林龄的最优模型(模型37)更大的$ {{R}}_{\text{adj}}^{\text{2}} $与更小的EMP。由此可知:根生物量的最佳预测模型为不含林龄的模型13。在地上生物量水平上,比较不含林龄的最佳模型(模型17)与加入林龄的最佳模型(模型43),发现模型43为两者中具有较的大$ {{R}}_{\text{adj}}^{\text{2}} $和较小的EMP,因此模型43为地上生物量的最佳预测模型。在全株生物量水平上进行比较,不含林龄最优模型21的EMP=17.691%,小于加入林龄最优模型47(EMP=19.751%)。由此可知:在全株生物量预测中,不含林龄的模型21为最优模型。

    • 林龄对树木生物量分配格局的影响既是树木自身生长的结果,同时也是树木为保证各个器官的生理活动和功能而进行资源分配平衡的结果[2526]。以前的研究表明:植株的地上生物量在总生物量中的占比为79.00%[2728]。本研究发现:尾巨桉人工林的地上生物量占总生物量的比例为74.79%~81.67%。地上生物量随年龄变化的分配模式为随着年龄增长,干生物量占比逐渐增加,而枝生物量与叶生物量的占比逐渐减小。这与很多研究的结论相似[2933]。在幼龄期,较高的枝和叶生物量占比,可以保证更多的生物量被分配用于光合作用[21],这对于幼树的存活极为重要[30, 34]。随着林龄的增长,树木为了保证自身的物理稳定性[30],会将更多的生物量分配给干的生长,因此叶和枝生物量增加的比例小于干生物量增加的比例[25],进而导致干生物量占比随林龄逐渐增大,而枝和叶生物量占比随林龄的增大逐渐减小。根生物量在总生物量中的占比随年龄变化无一定规律。在本研究中,根生物量占比先增加,后逐渐下降,直至稳定,为18.33%~25.21%。这与其他研究得出的根生物量占比在林分建立后即大幅下降,最终稳定在一个数值的结论并不一致[30, 35]。这可能是由于人工林的人为抚育措施,尤其是施肥,对根系发育有着重要的影响,施肥时间的不固定性同样会导致根系生物量所占比例发生起伏[19]

      本研究发现:与对其他树种的研究结果一致[7, 3640],尾巨桉各器官生物量均符合异速关系理论;加入树高变量后,除根生物量、地上生物量及总生物量以外,其余各器官生物量的异速生长方程拟合效果均有提升。有许多研究也讨论了树高作为第2变量加入后对树木生物量异速生长方程的影响[4143],如WANGER等[41]对白松Pinus armandii进行研究,发现树高的加入改善了叶生物量异速生长方程的预测精度,XIANG等[23]对杉木Cunninghamia lanceolata的研究表明:加入树高变量后,提高了干、枝及叶生物量模型的预测精度;CIENCALA等[43]的研究认为:赤松Pinus densiflora树高的加入轻微改善了各器官生物量方程的拟合效果。但JENKINS等[44]在对美国主要树种进行异速生长方程研究后认为:树高并不是一个有效变量,仅小部分改善预测效果。

      林龄的加入对树木不同器官生物量的预测模型的改善程度并不相同。当将林龄加入异速生长方程后,枝、叶和地上生物量的异速生长方程的拟合效果均有改善,其中叶生物量方程的拟合效果改善最为明显,但对干生物量、根生物量和总生物量的拟合效果改善不大。这与PEICHL等[30]对白松的年龄序列下各器官生物量异速生长方程的研究结果一致。他们的研究表明:林龄变量的加入可改善枝和叶生物量的估算。XIANG等[23]对杉木的研究也表明:枝、叶生物量在不同林龄中有较高的变异。SAINT-ANDRÉ等[29]对杂交桉E. hybrid的研究也发现:林龄的加入改善了干、枝、叶和地上生物量的预测效果,但未改善根生物量的预测效果。同时他们也指出:加入林龄后,预测结果的变异不是林龄单一作用的结果,而是林龄和竞争共同作用的结果。BOND-LAMBERTY等[45]在研究6种北方树种的地上和地下生物量异速生长模型时引入了林龄,但发现引入林龄后对预测效果的改善并不总是具有显著性,具体取决于立地条件和树种。因此,在建立异速生长模型时,除考虑常规测树因子(树高、胸径、林龄等)以外,还需考虑竞争关系和立地条件等因素。

    • 尾巨桉人工林各器官的生物量分配格局存在明显的林龄效应。随着尾巨桉林林龄的增加,枝、叶生物量占总生物量的比例逐渐下降,而干生物量占总生物量的比例逐渐增加,根生物量的比例先增加后下降,整体呈稳定趋势。在异速生长模型拟合效果对比中,加入树高因素后,干生物量、枝生物量及叶生物量模型的预测效果明显改善,但对根生物量、地上生物量及整株生物量预测效果的影响较小。将林龄作为变量加入异速生长方程后,枝生物量、叶生物量和地上生物量方程的预测结果明显改善,而对根生物量、干生物量及整株生物量影响较小。在各器官生物量最优模型选择上,以单独的DBH为自变量的模型对根生物量和总生物量的预测要优于其他模型;以DBH 2 H+林龄为自变量的模型对叶生物量和地上生物量的预测最佳;以DBHH+林龄为自变量的模型对枝生物量的预测最佳;在对干生物量的预测精度对比中,以DBHH与以DBH 2 H+林龄为自变量的预测模型之间无显著差异,均能较好的预测干生物量。

Reference (45)

Catalog

    /

    DownLoad:  Full-Size Img  PowerPoint
    Return
    Return