Volume 42 Issue 6
Nov.  2025
Turn off MathJax
Article Contents

WANG Yi, MEI Xuesong, YUAN Ye, et al. Accuracy evaluation of 2 allometric biomass models[J]. Journal of Zhejiang A&F University, 2025, 42(6): 1122−1131 doi:  10.11833/j.issn.2095-0756.20240512
Citation: WANG Yi, MEI Xuesong, YUAN Ye, et al. Accuracy evaluation of 2 allometric biomass models[J]. Journal of Zhejiang A&F University, 2025, 42(6): 1122−1131 doi:  10.11833/j.issn.2095-0756.20240512

Accuracy evaluation of 2 allometric biomass models

DOI: 10.11833/j.issn.2095-0756.20240512
  • Received Date: 2024-08-28
  • Accepted Date: 2025-03-03
  • Rev Recd Date: 2025-03-01
  • Available Online: 2025-11-26
  • Publish Date: 2025-11-26
  •   Objective  The objective is to study the 2 basic models for estimating forest biomass: constant allometric ratio (CAR) model and variable allometric ratio (VAR) model, and compare the prediction accuracy (P) of the models, so as to provide reliable theoretical and technical support for forest biomass monitoring.   Method  Based on the biomass survey data of 50 Larix gmelinii trees in 18 fixed sample plots of Pangu Forest Farm in Daxing’ an Mountains, a nonlinear seemingly uncorrelated regression method was used to construct the additive biomass models of CAR and VAR and to compare and evaluate the univariate and binary models of the 2 model forms.   Result  (1) In the univariate model, the total biomass of the CAR model and the adjusted coefficient of determination ($ {R}_{\mathrm{a}}^{2} $) of each component biomass model were both greater than those of the VAR model, with an average increase of about 0.003. In the binary model, the CAR model also had a larger $ {R}_{\mathrm{a}}^{2} $. (2) From the model test index, the prediction accuracy of the 2 models in the univariate model was greater than 97.6%, and the prediction accuracy of the CAR model was higher. The prediction accuracy of the binary model was greater than 96.9%, and the prediction accuracy of the CAR model was higher. (3) There was a correlation between the size of stand diameter class and the goodness of fit of the model, and the model was generally more suitable for smaller diameter stands.  Conclusion  In both the univariate and binary models of total biomass and component biomass of trees, the CAR model has better fitting and model testing indexes than the VAR model, and the CAR model has better fitting and prediction effects on forest biomass. The fitting effect of small-diameter trees is better than that of large diameter trees. In general, the CAR model is not only simpler in form, but also performs better in fitting effect and estimation accuracy, which can provide a theoretical basis for estimating the biomass of L. gmelinii in Daxing’ an Mountains. [Ch, 5 fig. 5 tab. 31 ref.]
  • [1] CAO Haoyang, DU Apeng, XU Yuxing, ZHU Wankuan, HUANG Runxia, LIU Yusheng, WANG Zhichao.  Age effect on biomass distribution pattern and optimization of allometric growth equation in Eucalyptus urophylla×E. grandis plantations . Journal of Zhejiang A&F University, 2024, 41(6): 1124-1133. doi: 10.11833/j.issn.2095-0756.20240180
    [2] YU Bao.  Characteristics and impact factors of self-pruning in natural Larix gmelinii forest . Journal of Zhejiang A&F University, 2023, 40(1): 209-216. doi: 10.11833/j.issn.2095-0756.20220220
    [3] WANG Bo, ZHOU Zhiyong, ZHANG Huan, ZHU Yong, CAO Yusong, ZHAO Hongtao.  Effect of Larix gmelinii proportion on soil chemical properties and enzymatic stoichiometry in mixed coniferous and broad-leaved forest . Journal of Zhejiang A&F University, 2020, 37(4): 611-622. doi: 10.11833/j.issn.2095-0756.20190525
    [4] LAN Jie, XIAO Zhongqi, LI Jimei, ZHANG Yutao.  Biomass allocation and allometric growth of Picea schrenkiana in Tianshan Mountains . Journal of Zhejiang A&F University, 2020, 37(3): 416-423. doi: 10.11833/j.issn.2095-0756.20190384
    [5] XIE Fuming, ZI Li, SHU Qingtai.  Optimizing the k-nearest neighbors technique for estimating Pinus densata aboveground biomass based on remote sensing . Journal of Zhejiang A&F University, 2019, 36(3): 515-523. doi: 10.11833/j.issn.2095-0756.2019.03.012
    [6] SHEN Jiapeng, CHEN Dongsheng, SUN Xiaomei, ZHANG Shougong.  Modeling a single-tree biomass equation by seemingly unrelated regression and dummy variables with Larix kaempferi . Journal of Zhejiang A&F University, 2019, 36(5): 877-885. doi: 10.11833/j.issn.2095-0756.2019.05.005
    [7] YU Bao.  Classification and management technology of trees in overcut forests of Larix gmelinii . Journal of Zhejiang A&F University, 2017, 34(2): 349-354. doi: 10.11833/j.issn.2095-0756.2017.02.020
    [8] LÜ Changxiao, DENG Huafeng, WANG Shaojie, CHEN Zhenxiong, WANG Xuejun.  Compatible tree volume and aboveground biomass equations for Pinus massoniana from different regions . Journal of Zhejiang A&F University, 2016, 33(5): 790-797. doi: 10.11833/j.issn.2095-0756.2016.05.010
    [9] FU Yanlin, LI Guolei.  Combined effects of phosphorus and controlled-release nitrogen on growth and nutrient status of transplanted Larix olgensis seedlings . Journal of Zhejiang A&F University, 2016, 33(6): 976-983. doi: 10.11833/j.issn.2095-0756.2016.06.008
    [10] RAN Qixiang, DENG Huafeng, HUANG Guosheng, WANG Xuejun, CHEN Zhenxiong.  An aboveground biomass model for Pinus yunnanensis . Journal of Zhejiang A&F University, 2016, 33(4): 605-611. doi: 10.11833/j.issn.2095-0756.2016.04.008
    [11] YU Bao, ZHANG Qiuliang, WANG Liming, SA Rula.  Distribution pattern for regeneration of a middle to young cut-over Larix gmelinii forest . Journal of Zhejiang A&F University, 2015, 32(3): 346-352. doi: 10.11833/j.issn.2095-0756.2015.03.003
    [12] ZHANG Zhen, ZHANG Han-guo, ZHANG Lei, ZHU Hang-yong, LI Xue-feng.  Diversity analysis with RAPD for natural and breeding populations of Larix gmelinii . Journal of Zhejiang A&F University, 2012, 29(1): 130-136. doi: 10.11833/j.issn.2095-0756.2012.01.022
    [13] YANG Qian-yu, XIE Jin-zhong, ZHANG Wei, LIN Zhen-qing.  Biomass models for Bambusa textilis var. tasca . Journal of Zhejiang A&F University, 2011, 28(3): 519-526. doi: 10.11833/j.issn.2095-0756.2011.03.027
    [14] YU Bao, ZHANG Qiu-liang, WANG Li-ming, WU Jisiguleng.  Characteristics of biomass and productivity in Larix gmelinii natural forests with different stand structures . Journal of Zhejiang A&F University, 2011, 28(1): 52-58. doi: 10.11833/j.issn.2095-0756.2011.01.009
    [15] SUN Yu, LI Guo-lei, LIU Yong, MA Lü-yi, ZHU Yan, JIANG Chang-ji, LIU Fu-sen, LI Xue-lian.  Growth and P-uptake for Larix olgensis seedlings with phosphorus top-dressed using fertigation . Journal of Zhejiang A&F University, 2011, 28(2): 219-226. doi: 10.11833/j.issn.2095-0756.2011.02.008
    [16] ZHANG Lei, ZHANG Han-guo, DENG Ji-feng, GUAN Chun-yu.  Stability of hybrid larches (Larix) with seedling height growth . Journal of Zhejiang A&F University, 2010, 27(5): 706-712. doi: 10.11833/j.issn.2095-0756.2010.05.011
    [17] JIANG Hai-yan, YAN Wei.  Distribution of soil microorganism in Larix gmelinii forests of the Great Xing’an Mountains,Inner Mongolia . Journal of Zhejiang A&F University, 2010, 27(2): 228-232. doi: 10.11833/j.issn.2095-0756.2010.02.011
    [18] TU Jie, LIU Qi-jing, JIAN Min-fei.  Crown biomass and increment in mid-young-aged Pinus elliottii plantation from Qianyanzhou . Journal of Zhejiang A&F University, 2008, 25(2): 206-210.
    [19] LIN Xin-chun, FANG Wei, YU Jian-xin, YU Xue-jun, HU Chao-zong, ZHOU Lin.  Biomass models of organs of Pleioblastus amarus . Journal of Zhejiang A&F University, 2004, 21(2): 168-171.
    [20] He Dongbei, Luo Qibang, Zeng Weisheng.  Study on linear simultaneous model of tree biomass . Journal of Zhejiang A&F University, 1998, 15(3): 298-303.
  • [1]
    FU Yujie, TIAN Di, HOU Zhengyang. Review on the evaluation of global forest carbon sink function[J]. Journal of Beijing Forestry University, 2022, 44(10): 1−10.
    [2]
    CAI Weixiang, HE Nianpeng, LI Mingxu, et al. Carbon sequestration of Chinese forests from 2010 to 2060: spatiotemporal dynamics and its regulatory strategies[J/OL]. Science Bulletin, 2022, 67: 836−843[2024-07-28]. DOI: 10.1016/j.scib.2021.12.012.
    [3]
    ALTANZAGAS B, LUO Yongkai, ALTANSUKH B, et al. Allometric equations for estimating the above-ground biomass of five forest tree species in Khangai, Mongolia[J/OL]. Forests, 2019, 10(8): 661[2024-07-28]. DOI: 10.3390/f10080661.
    [4]
    GUO Yudong, ZHANG Qiuliang, CHEN Xiaoyan, et al. Establishment of biomass models for artificial shrubbery in the Kubuqi desert area[J]. Journal of Northwest A&F University (Natural Science Edition), 2022, 50(4): 74−82.
    [5]
    ZHAO Houben, ZHOU Guangyi, LI Zhaojia, et al. Biomass allocation and allometric growth models of four common tree apecies in southern subtropical evergreen broad-leaved forest[J]. Scientia Silvae Sinicae, 2022, 58(2): 23−31.
    [6]
    LU Lihua, LI Hua, NONG You, et al. Biomass and its distribution pattern in four subtropical plantation ecosystems[J]. Journal of Central South University of Forestry & Technology, 2020, 40(8): 91−98.
    [7]
    KITTERDGE J. Estimation of the amount of foliage of trees and stands[J]. Journal of Forests, 1944, 42(12): 905−912.
    [8]
    RUARK G A, MARTIN G L, BOCKHEIM J G. Comparison of constant and variable allometric ratios for estimating populus tremuloides biomass[J]. Forest Science, 1987, 33(2): 294−300.
    [9]
    ZHANG Jingfei. Study on Biomass Model of P. orientalis in Miaofengshan[D]. Beijing: Beijing Forestry University, 2012.
    [10]
    LI Haikui, NING Jinkui. Individual tree biomass model by tree origin, site classes and age groups[J]. Acta Ecologica Sinica, 2012, 32(3): 740−757.
    [11]
    QIU Yang, ZHANG Jintun, CHAI Baofeng, et al. Study on the aboveground biomass and productivity of Pinus tabulaeformis planted forest west of Shanxi Province[J]. Henan Science, 1999, 17(suppl): 79−83, 86.
    [12]
    LÜ Ziqing, DUAN Aiguo. Biomass and carbon storage model of Cunninghamia lanceolata in different production areas[J]. Scientia Silvae Sinicae, 2024, 60(2): 1−11.
    [13]
    CAI Huide, LU Feng, XU Zhanyong, et al. Research development of compatible and additive individual tree biomass model systems for Eucalyptus[J]. Forest Resources Management, 2023(1): 87−93.
    [14]
    TANG Souzhent, LI Yong, WANG Yonghe. Simultaneous equations, error-in variable models, and model integration in systems ecology[J]. Ecological Modelling, 2001, 142: 285−294.
    [15]
    LI Wenbo, XIE Longfei, DONG Lihu. Construction of additive biomass model of planted poplar trees considering plot effect[J]. Chinese Journal of Ecology, 2024, 43(8): 2513−2522.
    [16]
    XIN Shidong, YAN Yunxian, JIANG Lichun. Stand biomass model for Pinus koraiensis plantation based on different additive methods in Heilongjiang Province, China[J]. Chinese Journal of Applied Ecology, 2020, 31(10): 3322−3330.
    [17]
    LI Haikui, ZHAO Pengxiang. Improving the accuracy of tree-level aboveground biomass equations with height classification at a large regional scale[J]. Forest Ecology and Management, 2013, 289: 153−163.
    [18]
    LIU Xiuhong, JIANG Chunqian, XU Rui, et al. Comparison of methods to construct compatible individual tree biomass models: a case study of Cyclobalanopsis glauca[J]. Scientia Silvae Sinicae, 2020, 56(9): 164−173.
    [19]
    LIU Ning, WANG Bin, ZHENG Shuxia, et al. Construction of compatible growth simultaneous equations model for Pinus tabuliformis plantation [J]. Journal of Southwest Forestry University, 2024, 44(2): 119−126.
    [20]
    KOZAK A, KOZAK R. Does cross validation provide additional information in the evaluation of regression models?[J]. Canadian Journal of Forest Research, 2003, 33: 976−987.
    [21]
    ZENG Weisheng, TANG Shouzheng. Biomass correction in logarithmic regression and comparison with weighted regression for non-linear models[J]. Forest Research, 2011, 24(2): 137−143.
    [22]
    RAN Qixiang, DENG Huafeng, HUANG Guosheng, et al. An aboveground biomass model for Pinus yunnanensis[J]. Journal of Zhejiang A&F University, 2016, 33(4): 605−611.
    [23]
    PENG Jianjian, WANG Zeng, ZHANG Yong, et al. Construction of compatible individual tree biomass model of Myrica rubra plantation[J]. Journal of Zhejiang A&F University, 2022, 39(2): 272−279.
    [24]
    MA Hao, CAO Yuanshuai, LÜ Yanjie, et al. Construction of individual tree DBH growth models for natural Betula platyphylla forests in Daxing’an Mountains, Inner Mongolia of Northern China [J]. Journal of Beijing Forestry University, 2024, 46(8): 101−110.
    [25]
    ZENG Weisheng. Methodology on Modeling of Single-Tree Biomass Equations for National Biomass Estimation in China[D]. Beijing: Chinses Academy of Forestry, 2011.
    [26]
    MADGWICK H, SATOO T. On estimating the aboveground weights of tree stands[J]. Ecology, 1975, 56: 1446−1450.
    [27]
    DONG Lingbo, SHAO Weiwei, TIAN Dongyuan, et al. Height curve of natural Larix gmelinii in the Daxing’ anling Mountains of Northeastern China based on forest classification[J]. Journal of Beijing Forestry University, 2023, 45(5): 88−96.
    [28]
    XÜ Hui. A comparison between CAR and VAR biomass models[J]. Journal of Southwest Forestry University, 2003, 23(2): 36−39.
    [29]
    YAO Zhengyang, LIU Jianjun. Models for biomass estimation of four shrub species planted in urban area of Xi’an City, Northwest China[J]. Chinese Journal of Applied Ecology, 2014, 25(1): 111−116.
    [30]
    LI Zhigang, MA Qinyan. An approach to methods for estimating biomass of the Larix principis-rupprechtii artificial forests[J]. Journal of Beijing Forestry University, 1992, 14(suppl 1): 105−113.
    [31]
    ZHOU Xiaolu, YANG Mingxia, LIU Zelin, et al. Dynamic allometric scaling of tree biomass and size[J]. Nature Plants, 2021, 7: 42−49.
  • 加载中
通讯作者: 陈斌, bchen63@163.com
  • 1. 

    沈阳化工大学材料科学与工程学院 沈阳 110142

  1. 本站搜索
  2. 百度学术搜索
  3. 万方数据库搜索
  4. CNKI搜索

Figures(5)  / Tables(5)

Article views(336) PDF downloads(14) Cited by()

Related
Proportional views

Accuracy evaluation of 2 allometric biomass models

doi: 10.11833/j.issn.2095-0756.20240512

Abstract:   Objective  The objective is to study the 2 basic models for estimating forest biomass: constant allometric ratio (CAR) model and variable allometric ratio (VAR) model, and compare the prediction accuracy (P) of the models, so as to provide reliable theoretical and technical support for forest biomass monitoring.   Method  Based on the biomass survey data of 50 Larix gmelinii trees in 18 fixed sample plots of Pangu Forest Farm in Daxing’ an Mountains, a nonlinear seemingly uncorrelated regression method was used to construct the additive biomass models of CAR and VAR and to compare and evaluate the univariate and binary models of the 2 model forms.   Result  (1) In the univariate model, the total biomass of the CAR model and the adjusted coefficient of determination ($ {R}_{\mathrm{a}}^{2} $) of each component biomass model were both greater than those of the VAR model, with an average increase of about 0.003. In the binary model, the CAR model also had a larger $ {R}_{\mathrm{a}}^{2} $. (2) From the model test index, the prediction accuracy of the 2 models in the univariate model was greater than 97.6%, and the prediction accuracy of the CAR model was higher. The prediction accuracy of the binary model was greater than 96.9%, and the prediction accuracy of the CAR model was higher. (3) There was a correlation between the size of stand diameter class and the goodness of fit of the model, and the model was generally more suitable for smaller diameter stands.  Conclusion  In both the univariate and binary models of total biomass and component biomass of trees, the CAR model has better fitting and model testing indexes than the VAR model, and the CAR model has better fitting and prediction effects on forest biomass. The fitting effect of small-diameter trees is better than that of large diameter trees. In general, the CAR model is not only simpler in form, but also performs better in fitting effect and estimation accuracy, which can provide a theoretical basis for estimating the biomass of L. gmelinii in Daxing’ an Mountains. [Ch, 5 fig. 5 tab. 31 ref.]

WANG Yi, MEI Xuesong, YUAN Ye, et al. Accuracy evaluation of 2 allometric biomass models[J]. Journal of Zhejiang A&F University, 2025, 42(6): 1122−1131 doi:  10.11833/j.issn.2095-0756.20240512
Citation: WANG Yi, MEI Xuesong, YUAN Ye, et al. Accuracy evaluation of 2 allometric biomass models[J]. Journal of Zhejiang A&F University, 2025, 42(6): 1122−1131 doi:  10.11833/j.issn.2095-0756.20240512
  • 近年来,全球二氧化碳排放量逐年增加,对全球气候和生物多样性造成重大影响。森林作为陆地生态系统的主体,发挥其碳汇作用是中国实现碳达峰和碳中和愿景的重要路径[12]。林木生物量是估算森林生态系统碳汇能力的基础数据[3],通过全称重法直接获取林木生物量的工作量极大[4],而且大量伐木会破坏森林生态系统。模型法估算林木生物量不仅效率高而且精度满足需求,因此被广泛使用[5]。模型估算法通过建立林木易测因子(如胸径、树高、冠幅)与树木各组分(干、枝、叶、根等)干质量之间的方程,达到用树木易测因子估算不易测因子(各组分生物量)的目的[6]

    相对生长模型是用指数或对数关系反映林木各组分之间按比例协调增长的模型[7]。根据林木各组分之间的相对生长关系建立的恒定异速生长比(constant allometric ratio,CAR)模型在林木生物量估算时被广泛使用。RUARK等[8]认为:CAR模型未考虑林木各组分之间相对生长率随林木大小的变化有可能不是一个常数,进而提出含可变相对生长率的可变异速生长比(variable allometric ratio,VAR)模型。这2种模型中,虽然VAR模型参数相对较多,但能反映异速的协调关系,而且从理论上来说不同大小的树木在竞争和获取各种资源时的能力是不同的,因此其异速关系不是固定的。从这方面看,VAR模型较CAR模型更符合理论实际。张静菲[9]在妙峰山侧柏Platycladus orientali生物量模型研究中对比了这2种模型,结果表明:VAR模型的灵活性和拟合性要优于CAR模型,而CAR模型检验时表现更优。李海奎等[10]研究表明:这2种模型的优劣在不同树种间存在差异,马尾松Pinus massoniana以VAR模型较优,而落叶松Larix spp.则以CAR模型较好,且在建模样本和验证样本中表现也不一致。邱扬等[11]对油松P. tabulaeformis生物量的研究显示:VAR模型优于CAR模型。关于这2个模型的评价国内外学者的研究很多,但结果不尽相同。

    兴安落叶松Larix gmelinii是中国北方主要用材树种,面积和蓄积量分别占中国寒温带有林地面积和蓄积量的55%和75%。研究兴安落叶松单木生物量模型对北方碳汇量估计具有重要意义。本研究以大兴安岭地区的兴安落叶松为研究对象,采用非线性似乎不相关回归法,构建2种不同的林木相对生长模型,并对比择优,对测定兴安落叶松单木生物量,以及兴安落叶松天然林生态系统的产量结构和物质循环规律有着十分重要的意义。

    • 采样地点为大兴安岭地区塔河林业局盘古林场(52°41′57″N,123°51′57″E)。该区属大陆性季风气候,年平均气温为−5.0 ℃,林内年积雪期为5个月,深度达40 cm。地貌多为山地丘陵。林场面积为15.2万 hm2,蓄积量为844万 m3,森林覆盖率为88.9%。该区地带性植被是以兴安落叶松林为主的寒温带针叶林,其他主要林型有白桦Betula platyphylla林、樟子松P. sylvestris var. mongolica林、针叶混交林以及针阔混交林等。

    • 根据盘古林场2011年二类调查数据,在研究区内兴安落叶松林分布的典型地段布设18块20 m×30 m固定样地。对样地进行每木调查,包括树种、胸径和树高等因子,其中树高数据由Vertex Ⅳ超声波测高器测定(精度0.1 m)。根据调查数据,采用等断面积径级标准木法在每块标准地所在林分中选择优势木、平均木和被压木各1株,即按林木胸径大小排序,将林木分为断面积基本相等的3个径级,分别径级选标准木,由大到小依次为优势木、平均木和被压木。因操作条件等限制,其中2块样地内仅选取优势木和平均木,1块样地仅选取平均木,因此最终共选取50株兴安落叶松样木。样木伐倒后,用皮尺测定伐倒木树高,并将树干按2 m区分成若干段,测定各区分段鲜质量;树冠分3层选取标准枝,并分别称量枝、叶鲜质量;地下部分测定大根(>5 cm)、粗根(>2~5 cm)、细根(≤2 cm)鲜质量。样木树干各区分段、每层枝叶以及3种粗度根系都分别取样,带回室内烘干,测其干质量,推算样木各部分干鲜比、各部分干质量,累计汇总得到树冠生物量、地上生物量及总生物量。研究样地基本概况见表1图1

      统计量林分因子树木因子
      平均胸径/cm平均树高/m株数密度/(株·hm−2)胸径/cm树高/m总生物量/(kg·株−1)
      平均值11.012.11 886.616.414.6178.5
      最大值14.819.63 333.338.126.0897.2
      最小值7.06.7783.36.56.19.8
      极差7.812.92 550.031.619.9887.4
      变异系数/%19.022.933.344.427.9113.7

      Table 1.  Forest and trees survey factors of L. gmelinii

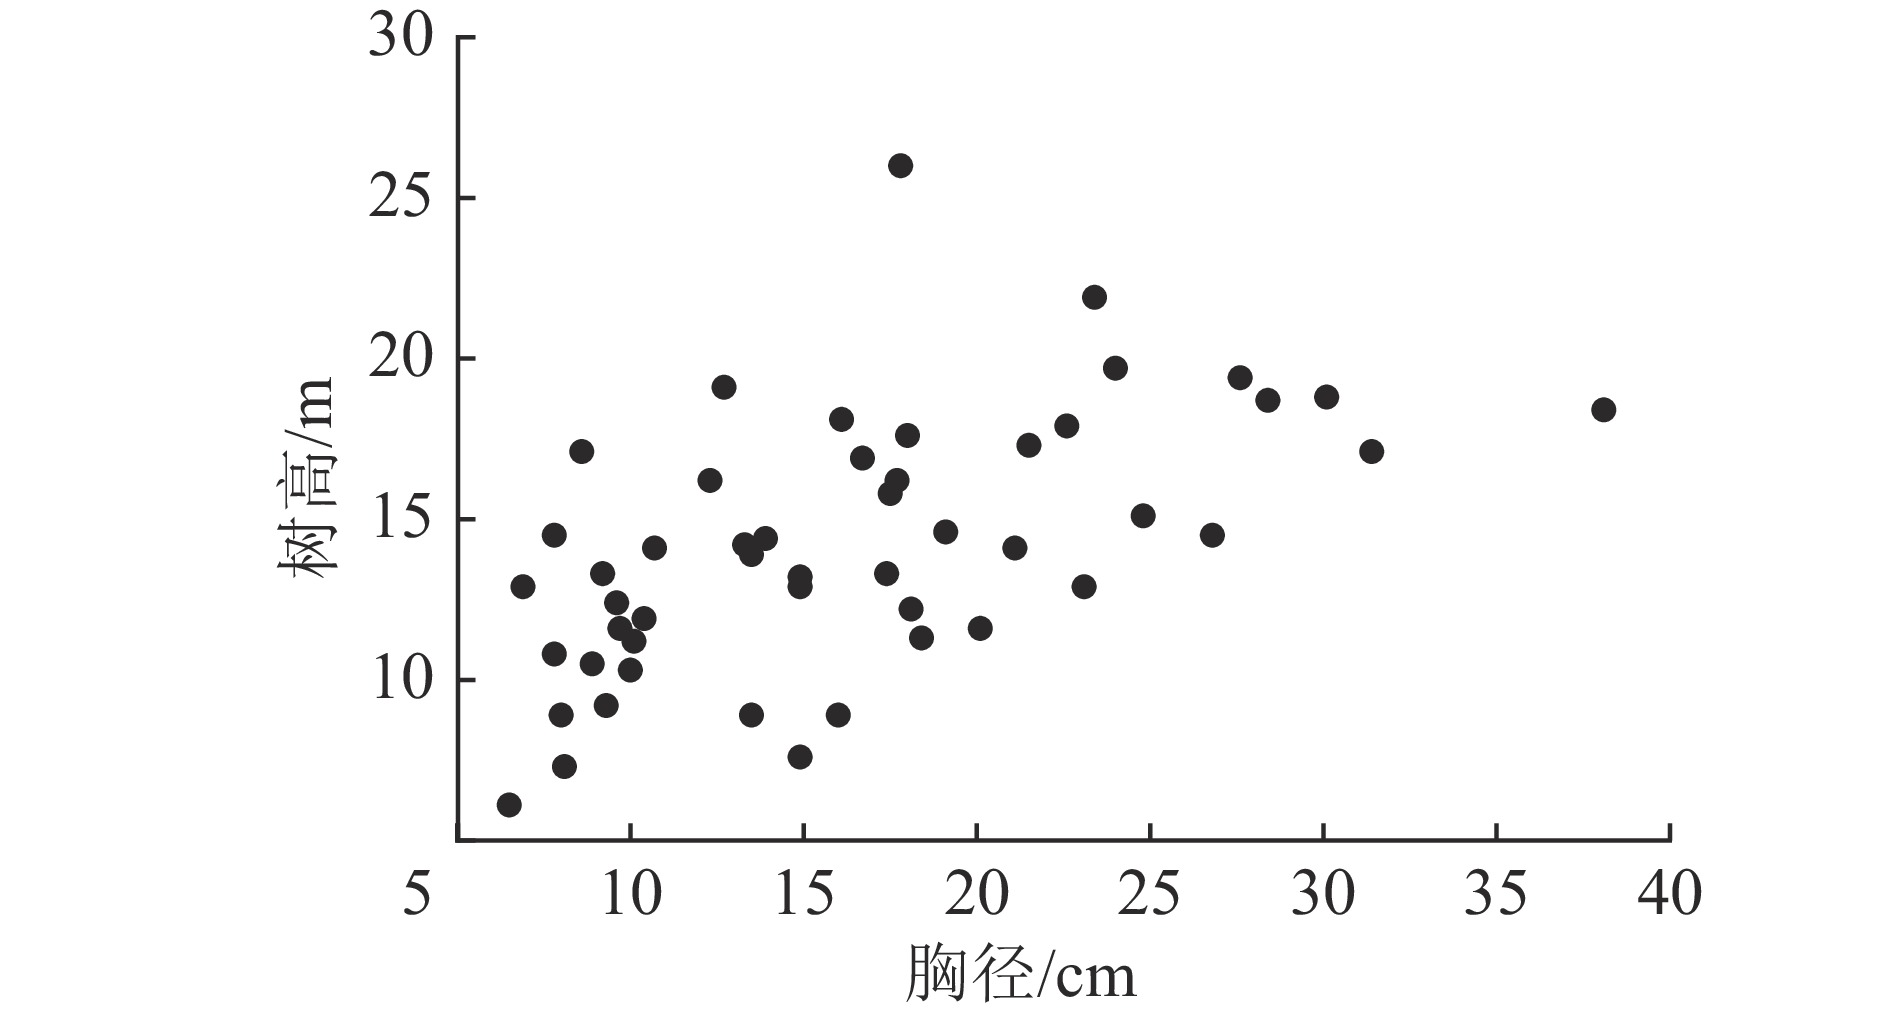
      Figure 1.  Scatter plot of DBH-tree height distribution of L. gmelinii

    • 相对生长法则认为:生物体的2个部分XY或全体X和部分Y之间存在下列关系[12]

      XY的生长率成比例,比例系数b被称为相对生长系数,其对数形式:

      式(1)即CAR模型。该模型未考虑林木各器官之间相对生长率随林木大小的变化,可能不是常数。鉴于此,RUARK等[8]提出了VAR模型(式3),其中XY的生长率与X的大小呈线性关系。模型新增的cX通过线性调节相对生长系数b,提供了1个可变的相对生长率。这种相对生长关系方程不再假定随着时间、林木大小的变化相对生长率是1个常数。

      其对数形式:

      建立生物量模型的主要目的是为了预估,应尽可能选用在立木中比较容易获取的测树因子,而胸径(D)和树高(H)在立木中比较容易获取且数据相对准确,所以本研究以DD2H为模型变量建立CAR模型和VAR模型。

      CAR模型:

      VAR模型:

      式(5)~(8)中:W为生物量;D为胸径;H为树高;abc为模型参数。

    • 在建立生物量模型时,国内外学者普遍先确定各组分生物量的基础模型,然后根据各组分生物量数据分别拟合模型参数,即各组分生物量的估计是独立进行的[13],最终各组分生物量预测值之和与总生物量不相等,生物量间不相容。为解决这一问题,一些学者提出联立方程组的方法[1416],并选择合适的结构形式建立相容性生物量模型[17]。本研究选用非线性似乎不相关回归法构建聚合型可加性模型。

      $ {W}_{\mathrm{t}} $、$ {W}_{\mathrm{a}} $、$ {W}_{\mathrm{r}} $、$ {W}_{\mathrm{s}} $、$ {W}_{\mathrm{b}} $、$ {W}_{\mathrm{f}} $和$ {W}_{\mathrm{c}} $分别代表林木总生物量、地上生物量、树根生物量、树干生物量、树枝生物量、树叶生物量和树冠生物量。以式(9)~(12)为基础模型构建兴安落叶松总生物量及各组分生物量模型,之后按照可加性的定义[18],构造总生物量与各组分生物量的可加性生物量模型。本研究采用聚合型可加性生物量模型,建立的聚合型可加性生物量模型需满足[19]:①各组分生物量之和等于总生物量;②树枝、树叶、树干生物量之和等于地上生物量;③树枝、树叶生物量之和等于树冠生物量。此外,由于生物量存在异方差性,必须选用适当的权函数加权回归或者将模型化为对数形式消除异方差。本研究选用对数转换方式来消除异方差。

      CAR-D模型:

      CAR-D2H模型:

      VAR-D模型:

      VAR-D2H模型:

      式(9)~(12)中:$ {{\alpha }_{i}^{\mathrm{*}}} $、$ {{b}_{i}^{\mathrm{*}}} $、$ {{c}_{i}^{\mathrm{*}}} $为模型参数;i表示林木各组分;其余变量如前所述。4个模型的树冠生物量、地上部分生物量和总生物量均可表示为:

    • 很多学者认为必须利用检验样本检验模型。KOZAK等[20]和曾伟生等[21]认为:单独设置检验样本的交叉验证不必要,建议利用整个样本进行建模。目前刀切法被广泛用于检验模型的预测能力,因此,本研究用全部数据拟合模型,并用调整决定系数($ {R}_{\mathrm{a}}^{2} $)、均方根误差(RMSE)和模拟效率(EF)评价模型拟合效果;采用刀切法检验模型,平均预估误差(MPE)、平均绝对误差(MAE)和预测精度(P,%)评价模型预测能力[2224]。刀切法主要思路是设N为样本量,用N−1株样木数据建模,预测剩余的单株样木,重复N次后可获得每株样木的生物量刀切法预测值。

    • 使用对数转换模型估计林木生物量时,由模型估计值的反对数得到的生物量估计值会存在一个系统偏差,校正系数(CF)可校正此偏差[25]。然而MADGWICK等[26]研究发现:使用校正系数会造成生物量的高估,建议在模型反对数偏差很小时,不进行生物量的校正。

    • D为变量,建立CAR和VAR的一元相容性生物量模型。从表2可以看出:兴安落叶松CAR模型的总生物量及各组分生物量模型的调整后决定系数比VAR模型的高0~0.008,平均高0.003;CAR模型的均方根误差除树枝生物量模型外均低于VAR模型,平均低0.005;模拟效率除树枝、树干和树冠生物量外,均是CAR模型值较高,表明从调整后决然定系数、均方根误差和模拟效率3个指标看,CAR一元模型中总生物量及各组分生物量模型优于VAR模型。

      组分 模型 参数估计值 拟合优度 校正系数
      ${a^*} $ ${b^*} $ $ {c^*}$ 调整后决定系数 均方根误差 模拟效率
      树枝生物量 CAR
      VAR
      0.016 5 (0.000 4)
      0.009 4 (0.000 4)
      2.250 7 (0.009 1)
      2.587 2 (0.022 0)

      −0.021 1 (0.001 2)
      0.855
      0.855
      0.414
      0.413
      0.858
      0.861
      1.001 7
      1.000 0
      树叶生物量 CAR
      VAR
      0.066 4 (0.004 2)
      0.038 6 (0.002 5)
      1.341 4 (0.023 9)
      1.669 5 (0.027 7)

      −0.017 8 (0.001 9)
      0.701
      0.693
      0.387
      0.392
      0.707
      0.701
      1.000 1
      1.079 7
      树干生物量 CAR
      VAR
      0.052 7 (0.001 0)
      0.030 6 (0.001 1)
      2.615 9 (0.007 0)
      2.939 7 (0.020 3)

      −0.020 2 (0.001 2)
      0.956
      0.956
      0.250
      0.250
      0.957
      0.943
      1.007 1
      1.007 6
      树根生物量 CAR
      VAR
      0.008 7 (0.001 1)
      0.005 0 (0.000 7)
      2.900 4 (0.044 5)
      3.232 4 (0.050 7)

      −0.017 0 (0.002 3)
      0.905
      0.898
      0.419
      0.433
      0.907
      0.902
      1.000 8
      1.125 8
      树冠生物量 CAR
      VAR


      0.849
      0.847
      0.376
      0.379
      0.858
      0.862
      1.001 1
      1.000 0
      地上部分生物量 CAR
      VAR


      0.965
      0.964
      0.214
      0.218
      0.969
      0.970
      1.000 1
      1.000 0
      总生物量 CAR
      VAR


      0.974
      0.972
      0.191
      0.198
      0.977
      0.944
      1.012 7
      1.000 5
        说明:括号内数值为参数标准误。−表示无此项。

      Table 2.  Parameter estimation, goodness of fit and correction coefficient of two forms of one-dimensional compatible biomass model of L. gmelinii

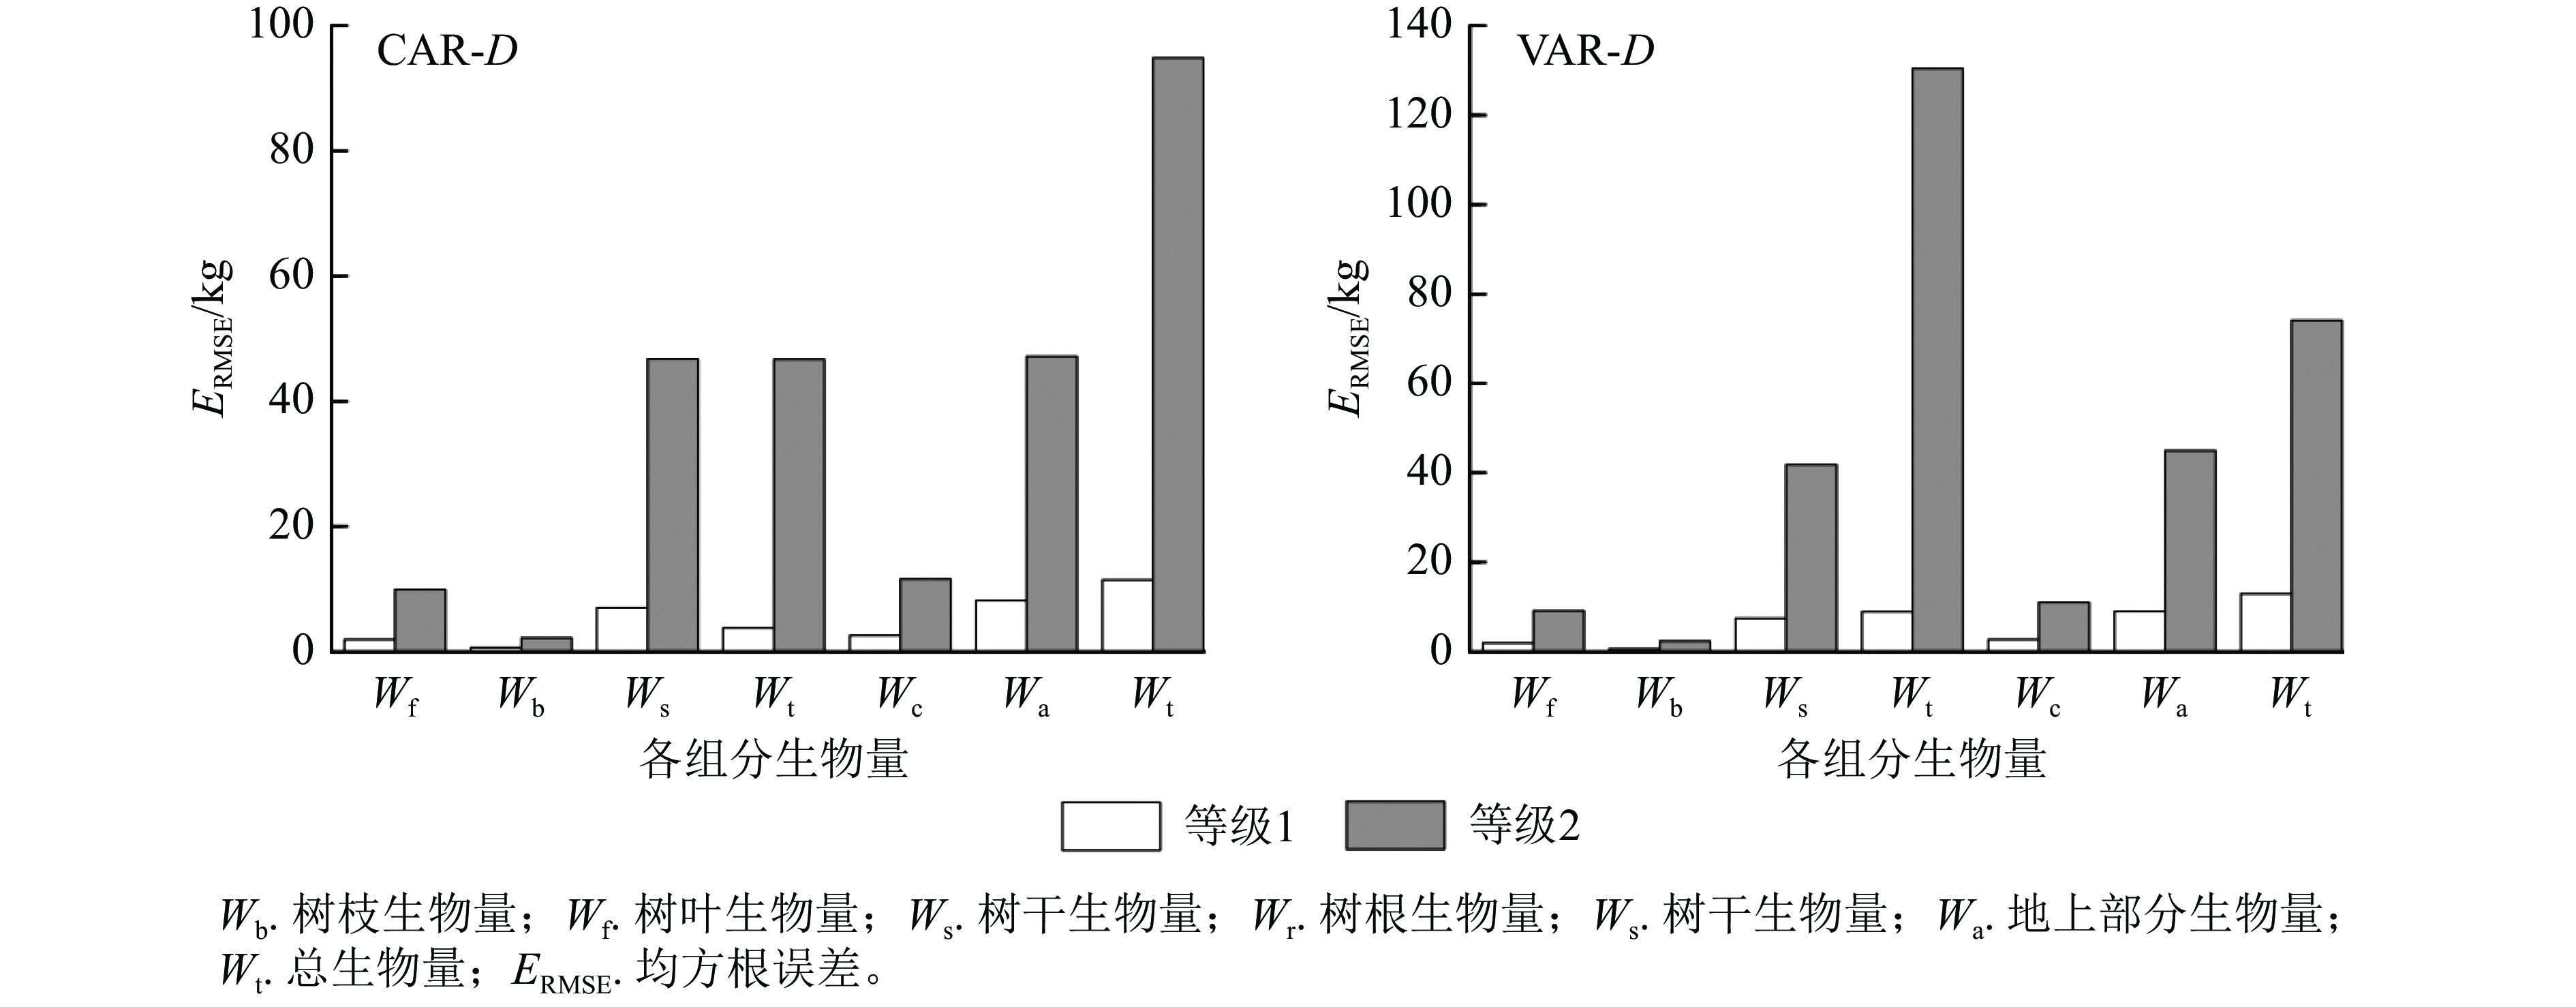
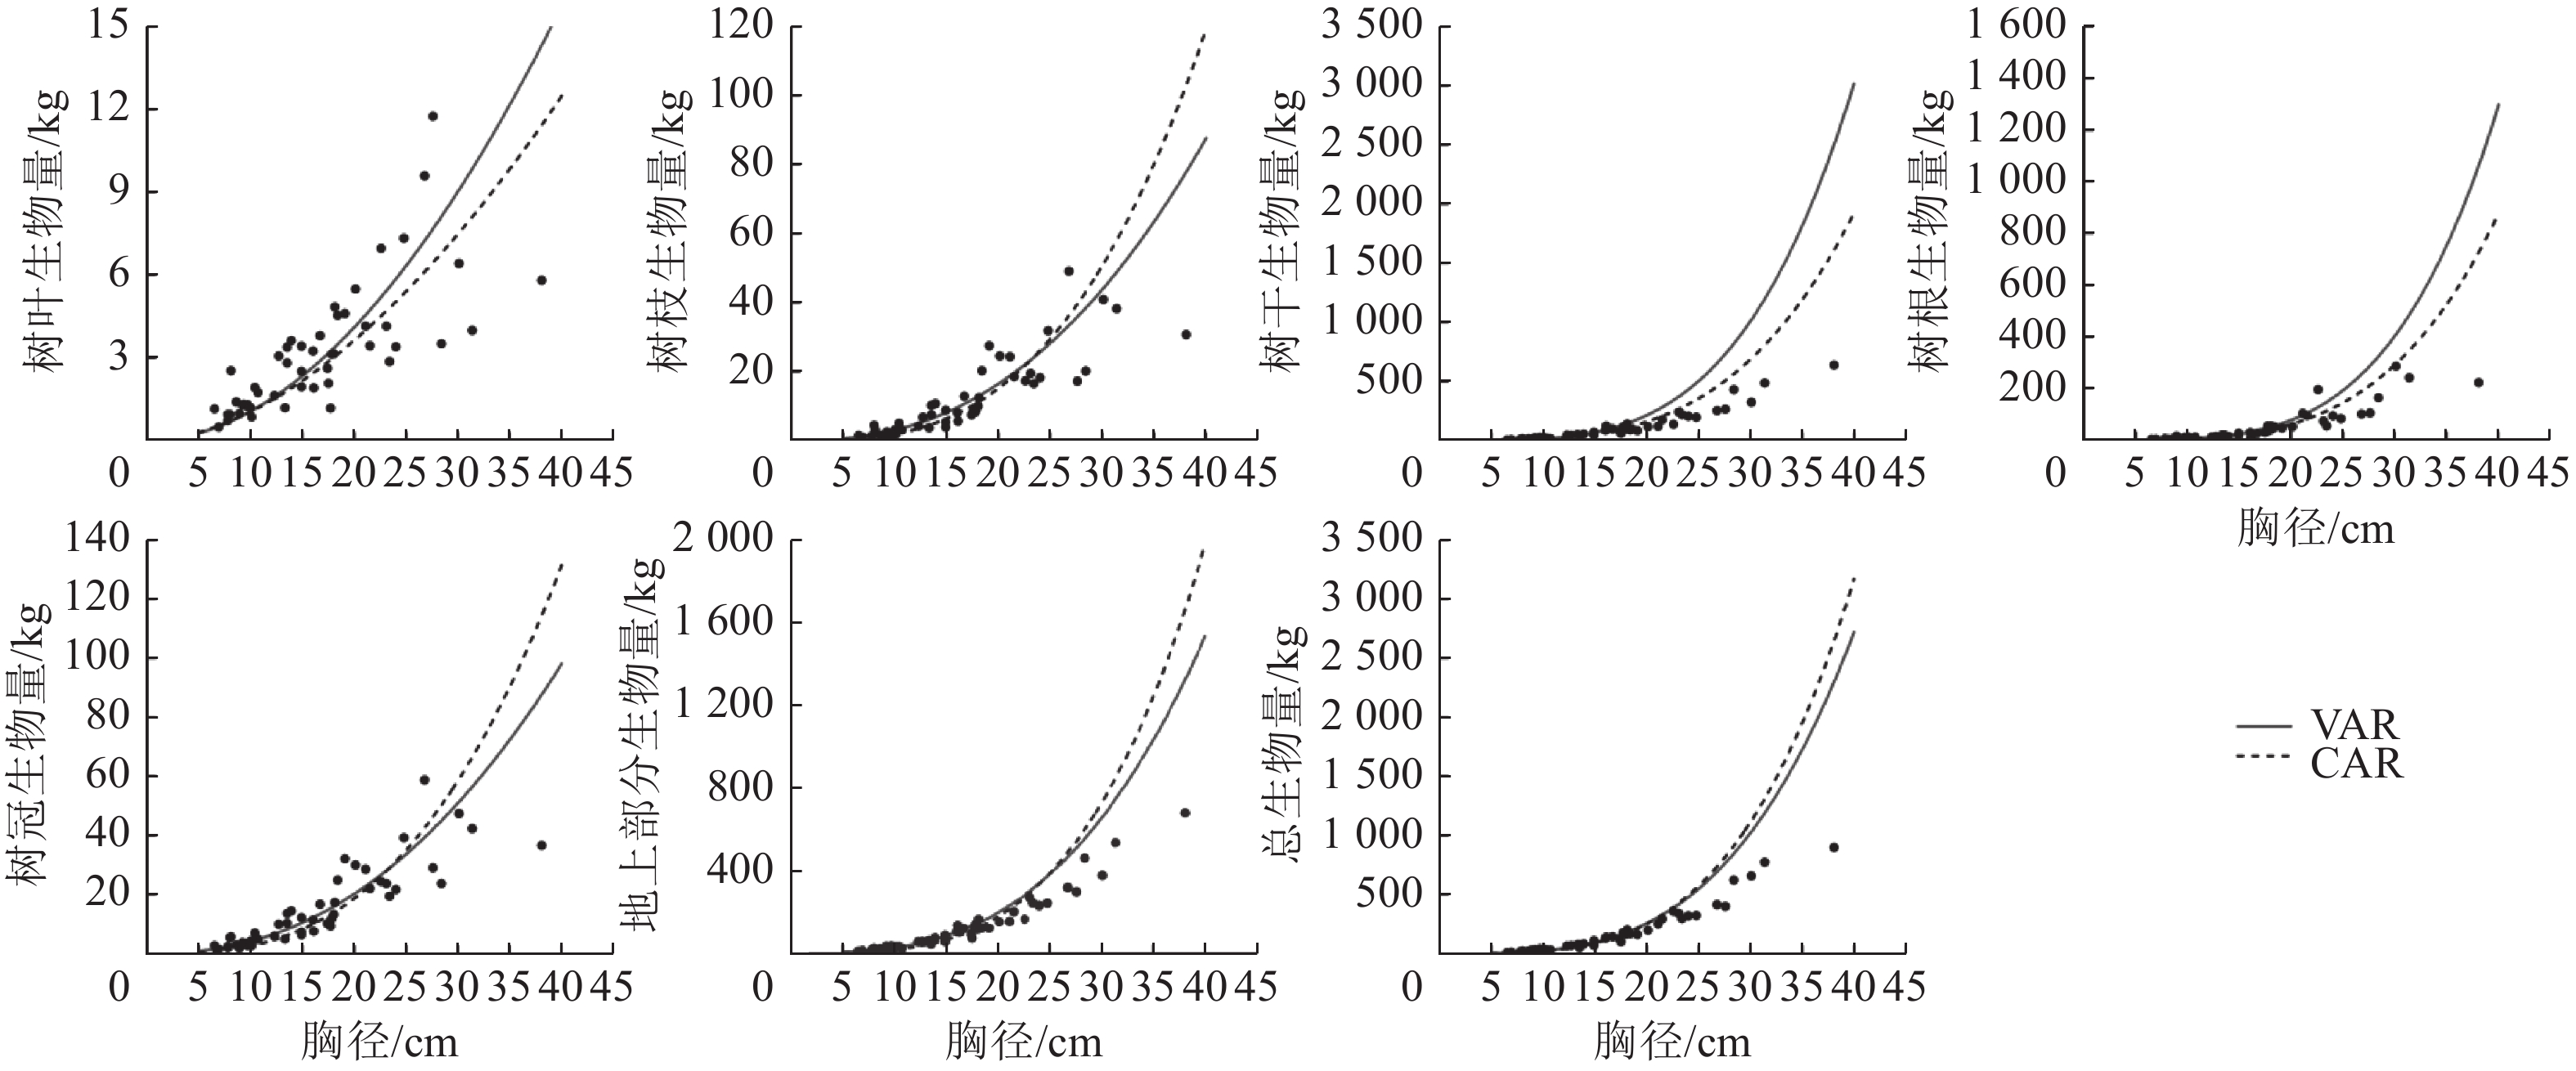
      以本研究建立的CAR、VAR模型参数为基础,模拟林木各组分生物量随胸径的变化(图2),并按照林木株数将林木胸径划分为2个等级,其中等级1为小径级(6~14径阶),等级2为大径级(16~32、38径阶,2 cm为1个径阶),绘制2种模型的一元相容性模型对不同胸径等级林木各组分生物量拟合的均方根误差(图3)。可以看出:2种模型对较小径阶林木拟合效果较为一致,随林木胸径进一步增大,拟合差异愈加显著;2种模型对小径阶林木总生物量及各组分生物量的拟合效果更好,小径阶林木的均方根误差明显小于大径阶林木,大径阶林木的均方根误差比小径阶林木平均高4.8倍。

      Figure 2.  Fitting simulation diagram of the biomass of each part of L. gmelinii by the one-dimensional model of CAR and VAR models

      Figure 3.  Root mean square error of biomass fitting of each component with different DBH grades by one-dimensional model

    • 建立以D2H为变量的2种二元相容性模型,模型参数估计值以及拟合、检验结果见表3。由表3可知:兴安落叶松CAR总生物量及各组分生物量模型的调整后决定系数均大于VAR模型,平均约大0.07;均方根误差均小于VAR模型,平均约小0.090;除树枝和树冠生物量外,CAR模型模拟效率较高或两者相同。表明从调整后决定系数、均方根误差及模拟效果看,CAR二元模型拟合效果优于VAR模型。

      组分 模型 参数估计值 拟合优度 校正因子
      $a^* $ $b^* $ $c^* $ 调整后决定系数 均方根误差 模拟效率
      树枝生物量 CAR
      VAR
      0.005 5 (0.000 2)
      0.004 5 (0.000 2)
      0.8919 (0.004 2)
      0.9229 (0.006 1)
      −0.000 007 (0.000 0) 0.761
      0.757
      0.531
      0.534
      0.766
      0.767
      1.001 3
      1.000 8
      树叶生物量 CAR
      VAR
      0.041 5 (0.003 5)
      0.034 1 (0.003 0)
      0.5091 (0.010 7)
      0.5380 (0.011 2)
      −0.000 005 (0.000 0) 0.589
      0.575
      0.453
      0.460
      0.597
      0.593
      1.000 2
      1.041 3
      树干生物量 CAR
      VAR
      0.010 0 (0.000 2)
      0.008 5 (0.000 3)
      1.0852 (0.002 8)
      1.1096 (0.004 6)
      −0.000 005 (0.000 0) 0.942
      0.939
      0.288
      0.295
      0.943
      0.942
      1.005 8
      1.051 2
      树根生物量 CAR
      VAR
      0.001 8 (0.000 3)
      0.001 4 (0.000 3)
      1.1742 (0.019 6)
      1.2026 (0.023 0)
      0.000 002 (0.000 0) 0.847
      0.843
      0.530
      0.538
      0.851
      0.849
      1.000 6
      1.039 9
      树冠生物量 CAR
      VAR


      0.746
      0.737
      0.487
      0.496
      0.762
      0.764
      1.001 2
      1.001 0
      地上部分生物量 CAR
      VAR


      0.933
      0.928
      0.296
      0.306
      0.940
      0.940
      1.000 1
      1.000 1
      总生物量 CAR
      VAR


      0.935
      0.928
      0.300
      0.316
      0.944
      0.944
      1.013 5
      1.002 8
        说明:括号内数值为参数标准误。−表示无此项。

      Table 3.  Parameter estimation, goodness of fit and validation of two forms of two-dimensional compatible biomass model of L. gmelinii

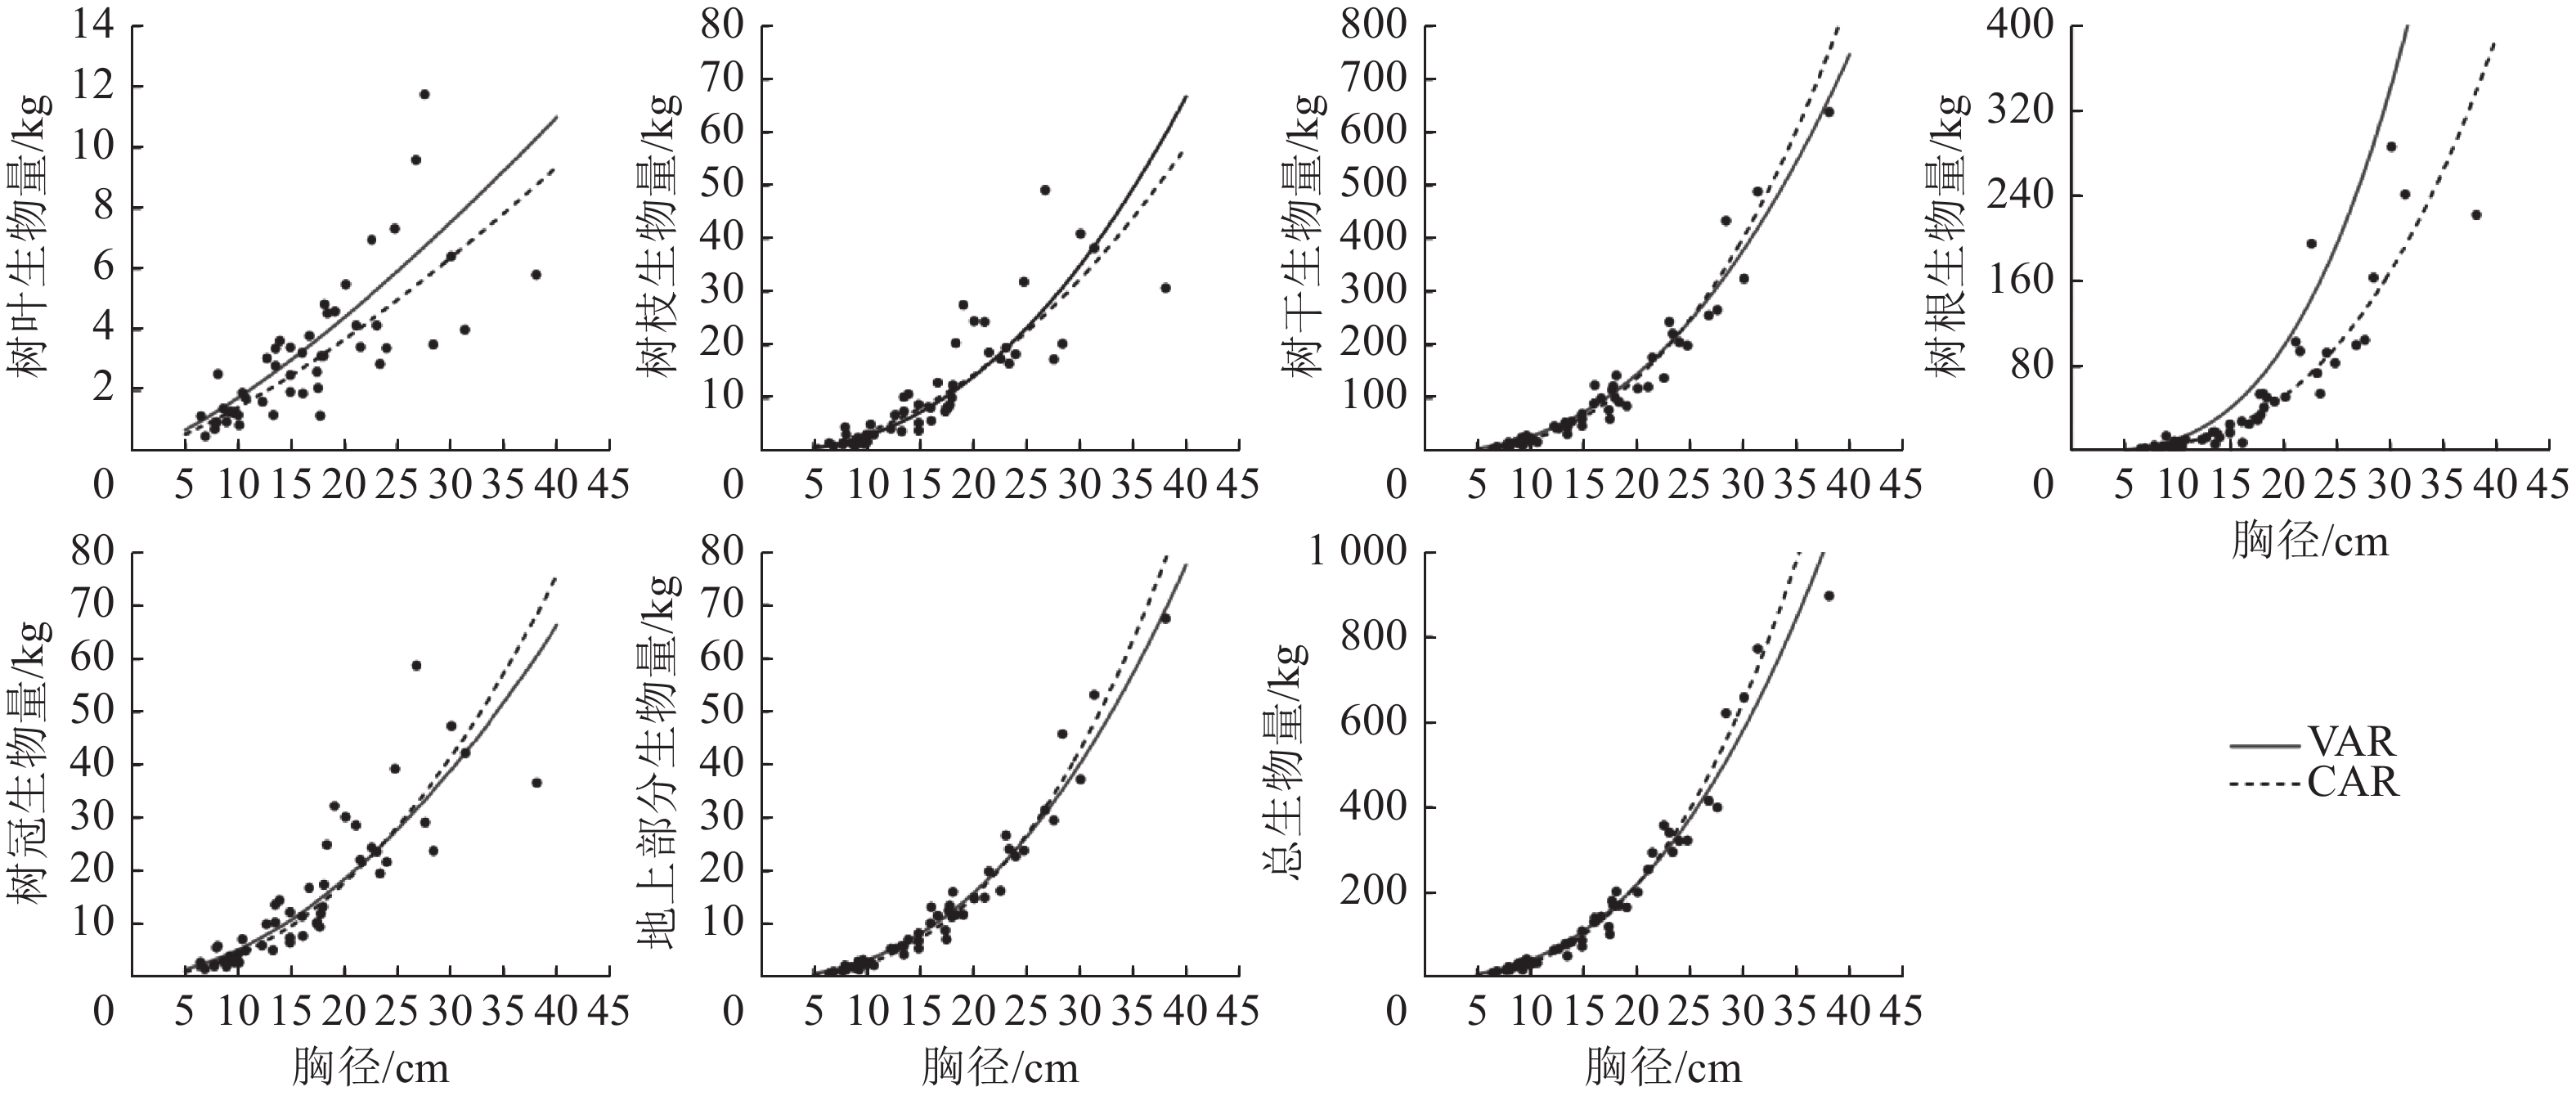
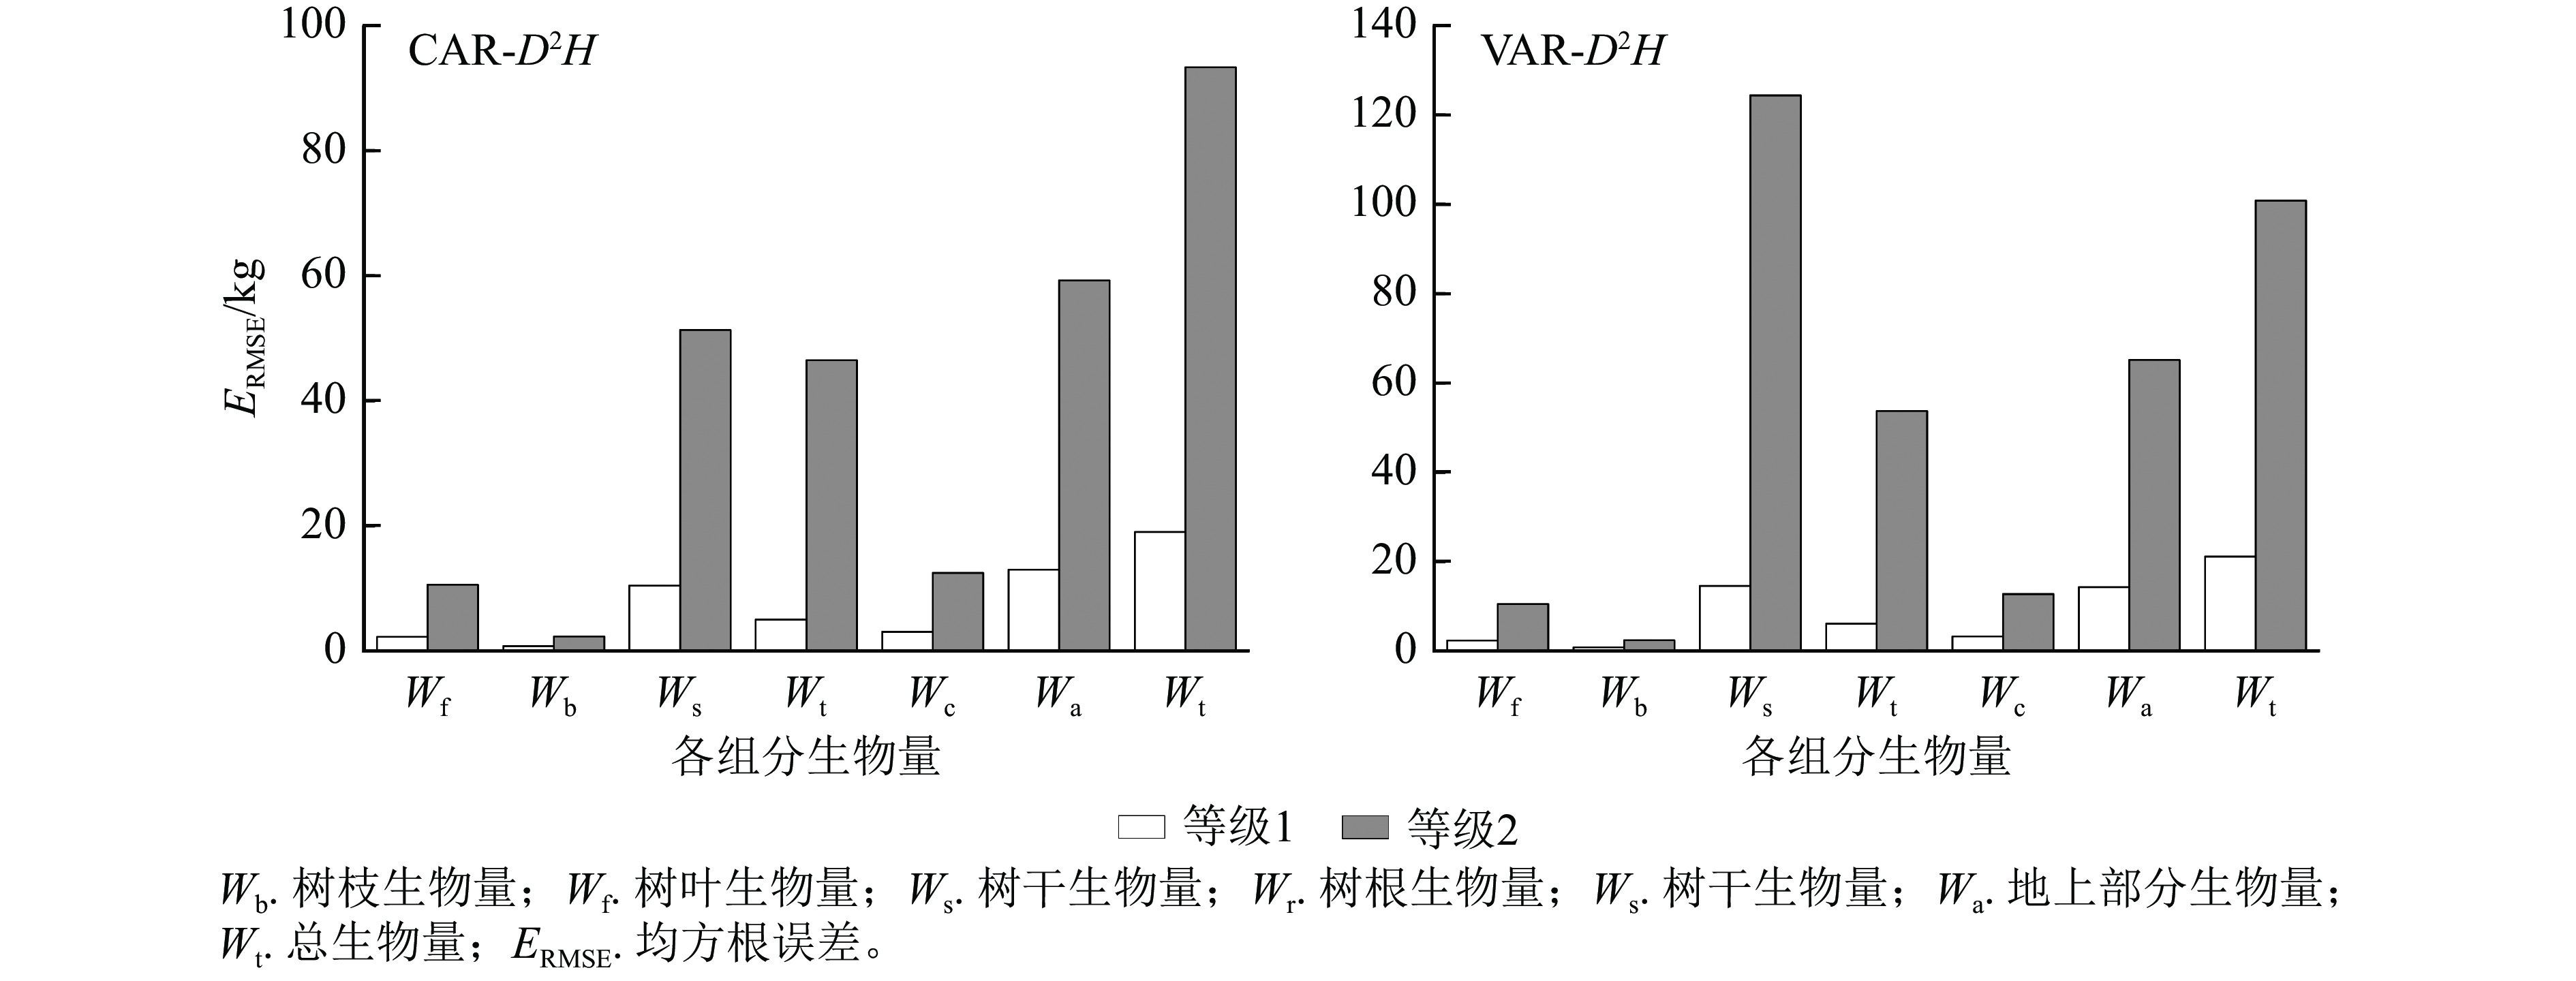
      以董灵波等[27]建立的天然兴安落叶松的树高胸径曲线(Wykoff方程)为基础,采用相同方法得到2种模型形式的二元模型对兴安落叶松各组分生物量的拟合结果(图4)及二元模型对不同胸径等级林木各组分生物量拟合的均方根误差(图5)。随林木胸径进一步增大,2种模型的拟合效果都降低。CAR和VAR二元模型对林分总生物量及各组分生物量的拟合中,大径阶林木的均方根误差均明显高于小径阶林木,表明2种二元模型对小径阶林木的拟合效果均优于大径阶林木。此外,2种模型中树枝、树叶和树冠生物量模型的均方根误相对较小,表明模型对这3个组分生物量的拟合误差较小。

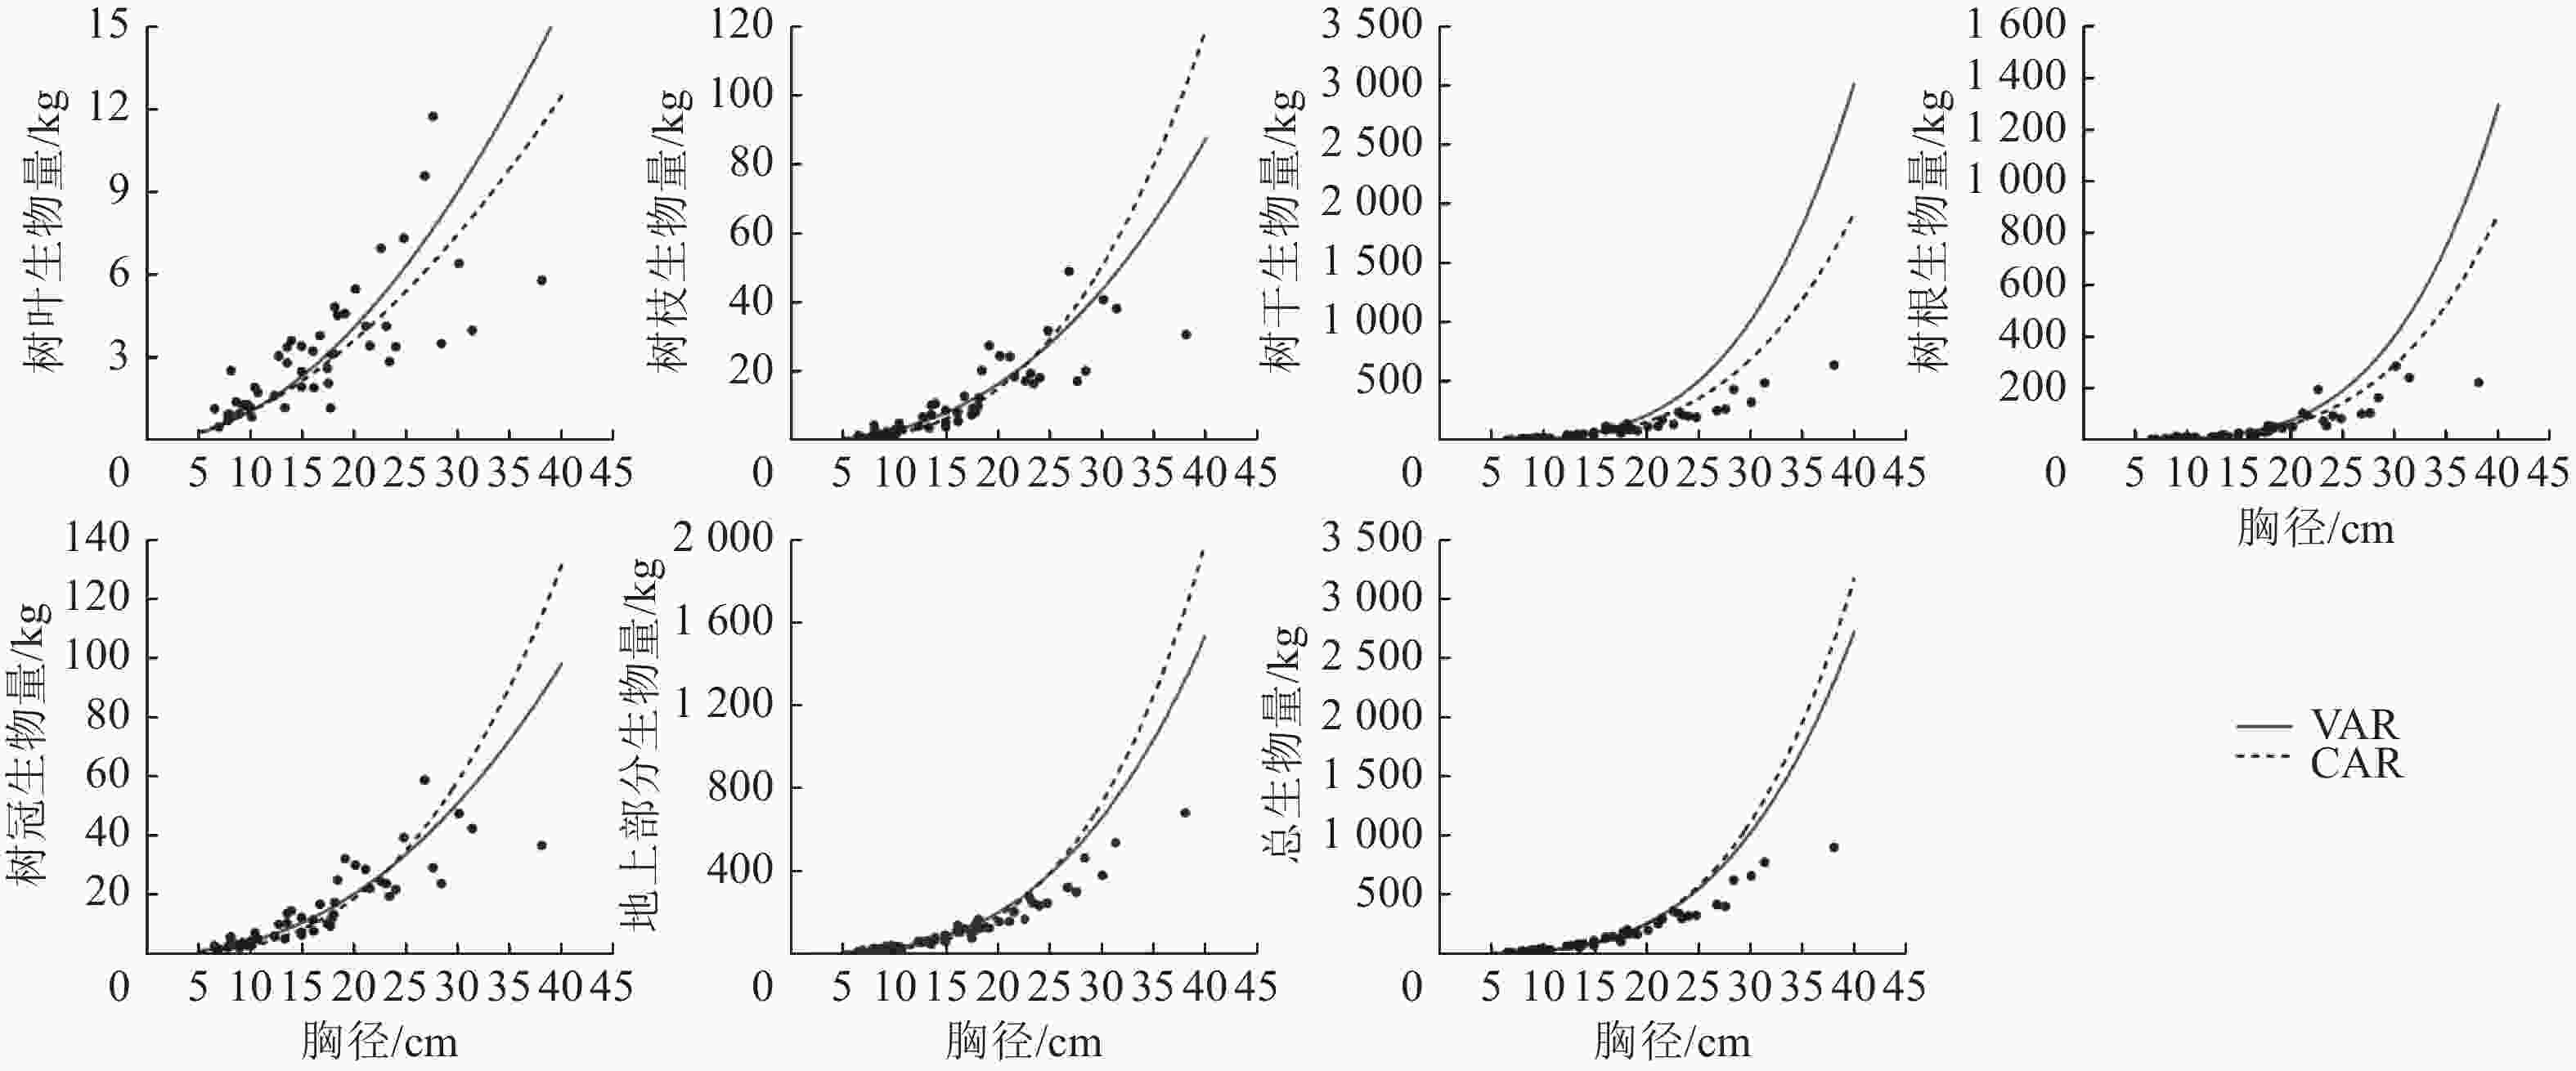
      Figure 4.  Fitting simulation diagram of the biomass of each part for L. gmelinii by the two-dimensional model of CAR and VAR models

      Figure 5.  Root mean square error of biomass fitting of each component with different DBH grades by two-dimensional model

    • CAR模型中的树叶、树根和树干模型的平均预估误差的绝对值小于VAR模型,树枝、树冠和总生物量模型的平均预估误差的绝对值大于VAR模型(表4);CAR模型中的树枝、树叶、树根模型的平均绝对误差小于VAR模型,地上部分生物量和总生物量模型的平均绝对误差大于VAR模型;2种模型的各组分生物量模型的预测精度均大于97.6%,且CAR模型的各组分生物量模型预测精度均较高。从检验指标看CAR模型略优于VAR模型。总的来说,CAR模型的一元相容性模型好于VAR模型。

      组分 模型 平均预估误差 平均绝对误差 预测精度/% 组分 模型 平均预估误差 平均绝对误差 预测精度/%
      树枝生物量 CAR −0.009 0.350 97.90 树冠生物量 CAR 0.006 0.317 97.85
      VAR −0.004 0.352 97.87 VAR −0.004 0.317 97.80
      树叶生物量 CAR −0.003 0.321 97.90 地上部分生物量 CAR 0.002 0.172 97.80
      VAR −0.057 0.327 97.87 VAR −0.002 0.167 97.72
      树干生物量 CAR −0.017 0.213 97.90 总生物量 CAR 0.021 0.152 97.75
      VAR −0.019 0.213 97.87 VAR 0.002 0.149 97.63
      树根生物量 CAR −0.004 0.321 97.90
      VAR −0.068 0.337 97.87

      Table 4.  Test results of two forms of one-dimensional compatible biomass model of L. gmelinii

    • 表5可见:CAR模型中的树叶、树根和地上部分模型检验指标平均预估误差的绝对值小于VAR模型,树枝、树干、树冠和总生物量模型的平均预估误差的绝对值大于VAR模型;CAR模型中林木总生物量及各组分生物量模型检验指标平均绝对误差均小于VAR模型;2种林木各组分生物量模型的预测精度均大于96.9%,且均是CAR模型的各组分生物量模型预测精度更高(表5)。

      组分 模型 平均预估误差 平均绝对误差 预测精度/% 组分 模型 平均预估误差 平均绝对误差 预测精度/%
      树枝生物量 CAR −0.007 0.469 97.31 树冠生物量 CAR 0.007 0.418 97.25
      VAR −0.005 0.474 97.25 VAR 0.006 0.423 9716
      树叶生物量 CAR −0.002 0.393 97.31 地上部分生物量 CAR 0.001 0.225 97.19
      VAR −0.014 0.401 97.25 VAR 0.002 0.228 97.06
      树干生物量 CAR −0.015 0.226 97.31 总生物量 CAR 0.022 0.224 97.13
      VAR −0.014 0.230 97.25 VAR 0.010 0.230 96.94
      树根生物量 CAR −0.002 0.409 97.31
      VAR −0.049 0.415 97.25

      Table 5.  Test results of two forms of two-dimensional compatible biomass model of L. gmelinii

    • 利用模型估算林木生物量具有重要的现实意义。本研究建立的2种林木相对生长模型——CAR模型和VAR模型,在一定程度上都能较好地估算林木生物量。比较而言,CAR模型在拟合优度和预估精度上均优于VAR模型,这与胥辉[28]、姚正阳等[29]的研究结果一致。此外,刘志刚等[30]对华北落叶松L. principis-rupprechtii的研究结果表明:CAR模型对枝和叶生物量的估计是有偏的,而VAR模型的估计基本上无偏,与本研究的结论不一致。可能的原因是这2种模型有各自的适用区域、适用树种,因此,拟合估计不同区域或不同树种林木生物量应该选取不同的模型。本研究中一元模型拟合效果优于二元模型,可能是因为林木总生物量及各组分生物量与D紧密相关,而与D2H的相关性更弱。

      本研究中各模型的拟合效果受林木胸径等级影响。林木胸径分为等级1和等级2,这2种模型的一元模型和二元模型对大径阶林木拟合优度普遍低于较小径阶林木。本研究采用均方根误差来衡量模型对大小径级拟合效果的好坏,均方根误差对建模数据集中的偏离程度较大的离散点非常敏感,即使异常离散点非常少,也会引起均方根误差的明显变差。在这2种模型中,大径阶林木与小径阶林木拟合优度差异明显可能是因为数据集中存在异常离散点。一般来说,变量值平均水平越高,其离散程度越大,反之越小,因此,随着林木径阶的增大,生物量的离散程度也随之增加,即大径阶林木更容易出现异常离散点。鉴于数据中34~38径阶的林木只有1株且为38径阶,可能会影响到分级后的拟合效果对比,故剔除38径阶的数据,重新划分胸径等级,其中等级1为小径级(6~14径阶)、等级2为大径级(16~32,2 cm为1个径阶)。结果表明:剔除最大值后,2种模型的拟合效果均仍以小径阶林木为更好,但较剔除前,均方根误差整体呈下降趋势。

      本研究林木的平均胸径约为16 cm,26~38径阶的林木只有6株,所建立的模型在理论上应更偏向于适用胸径小于26 cm的林木,对大径阶林木尤其是26径阶以上的林木不太适用。因此,当以本研究所建立的模型参数为基础拟合胸径等级2的林木时,会降低该等级中的大径阶林木的拟合优度,即当数据集较小时,林木的胸径分布会影响所建立模型对不同胸径等级的适合度。二元模型在拟合生物量时,需要通过树高-胸径模型(本研究选用Wykoff方程)推算林木树高,而该模型精度有限,从而进一步引入误差。本研究中的二元模型的拟合优度普遍低于一元模型,可能是此原因所致。此外,本研究根据全部数据建立的模型更适用于小径阶林木,因此或可通过林木胸径分级,建立适用不同径阶大小的模型;或通过进一步优化模型形式,设计出适用于大径阶林木的单木生物量模型,提高拟合精度。许多研究报道,相对生长模型不能很好地拟合所有的观测数据,这一问题在估算大树生物量时尤其突出,说明相对生长模型的适用性有限[31]。今后可从优化初始模型入手,进一步提升模型的预估能力。

    • 本研究以兴安落叶松林为研究对象,探讨了CAR和VAR不同相对生长模型预估精度的差异。从模型拟合效果和预测能力来看,一元模型和二元模型均表现为CAR模型优于VAR模型;这2种模型的一元模型和二元模型拟合优度均与林木胸径等级有关,均是小径阶林木的拟合效果更佳;一元模型和二元模型中,树枝、树叶和树冠生物量模型误差均较小,拟合效果更好。总的来说,CAR模型不仅形式上更简单,而且拟合效果和估计精度与VAR相比也更佳。

Reference (31)

Catalog

    /

    DownLoad:  Full-Size Img  PowerPoint
    Return
    Return