Volume 42 Issue 4
Aug.  2025
Turn off MathJax
Article Contents

GAO Qingyan, PAN Yujun, WU Shihai, et al. Multi-scenarios simulation of land use and habitat quality change in the source area of Pearl River[J]. Journal of Zhejiang A&F University, 2025, 42(4): 825−834 doi:  10.11833/j.issn.2095-0756.20240614
Citation: GAO Qingyan, PAN Yujun, WU Shihai, et al. Multi-scenarios simulation of land use and habitat quality change in the source area of Pearl River[J]. Journal of Zhejiang A&F University, 2025, 42(4): 825−834 doi:  10.11833/j.issn.2095-0756.20240614

Multi-scenarios simulation of land use and habitat quality change in the source area of Pearl River

DOI: 10.11833/j.issn.2095-0756.20240614
  • Received Date: 2024-11-19
  • Accepted Date: 2025-04-28
  • Rev Recd Date: 2025-04-24
  • Available Online: 2025-08-01
  • Publish Date: 2025-08-01
  •   Objective  The study is to analyze and simulate land use and habitat quality in Qujing City, so as to provide scientific basis for the spatial allocation of regional land resources and ecological construction.   Method  Based on the land use data of 1980, 2000 and 2020, the land use changes from 1980 to 2020 in Qujing City were analyzed. And PLUS-InVEST model, combined with the transfer matrix, multi-scenario simulation and habitat quality evaluation methods, were comprehensively used to analyze the spatio-temporal dynamic changes of land use and habitat quality in 2040, and summarize the driving mechanism.   Result  Grassland and forestland in mountainous, cultivated land and construction land in dam together constituted the land types in Qujing City. Among them, grassland and forest land were the main types, accounting for more than 72%. From 2000 to 2040, habitat quality showed a downward trend overall, but the area of high-grade habitats was increasing. Habitat quality was closely related to the spatial distribution of land use, and showed a “mountain-dam” and “lock-in” effect, which was high in the north and low in the south. The northern part of Qujing City was the hot spot concentration area of habitat quality, and the southern part was the cold spot concentration area. Ecological protection scenario was more suitable than the others for regional development needs, the contribution of watersheds to habitat quality was small but extremely important for Qujing City.   Conclusion  In the future, the restoration of degraded areas of forest and grassland in mountainous areas should be strengthened to alleviate ecological degradation. Strengthening the protection and construction of ecological land in the dam area is a important way to improve the level of habitat quality. Moderately increasing the area of water land is the best way to slow down the decline of regional habitat quality. [Ch, 4 fig. 6 tab. 33 ref.]
  • [1] WANG Tong, ZHANG Chao, ZHOU Hang.  Aboveground biomass estimation of major coniferous forests in Qujing City based on Landsat images . Journal of Zhejiang A&F University, 2025, 42(6): 1132-1141. doi: 10.11833/j.issn.2095-0756.20250395
    [2] ZHANG Juan, ZHAO Runjiang, LEI Jinrui, LIN Chuanxiang, WANG Zeyu, HUANG Jiajian.  Spatio-temporal evolution of habitat quality in Haikou from 2000 to 2020 based on InVEST model . Journal of Zhejiang A&F University, 2025, 42(2): 383-392. doi: 10.11833/j.issn.2095-0756.20240358
    [3] WANG Xiangfu, LI Yuanhui, WANG Weifeng, SUN Jiejie, WANG Qian, DONG Wenting, WANG Rongnü, YANG Yaqi.  Impact of land use and climate change on potential suitable habitats of snow leopards (Panthera uncia) in Qinghai Province . Journal of Zhejiang A&F University, 2024, 41(3): 526-534. doi: 10.11833/j.issn.2095-0756.20230259
    [4] PAN Ting, WANG Yixiang, LIU Xianzhao, XU Chengli, LIU Zhijun.  Land use change and its impact on ecological quality in Xiong’an New Area . Journal of Zhejiang A&F University, 2023, 40(5): 1102-1110. doi: 10.11833/j.issn.2095-0756.20220596
    [5] ZUO Qilin, YU Yang, ZHA Tonggang, ZHANG Hengshuo, LIANG Yipeng, OUYANG Jiahuan.  Soil quality assessment of different land use types in Qingshui River Basin of western Shanxi Province . Journal of Zhejiang A&F University, 2023, 40(4): 801-810. doi: 10.11833/j.issn.2095-0756.20220498
    [6] CHEN Xi, YE Kemo, LI Kun, JIN Yang.  Research on land use change and risk-value of “production-living-ecological space” in a resource-based city . Journal of Zhejiang A&F University, 2023, 40(5): 1111-1120. doi: 10.11833/j.issn.2095-0756.20220666
    [7] YANG Dongwei, ZHANG Jianqiang, HUANG Xuebin, ZHANG Mingkui.  Spatiotemporal differentiation of organic carbon in upland soils converted from paddy field under the leisure agriculture tourism background in Zhejiang Province . Journal of Zhejiang A&F University, 2022, 39(6): 1296-1302. doi: 10.11833/j.issn.2095-0756.20210607
    [8] JIA Yujie, LIU Yungen, YANG Silin, WANG Yan, ZHANG Chao, XU Hongfeng, ZHENG Shujun.  Applicability of land use classification method in Dali City based on Sentinel-2A image . Journal of Zhejiang A&F University, 2022, 39(6): 1350-1358. doi: 10.11833/j.issn.2095-0756.20220134
    [9] LI Wenhao, SHEN Jun.  Spatio-temporal variation of farmland fragmentation in water net plain area . Journal of Zhejiang A&F University, 2021, 38(4): 723-729. doi: 10.11833/j.issn.2095-0756.20200682
    [10] CAO Jiashuo, DENG Zhengyu, HU Yuandong, WU Yan.  Spatial and temporal evolution and driving forces of the landscape pattern in Shennongjia Forestry District . Journal of Zhejiang A&F University, 2021, 38(1): 155-164. doi: 10.11833/j.issn.2095-0756.20200279
    [11] CUI Yanglin, GAO Xiang, DONG Bin, WEI Huimin.  Landscape ecological risk assessment of county . Journal of Zhejiang A&F University, 2021, 38(3): 541-551. doi: 10.11833/j.issn.2095-0756.20200461
    [12] SUN Min, CHEN Jian, LIN Xintao, YANG Shan.  Urban landscape patterns and PM2.5 pollution . Journal of Zhejiang A&F University, 2018, 35(1): 135-144. doi: 10.11833/j.issn.2095-0756.2018.01.018
    [13] DUAN Yanbo, LEI Yakai, MA Ge, WU Baojun, TIAN Guohang.  Spatio-temporal dynamics of ecosystem service value in Zhengzhou . Journal of Zhejiang A&F University, 2017, 34(3): 511-519. doi: 10.11833/j.issn.2095-0756.2017.03.017
    [14] YU Jing-fang, YU Shu-quan, ZHANG Chao, LI Tu-sheng.  Net primary productivity estimates for Zhejiang Province based on the CASA model . Journal of Zhejiang A&F University, 2012, 29(4): 473-481. doi: 10.11833/j.issn.2095-0756.2012.04.001
    [15] HUI Shu-rong, WANG Jiao, ZHANG Qian, WEI Zhong-ping, LIU Yang.  Soil-water dynamics with different agroforestry planting combinations on sandy lands in northwestern Liaoning Province . Journal of Zhejiang A&F University, 2010, 27(4): 579-584. doi: 10.11833/j.issn.2095-0756.2010.04.017
    [16] WU Jian, PENG Dao-li.  Technology of land use remote sensing information extraction in Duolun County . Journal of Zhejiang A&F University, 2010, 27(3): 417-423. doi: 10.11833/j.issn.2095-0756.2010.03.016
    [17] GU Lei, WU Chun-jun, WANG Xin.  Land utilization pattern changing and driving force analysis based on remote sensing data in Lin’an . Journal of Zhejiang A&F University, 2009, 26(6): 870-876.
    [18] CAO Yin-gui, ZHOU Wei, CHENG Ye, XU Ning, HAO Yin.  A review of land use and land cover changes in China . Journal of Zhejiang A&F University, 2007, 24(5): 633-637.
    [19] LIU Shou-zan, GUO Sheng-li, BAI Yan.  Changes in soil organic carbon under different land use types in slope land in gully region of Loess Plateau . Journal of Zhejiang A&F University, 2005, 22(5): 490-494.
    [20] JIANG Wen-wei, GUAN Yu, LIU Tong, ZHOU Guo-mo, SHEN Zhen-ming.  Forecast of land use pattern change in Anji County of Zhejiang : an application of Markov process . Journal of Zhejiang A&F University, 2004, 21(3): 309-312.
  • [1]
    HU An’gang, HUANG Xin. Chinese-style modernization and green development [J]. Journal of Beijing University of Technology (Social Sciences Edition), 2024, 24(5): 1−20.
    [2]
    WANG Baixue, CHENG Weiming. Effects of land use/cover on regional habitat quality under different geomorphic types based on InVEST model[J/OL]. Remote Sensing, 2022, 14(5): 1279[2024-11-01]. DOI: 10.3390/rs14051279.
    [3]
    CHEN Zhu’an, LIU Ziqiang, ZHANG Liting, et al. Multi-scenario simulation of LUCC and spatio-temporal evolution and prediction of habitat quality in Nanchang City [J]. Transactions of the Chinese Society for Agricultural Machinery, 2023, 54(5): 170−180.
    [4]
    HE Chunyang, ZHANG Jinxi, LIU Zhifeng, et al. Characteristics and progress of land use/cover change research during 1990−2018[J]. Acta Geographica Sinica, 2021, 76(11): 2730−2748.
    [5]
    ZHAI Yuxin, ZHANG Feiyun, MA Li’na. Evolution and prediction of habitat quality in the Bosten Lake Basin based on production-living-ecological space [J]. Arid Land Geography, 2023, 46(11): 1792−1802.
    [6]
    CHEN Yan, WU Rui, MA Yuewei, et al. Spatial and temporal differentiation and simulation of habitat quality in typical karst areas [J]. Journal of Ecology and Rural Environment, 2022, 38(12): 1593−1603.
    [7]
    LAI Zhiyong, LIAO Fuqiang, SHU Xiaobo, et al. Spatio-temporal evolution and prediction of habitat quality in Ganjiang River Basin [J]. Resources and Environment in the Yangtze Basin, 2024, 33(10): 2236−2250.
    [8]
    WU Linlin, SUN Caige, FAN Fenglei. Estimating the characteristic spatiotemporal variation in habitat quality using the InVEST model—a case study from Guangdong-Hong Kong-Macao Greater Bay Area[J/OL]. Remote Sensing, 2021, 13(5): 1008[2024-11-01]. DOI: 10.3390/rs13051008.
    [9]
    PASHANEJAD E, THIERRY H, ROBINSON B E, et al. The application of semantic modelling to map pollination service provisioning at large landscape scales[J/OL]. Ecological Modelling, 2023, 484: 110452[2024-11-01]. DOI: 10.1016/j.ecolmodel.2023.110452.
    [10]
    MENG Qinglin, LI Mingyu, REN Chunying, et al. Dynamic assessment of habitat quality in eastern Jilin Province based on HSI model [J]. Remote Sensing for Land & Resources, 2019, 31(3): 140−147.
    [11]
    CHEN Le, WEI Wei. Spatiotemporal changes in land use and habitat quality in a typical dryland watershed of northwest China [J]. Ecology and Environmental Sciences, 2022, 31(9): 1909−1918.
    [12]
    GUO Tingting, DING Hongwei, ZHANG Hao, et al. Research and prospects on ecosystem services and trade-offs/synergies relationships in the karst regions of southwestern China [J]. Journal of Natural Resources, 2024, 39(6): 1384−1398.
    [13]
    ZHANG Juan, ZHAO Runjiang, LEI Jinrui, et al. Spatio-temporal evolution of habitat quality in Haikou from 2000 to 2020 based on InVEST model [J]. Journal of Zhejiang A&F University, 2025, 42(2): 383−392.
    [14]
    TANG Jiaojiao, YU Cheng, ZHANG Weiwei, et al. Habitat quality assessment and prediction in Suzhou based on CLUE-S and InVEST models [J]. Journal of Environmental Engineering Technology, 2023, 13(1): 377−385.
    [15]
    XU Jing, LIU Hui. Assessment and prediction of ecosystem services trade-offs and synergies relationships in Gansu Province [J]. China Environmental Science, 2024, 44(4): 1863−1874.
    [16]
    YANG Jie, XIE Baopeng, ZHANG Degang, et al. Habitat quality assessment and multi-scenario prediction of the Gansu-Qinghai section of the Yellow River Basin based on the FLUS-InVEST model[J/OL]. Frontiers in Ecology and Evolution, 2023, 11: 1228558[2024-11-01]. DOI: 10.3389/fevo.2023.1228558.
    [17]
    WANG Jiangbo, WU Yufan, GOU Aiping. Habitat quality evolution characteristics and multi-scenario prediction in Shenzhen based on PLUS and InVEST models[J/OL]. Frontiers in Environmental Science, 2023, 11: 1146347[2024-11-01]. DOI: 10.3389/fenvs.2023.1146347.
    [18]
    JIANG Xiaofang, DUAN Hanchen, LIAO Jie, et al. Land use in the Gan-Lin-Gao region of middle reaches of Heihe River Basin based on a PLUS-SD coupling model [J]. Arid Zone Research, 2022, 39(4): 1246−1258.
    [19]
    WANG Jia, ZHANG Junping, XIONG Nina, et al. Spatial and temporal variation, simulation and prediction of land use in ecological conservation area of western Beijing[J/OL]. Remote Sensing, 2022, 14(6): 1452[2024-11-01]. DOI: 10.3390/rs14061452.
    [20]
    WEI Qianqian, ABUDUREHEMAN M, HALIKE A, et al. Temporal and spatial variation analysis of habitat quality on the PLUS-InVEST model for Ebinur Lake Basin, China[J/OL]. Ecological Indicators, 2022, 145: 109632[2024-11-01]. DOI: 10.1016/j.ecolind.2022.109632.
    [21]
    YANG Ling, WANG Jinlong, ZHOU Wenqiang. Coupling evolution analysis of LUCC and habitat quality in Dongting Lake Basin based on multi-scenario simulation [J]. China Environmental Science, 2023, 43(2): 863−873.
    [22]
    ZHANG Ting, HU Yuzhu, HU Haihui, et al. Prediction of land use and habitat quality in Harbin City based on the PLUS-InVEST model [J]. Environmental Science, 2024, 45(8): 4709−4721.
    [23]
    YU Han, WU Yingmei, LI Chen, et al. Spatial and temporal evolution and multi-scenario modeling of land use and habitat quality in highland mountainous urban agglomeration of central Yunnan, Southwest China [J]. Chinese Journal of Applied Ecology, 2024, 35(10): 2842−2852.
    [24]
    CHEN Yan, MA Yuewei, PAN Jianfeng, et al. Ecological network construction of mountainous cities considering rocky desertification sensitivity: a case study of Qujing City, Yunnan Province [J]. Acta Ecologica Sinica, 2023, 43(17): 7060−7071.
    [25]
    FAN Chunmiao, WANG Zhitai, TANG Na, et al. Construction of ecological network in downtown of Guiyang City based on morphologically spatial pattern and spatially principal component analysis [J]. Acta Ecologica Sinica, 2022, 42(16): 6620−6632.
    [26]
    LIU Jiyuan, NING Jia, KUANG Wenhui, et al. Spatio-temporal patterns and characteristics of land-use change in China during 2010−2015 [J]. Acta Geographica Sinica, 2018, 73(5): 789−802.
    [27]
    ZHANG Xueru, ZHOU Jie, LI Mengmei. Analysis on spatial and temporal changes of regional habitat quality based on the spatial pattern reconstruction of land use [J]. Acta Geographica Sinica, 2020, 75(1): 160−178.
    [28]
    SUN Xiaoyin, JIANG Zhai, LIU Fei, et al. Monitoring spatio-temporal dynamics of habitat quality in Nansihu Lake basin, eastern China, from 1980 to 2015 [J]. Ecological Indicators, 2019, 102: 716−723.
    [29]
    LIANG Xun, GUAN Qingfeng, CLARKE K C, et al. Understanding the drivers of sustainable land expansion using a patch-generating land use simulation (PLUS) model: a case study in Wuhan, China[J/OL]. Computers, Environment and Urban Systems, 2021, 85: 101569[2024-11-01]. DOI: 10.1016/j.compenvurbsys.2020.101569.
    [30]
    WU Kexin, SHUI Wei, XUE Chengzhi, et al. Spatiotemporal responses of habitat quality to land use changes in the source area of Pearl River, China [J]. Chinese Journal of Applied Ecology, 2023, 34(1): 169−177.
    [31]
    CHEN Cheng, LI Yaqiang, YANG Donghao, et al. Spatiotemporal dynamic changes of land use and vegetation coverage in northern Yunnan [J]. Journal of Northeast Forestry University, 2022, 50(10): 101−107.
    [32]
    ZHOU Junxin, CAI Meifang, HUANG Zhiqiang, et al. Spatio-temporal evolution characteristics and prediction of habitat quality in Jiangxi Province [J]. Acta Ecologica Sinica, 2023, 43(18): 7623−7636.
    [33]
    SUI Lu, YAN Zhiming, LI Kaifang, et al. Prediction of habitat quality in the Ili River Valley under the influence of human activities and climate change [J]. Arid Land Geography, 2024, 47(1): 104−116.
  • 加载中
通讯作者: 陈斌, bchen63@163.com
  • 1. 

    沈阳化工大学材料科学与工程学院 沈阳 110142

  1. 本站搜索
  2. 百度学术搜索
  3. 万方数据库搜索
  4. CNKI搜索

Figures(4)  / Tables(6)

Article views(599) PDF downloads(29) Cited by()

Related
Proportional views

Multi-scenarios simulation of land use and habitat quality change in the source area of Pearl River

doi: 10.11833/j.issn.2095-0756.20240614

Abstract:   Objective  The study is to analyze and simulate land use and habitat quality in Qujing City, so as to provide scientific basis for the spatial allocation of regional land resources and ecological construction.   Method  Based on the land use data of 1980, 2000 and 2020, the land use changes from 1980 to 2020 in Qujing City were analyzed. And PLUS-InVEST model, combined with the transfer matrix, multi-scenario simulation and habitat quality evaluation methods, were comprehensively used to analyze the spatio-temporal dynamic changes of land use and habitat quality in 2040, and summarize the driving mechanism.   Result  Grassland and forestland in mountainous, cultivated land and construction land in dam together constituted the land types in Qujing City. Among them, grassland and forest land were the main types, accounting for more than 72%. From 2000 to 2040, habitat quality showed a downward trend overall, but the area of high-grade habitats was increasing. Habitat quality was closely related to the spatial distribution of land use, and showed a “mountain-dam” and “lock-in” effect, which was high in the north and low in the south. The northern part of Qujing City was the hot spot concentration area of habitat quality, and the southern part was the cold spot concentration area. Ecological protection scenario was more suitable than the others for regional development needs, the contribution of watersheds to habitat quality was small but extremely important for Qujing City.   Conclusion  In the future, the restoration of degraded areas of forest and grassland in mountainous areas should be strengthened to alleviate ecological degradation. Strengthening the protection and construction of ecological land in the dam area is a important way to improve the level of habitat quality. Moderately increasing the area of water land is the best way to slow down the decline of regional habitat quality. [Ch, 4 fig. 6 tab. 33 ref.]

GAO Qingyan, PAN Yujun, WU Shihai, et al. Multi-scenarios simulation of land use and habitat quality change in the source area of Pearl River[J]. Journal of Zhejiang A&F University, 2025, 42(4): 825−834 doi:  10.11833/j.issn.2095-0756.20240614
Citation: GAO Qingyan, PAN Yujun, WU Shihai, et al. Multi-scenarios simulation of land use and habitat quality change in the source area of Pearl River[J]. Journal of Zhejiang A&F University, 2025, 42(4): 825−834 doi:  10.11833/j.issn.2095-0756.20240614
  • 中国“十四五”规划强调绿色发展是人与自然和谐共生的重要路径,是守住生态安全的有效路径[1],其中,生境质量对维护区域生态安全、促进人与自然和谐共生极为重要[2]。土地利用是影响生境质量的重要因素[3],基于土地利用变化的生境质量模拟已成为环境科学及生态学研究的前沿热点[4]。但基于多情景土地利用下的生境质量预测研究相对不足[5],尤其是典型喀斯特地区的研究较少[6]。云南省曲靖市作为珠江源区典型喀斯特城市,滇中城市群的组成部分及省级副中心城市,其发展会对土地资源和生态环境产生巨大的压力。因此,科学研究曲靖市土地利用变化,预测其生境质量,对构建区域生态安全格局、提升人类福祉[7],推进喀斯特生态脆弱区可持续发展具有重要意义。

    生境质量评价模型有InVEST[7]、ARIES[89]、HIS[10]等。其中,InVEST模型仅需土地利用数据及威胁源就可以评价[11],已成为最常用且效果最好的模型[12]。目前,多情景下生境质量模拟研究已成为取代以历史时期生境质量评估为主的重要范式[13]。当前已有CLUE-InVEST[14]、MOP-InVEST[15]、FLUS-InVEST[16]、PLUS-InVEST[17]等模型,用于多情景下生境质量预测研究。其中,PLUS模型对土地利用变化模拟精度更高,所以PLUS-InVEST模型结合的生境质量模拟精度明显高于其他模型[1819],已成为主流范式。WEI等[20]认为生态保护情景下艾比湖流域整体生境质量较高;杨伶等[21]认为可持续发展情景为洞庭湖流域空间格局优化的最佳路径;张廷等[22]认为生态保护情景能增加较高及高等级生境质量面积;虞涵等[23]认为生态保护情景更适合滇中城市群发展;陈艳等[6]发现生态保护情景有助于典型喀斯特区的发展。整体看,已有生境质量预测研究集中于流域或城市群地区,而以山地为主的喀斯特生态脆弱区则有待深入研究。此外,在情景模拟的限制图层设置时,已有研究较少考虑海拔对土地利用及生境质量的影响。

    喀斯特是中国典型的环境脆弱区之一[12],集中分布在中国西南。曲靖市作为典型山区喀斯特城市[24],位于珠江源头区。区内潜在石漠化面积大,平坝小,城市扩张受限,环境承载力低[25]。近年高频的气象干旱,长期矿业开发、坝区农业发展、城镇化推进,致使区域生态环境脆弱性日益加剧,严重阻碍城市社会、经济的高质量发展。因此,以珠江源头区的曲靖市为例,基于1980、2000、2020年的土地利用数据,运用PLUS模型模拟2040年不同情景下的土地利用变化,并借助InVEST模型进行生境质量评估,揭示其时空演化特征,以期为喀斯特地区土地利用的科学配置及生态环境建设提供科学依据。

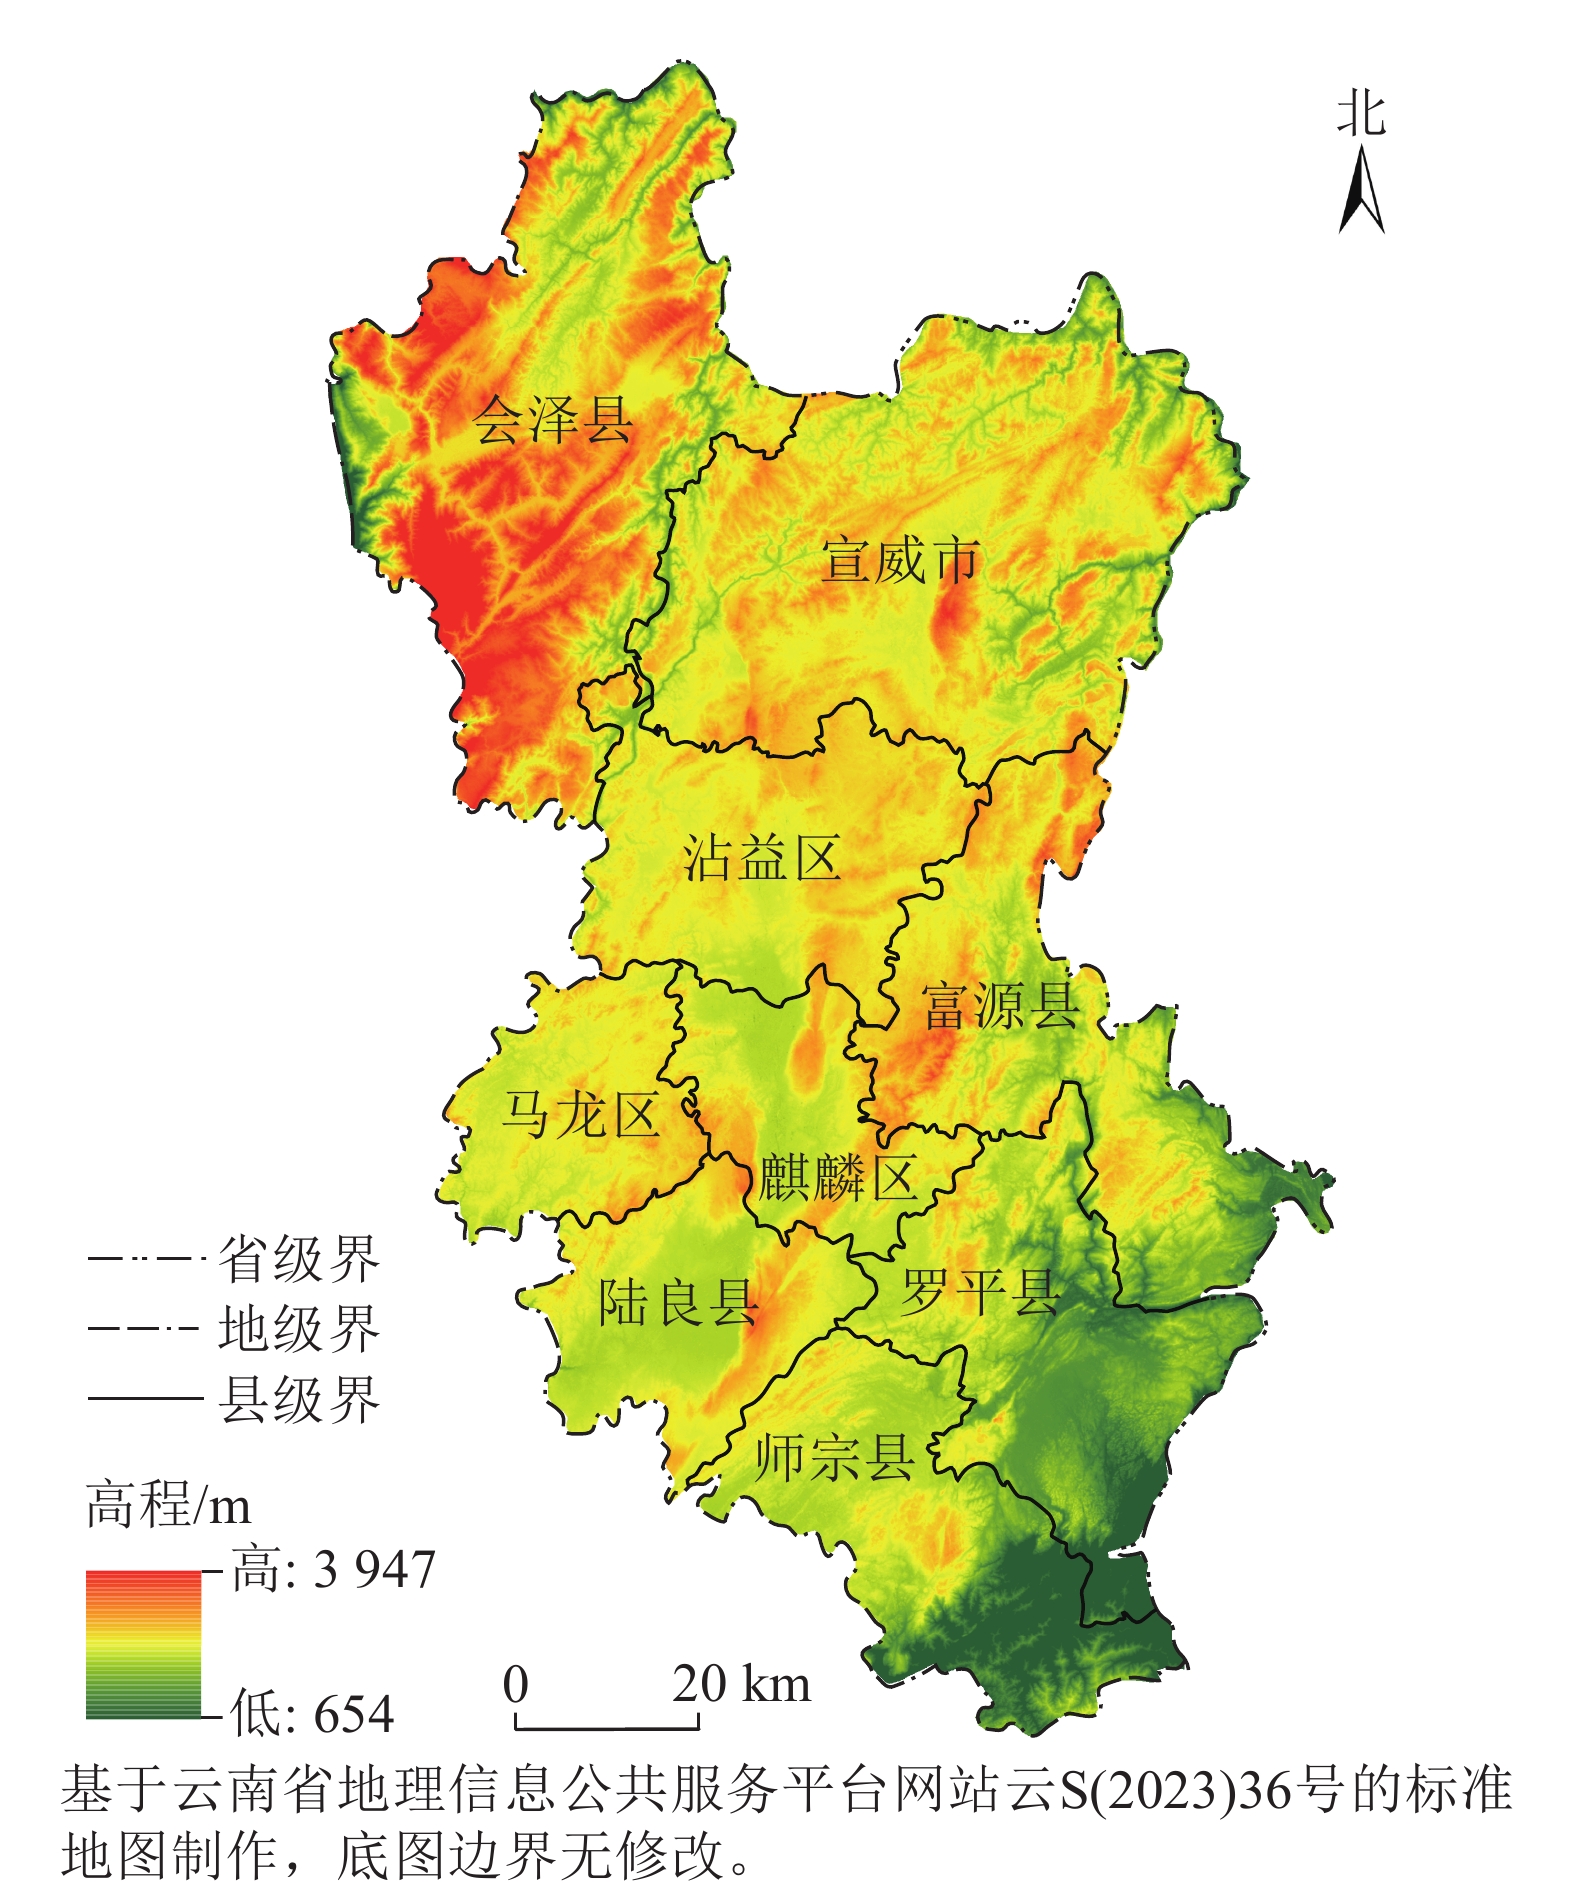
    • 曲靖市(24°19′~27°03′N,103°03′~104°50′E) 以高原山地为主,喀斯特地貌广布,生态脆弱。降水季节变化大,气象灾害频发。地处珠江源头,在流域生态安全保障及区域生态文明建设上具有重要意义。曲靖市为云南省第二大经济体,面积为2.89×10⁴ km2,辖麒麟、宣威、罗平等9个县(市、区)(图1)。2023年户籍人口为674.3万人,常住人口为568.8万人,人口城镇化率为43.62%。曲靖市是云南省重要的粮食生产地区,土地利用结构变化激烈。随着区域干旱发生频率增加、持续时间增长以及城乡发展水平不断提高,用地类型变化显著,区域生态脆弱性日益加剧,生态环境质量、人地关系矛盾愈发显著。

      Figure 1.  Location and topography of study area

    • 曲靖市1980、2000、2020年的土地利用数据来自中国科学院资源环境科学与数据中心(http://www.resdc.cn/Default.aspx),分辨率为30 m×30 m,综合精度达90%[26],土地利用数据共分为耕地、林地、草地、水域、建设用地及未利用地等6个一级类。

    • 采用InVEST软件Habitat Quality模块对曲靖市1980、2000、2020年及多情景的2040年生境质量进行测度。模型如下:

      式(1)~(2)中:Qxj为土地利用类型j中栅格x的生境质量指数;Dxj为生境退化度,代表土地利用类型j中栅格x的生境退化程度;Hxj为土地利用类型j中栅格x的生境适应性;k为半饱和常数;z为归一化常量,取值为2.5;Yr为威胁因子r栅格总数;wr为各个威胁因素权重。ry为威胁因子强度;irxy为栅格y中威胁因子r对栅格x的影响;βx为生境抗干扰水平;Sjr为不同生境对不同威胁因子的相对敏感程度。

      式(3)为线性衰退,式(4)为指数衰退。irxy为栅格y中威胁因子r对栅格x的影响;r为生境威胁因子;dxy为栅格x与栅格y之间距离;drmax为威胁因子r 影响范围。

      参考文献[27],选择农业、交通、城镇、农村居民点和工业用地为胁迫因子。参考InVEST模型手册及相关研究[28]设置胁迫因子参数及各土地利用类型对胁迫因子敏感度参数(表1~2)。

      威胁因子 最大威胁距离/km 权重 衰退类型
      农业用地 4 0.8 线性
      交通用地 3 0.4 线性
      城镇用地 10 1.0 指数
      农村居民点用地 5 0.6 指数
      工业用地 12 1.0 指数

      Table 1.  Threat factors and their stress intensity

      土地利用类型 生境适宜度 敏感度
      农业 城镇 交通 农村居民点 工业
      耕地 0.30 0 0.40 0.20 0.35 0.60
      林地 1.00 0.30 0.60 0.50 0.70 0.80
      草地 0.70 0.45 0.60 0.20 0.55 0.40
      水域 0.90 0.60 0.90 0.55 0.65 1.00
      建设用地 0 0 0 0 0 0
      未利用地 0.70 0.10 0.10 0.20 0.20 0.10

      Table 2.  Sensitivity of land use type to habitat threat factors

    • PLUS模型由用地扩张分析策略和基于多类型随机斑块种子的元胞自动机模型集成,能很好解释土地利用变化的影响因素,模拟精度更高[29]。结合国务院关于《云南省国土空间规划(2021—2035年)》的批复,设置自然发展、生态保护、城镇发展及耕地保护4种情景,模拟2040年曲靖市土地利用需求。①自然发展情景:保持现有土地利用变化转移概率,即与2000—2020年的土地利用转移矩阵一致。同时,以2000—2020年自然发展为基础,设置另外3种情景。②生态保护情景:考虑曲靖为珠江源生态安全屏障区,为保证区域生态安全,使耕地向建设用地转移减少40%,林地向建设用地转移减少40%,建设用地向林地转移增加30%,草地向建设用地转移减少20%,水域自身转移增加10%;③城镇发展情景:考虑曲靖作为云南及滇中城市建设的重要区域,将城镇用地、耕地、林地分别向城镇用地转移增加10%;④耕地保护情景:曲靖市作为“滇东粮仓”,为保证粮食安全,使耕地向城镇建设用地转移减少7%,草地向耕地转移增加15%,林地向耕地转移增加15%。
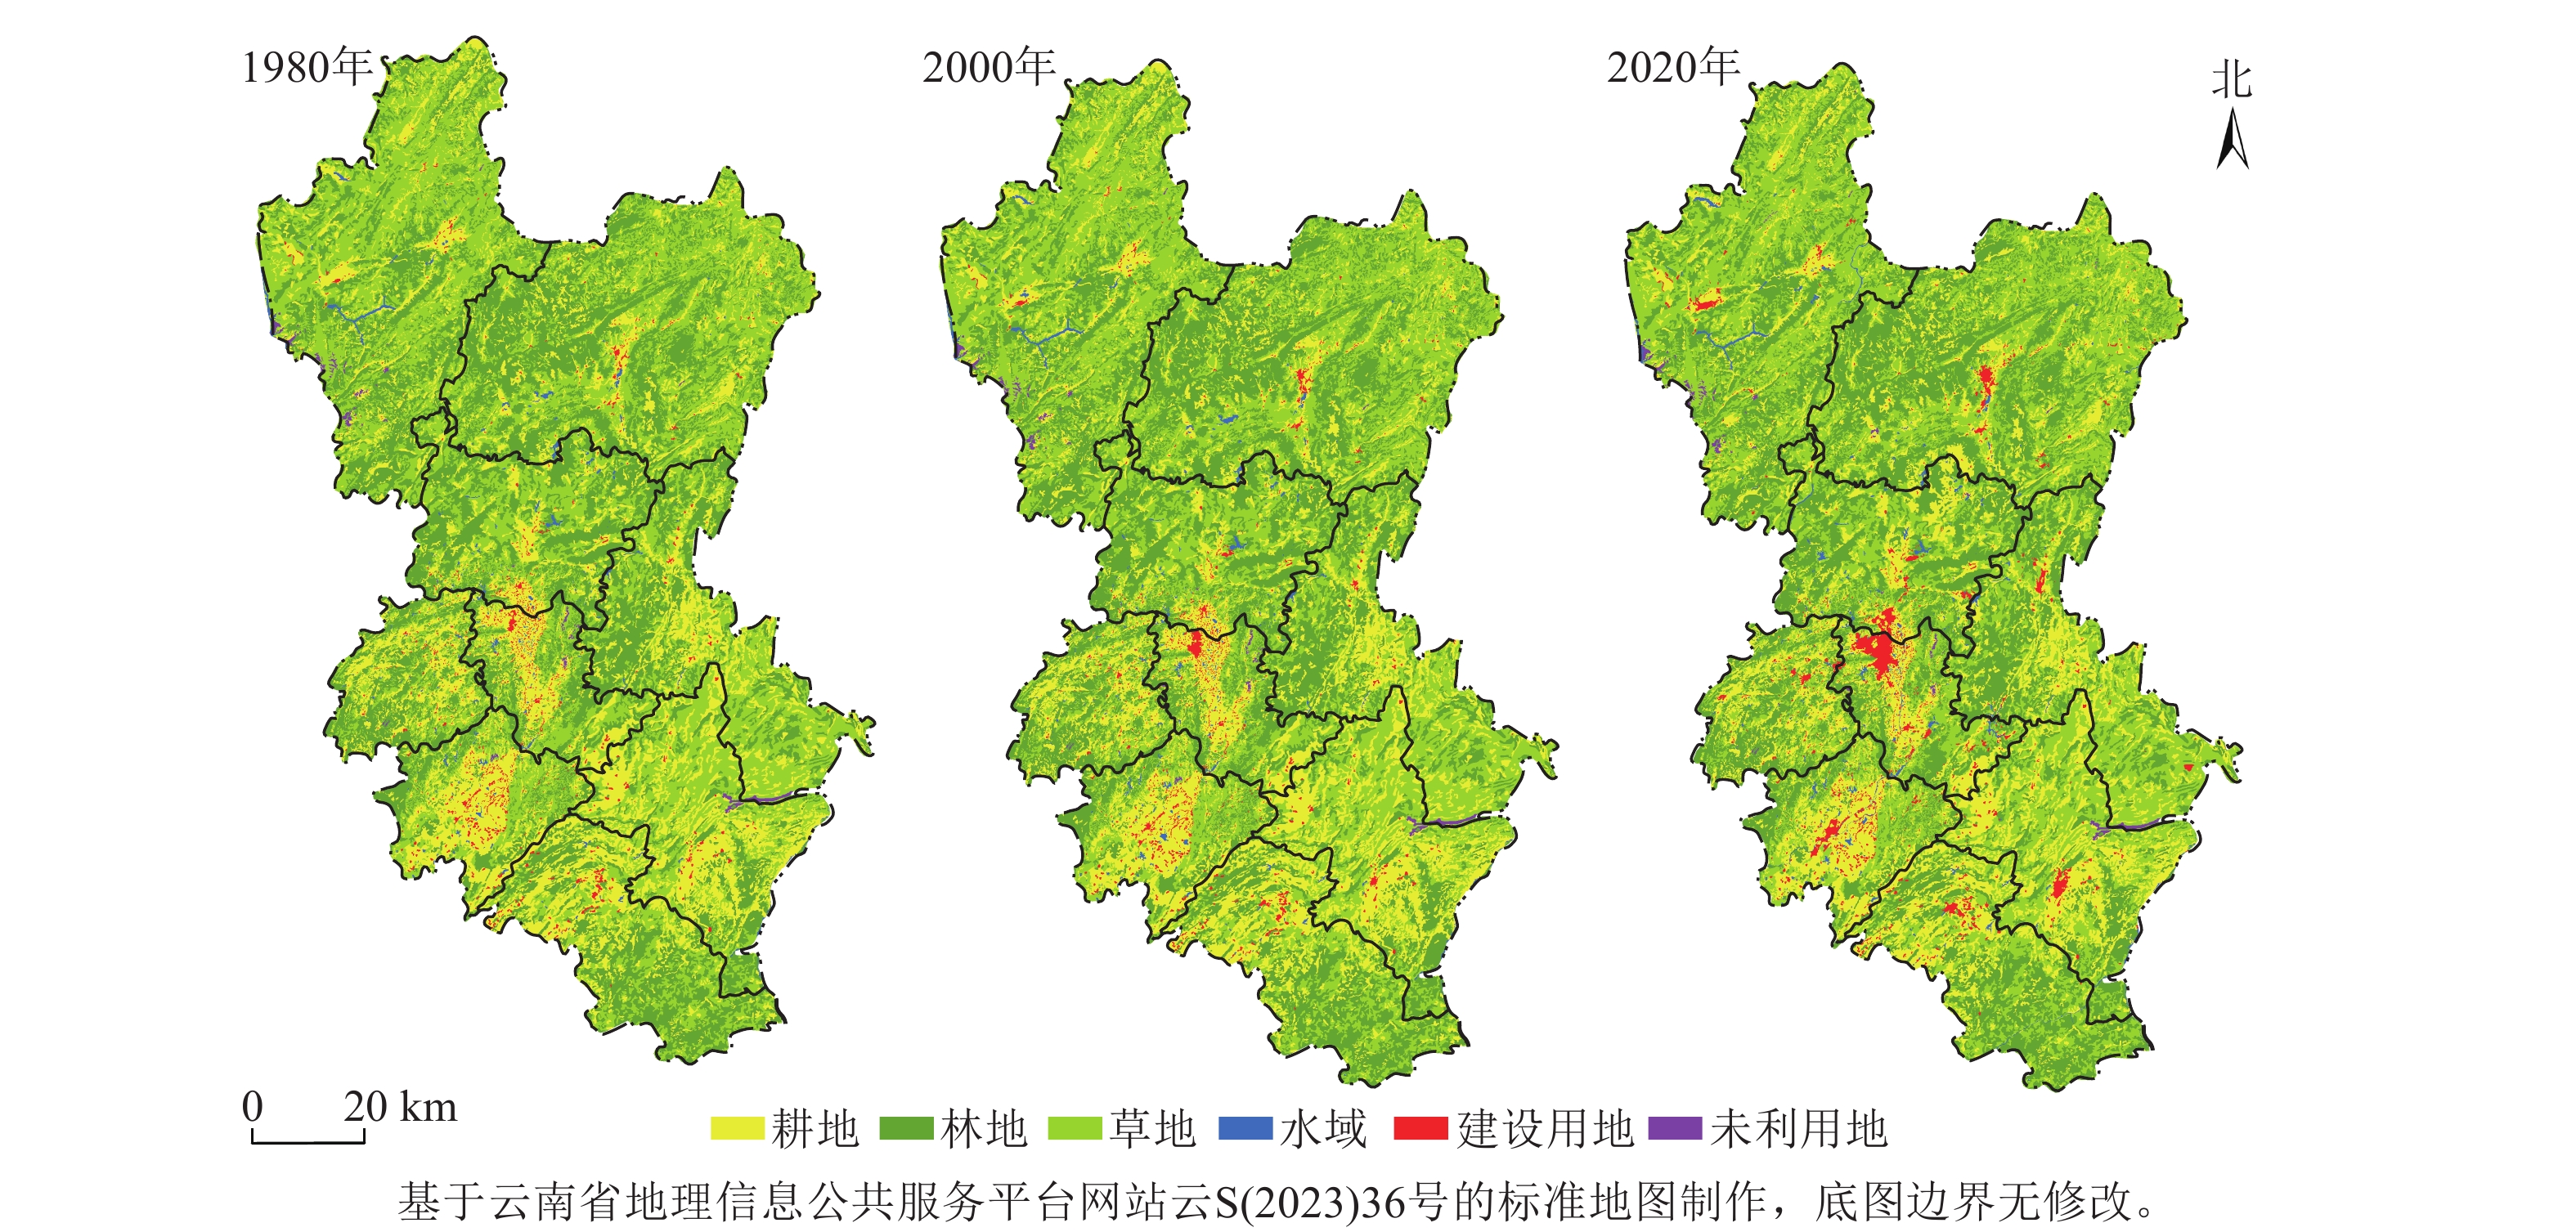
    • 表3可知:40 a中曲靖市草地、林地、耕地为主要用地类型,共占97.000%。其中,草地和林地2类生态用地占74.000%。各类用地变化中,建设用地增幅高达91.515%,尤其是2000年以后增幅高达72.335%。其次,水域面积也呈增加趋势,1980—2020年增幅达39.200%,近20 a来增幅达29.084%。草地、耕地占比分别减少了3.205%和1.742%。其中,耕地在前20 a占比下降,减少了2.560%,后20 a呈上升趋势,增加了0.840%;草地在前20 a占比增加了0.921%,后20 a占比减小了4.088%。此外,林地在各阶段均保持增长态势。总体来看,曲靖市土地利用面积从大到小依次为:草地、林地、耕地、建设用地、水域、未利用地。

      土地利用类型 1980年 2000年 2020年 1980—2020年面积
      变化率/%
      面积/km2 占比/% 面积/km2 占比/% 面积/km2 占比/%
      耕地 6 874.130 23.773 6 698.128 23.164 6 754.379 23.358 −1.742
      林地 9 899.133 34.234 9 921.585 34.312 10 047.968 34.749 1.504
      草地 11 592.554 40.090 11 699.303 40.459 11 220.989 38.805 −3.205
      水域 169.210 0.585 182.471 0.631 235.541 0.815 39.200
      建设用地 301.590 1.043 335.155 1.159 577.589 1.997 91.515
      未利用地 79.605 0.275 79.592 0.275 79.755 0.276 0.189

      Table 3.  Area and proportion of different land use types from 1980 to 2020

      图2可知:1980—2020年土地利用整体空间变化保持相对稳定,呈“锁定”效应。草地与林地集中在山区,耕地、建设用地集中在坝区。其中,草地集中在宣威东部及会泽大部分地区、富源东南部及罗平北部,草地面积整体呈先增加后下降趋势;林地集中分布在乌蒙山区,草地和林地分布区共同构成研究区的生态屏障。1980—2000年建设用地集中于麒麟区,呈“单核心”空间结构,有沿珠江源大道扩展的趋势。2000—2020年形成以宣威、会泽、陆良及罗平4个县城为次级核心区的X型建设用地空间结构。

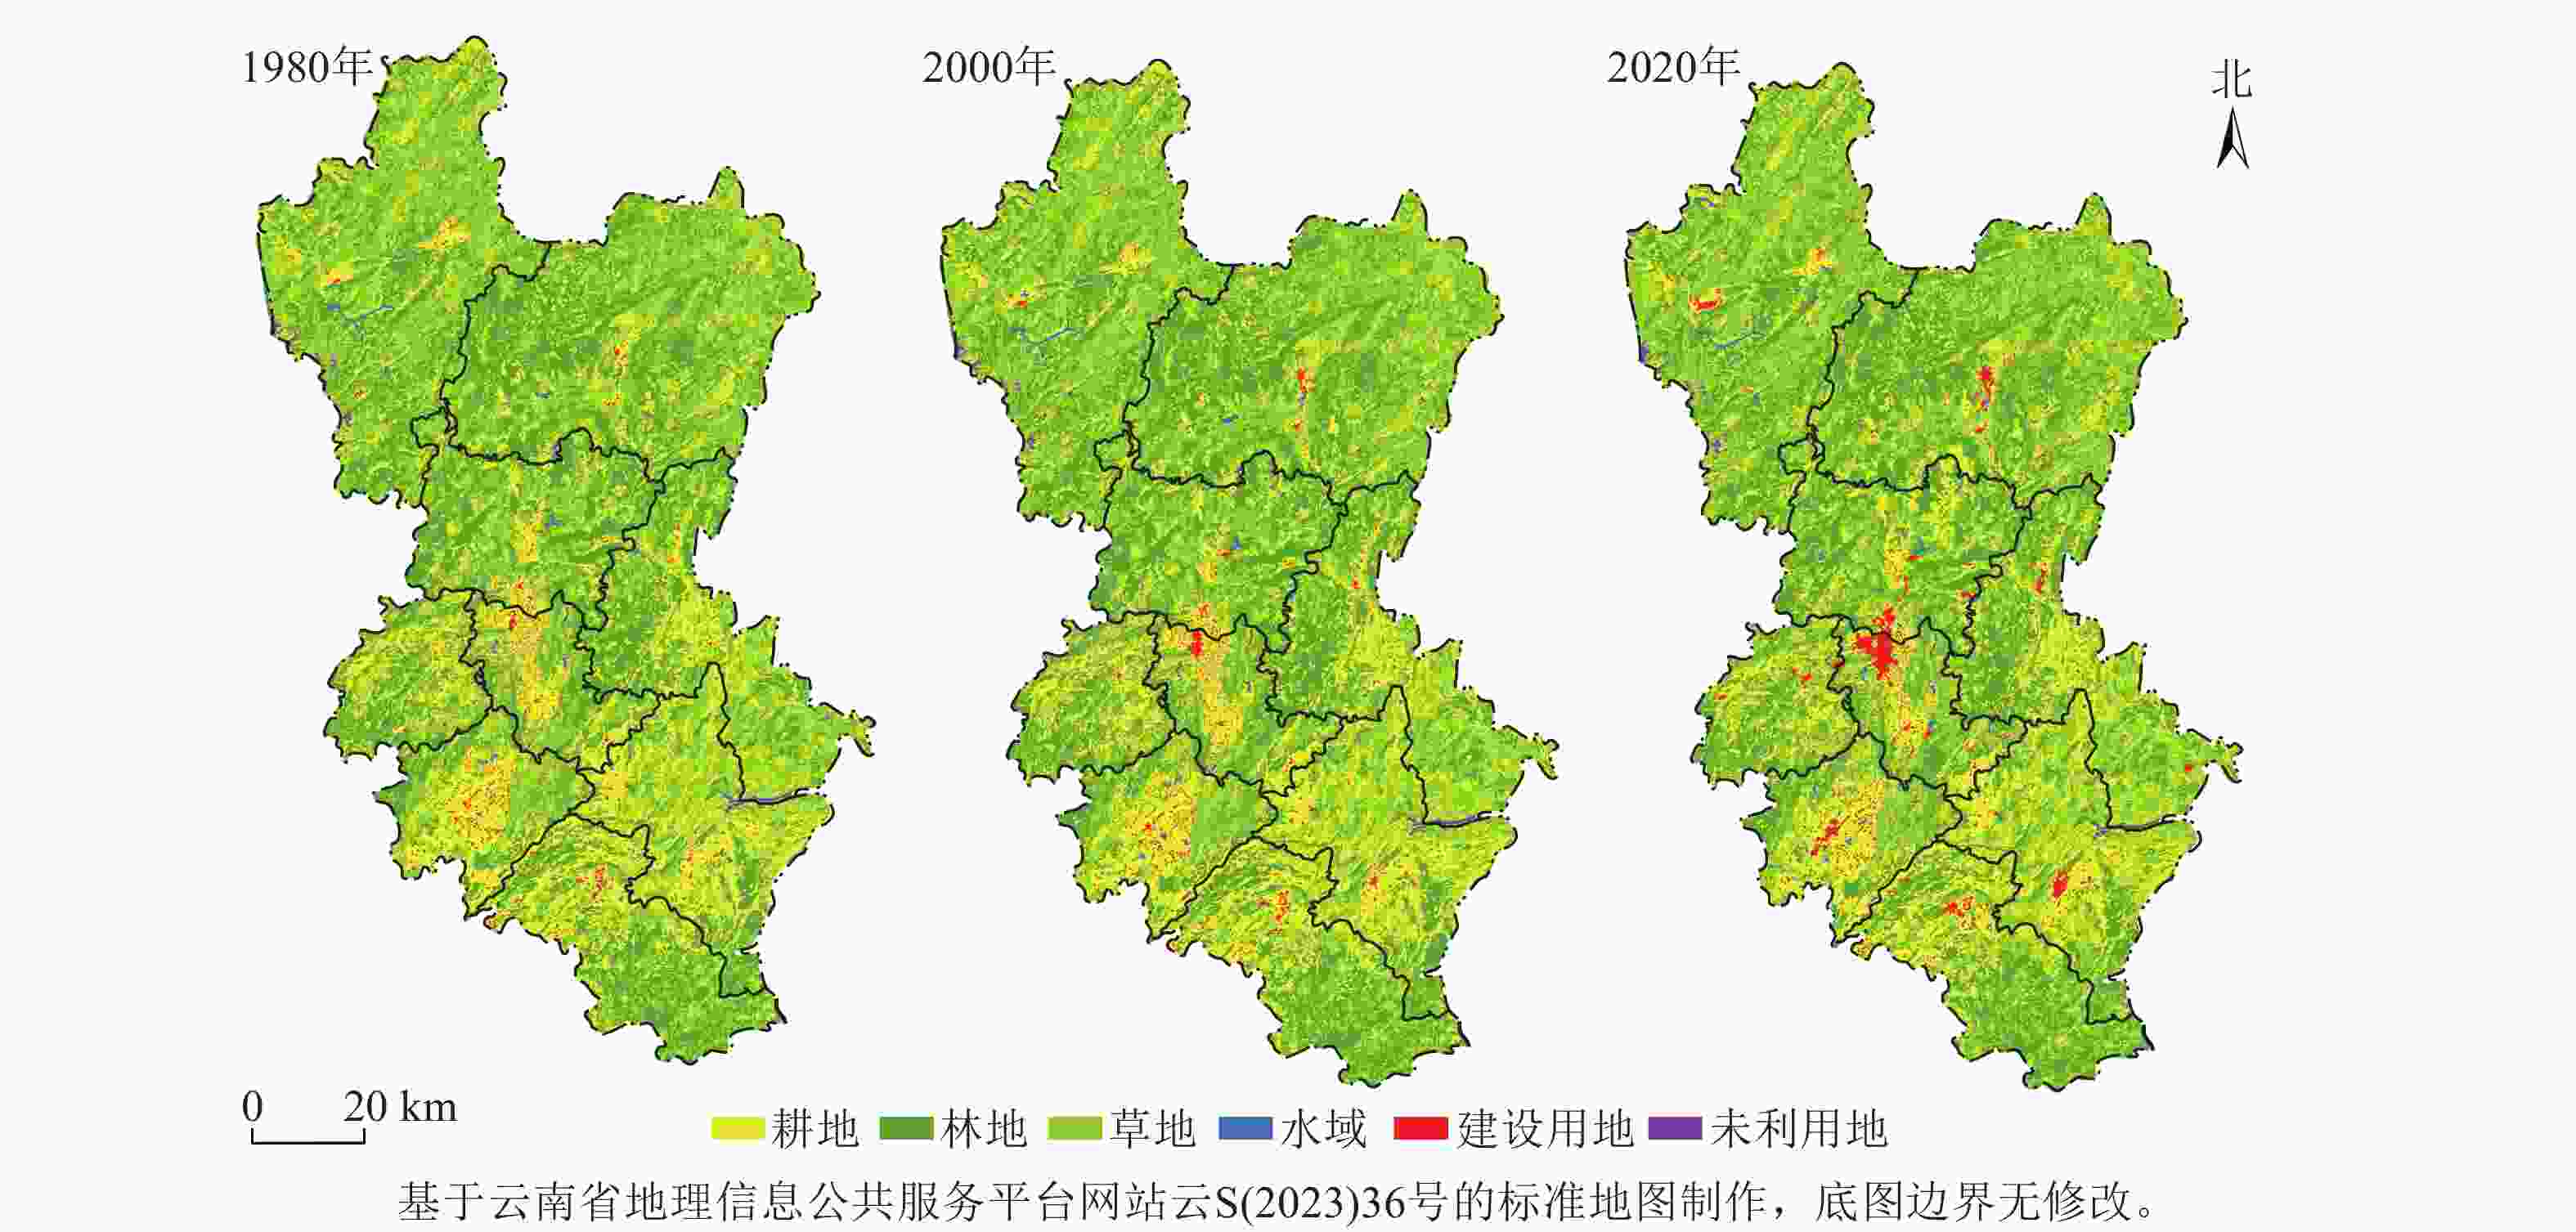
      Figure 2.  Spatial distribution of land use change in Qujing City from 1980 to 2020

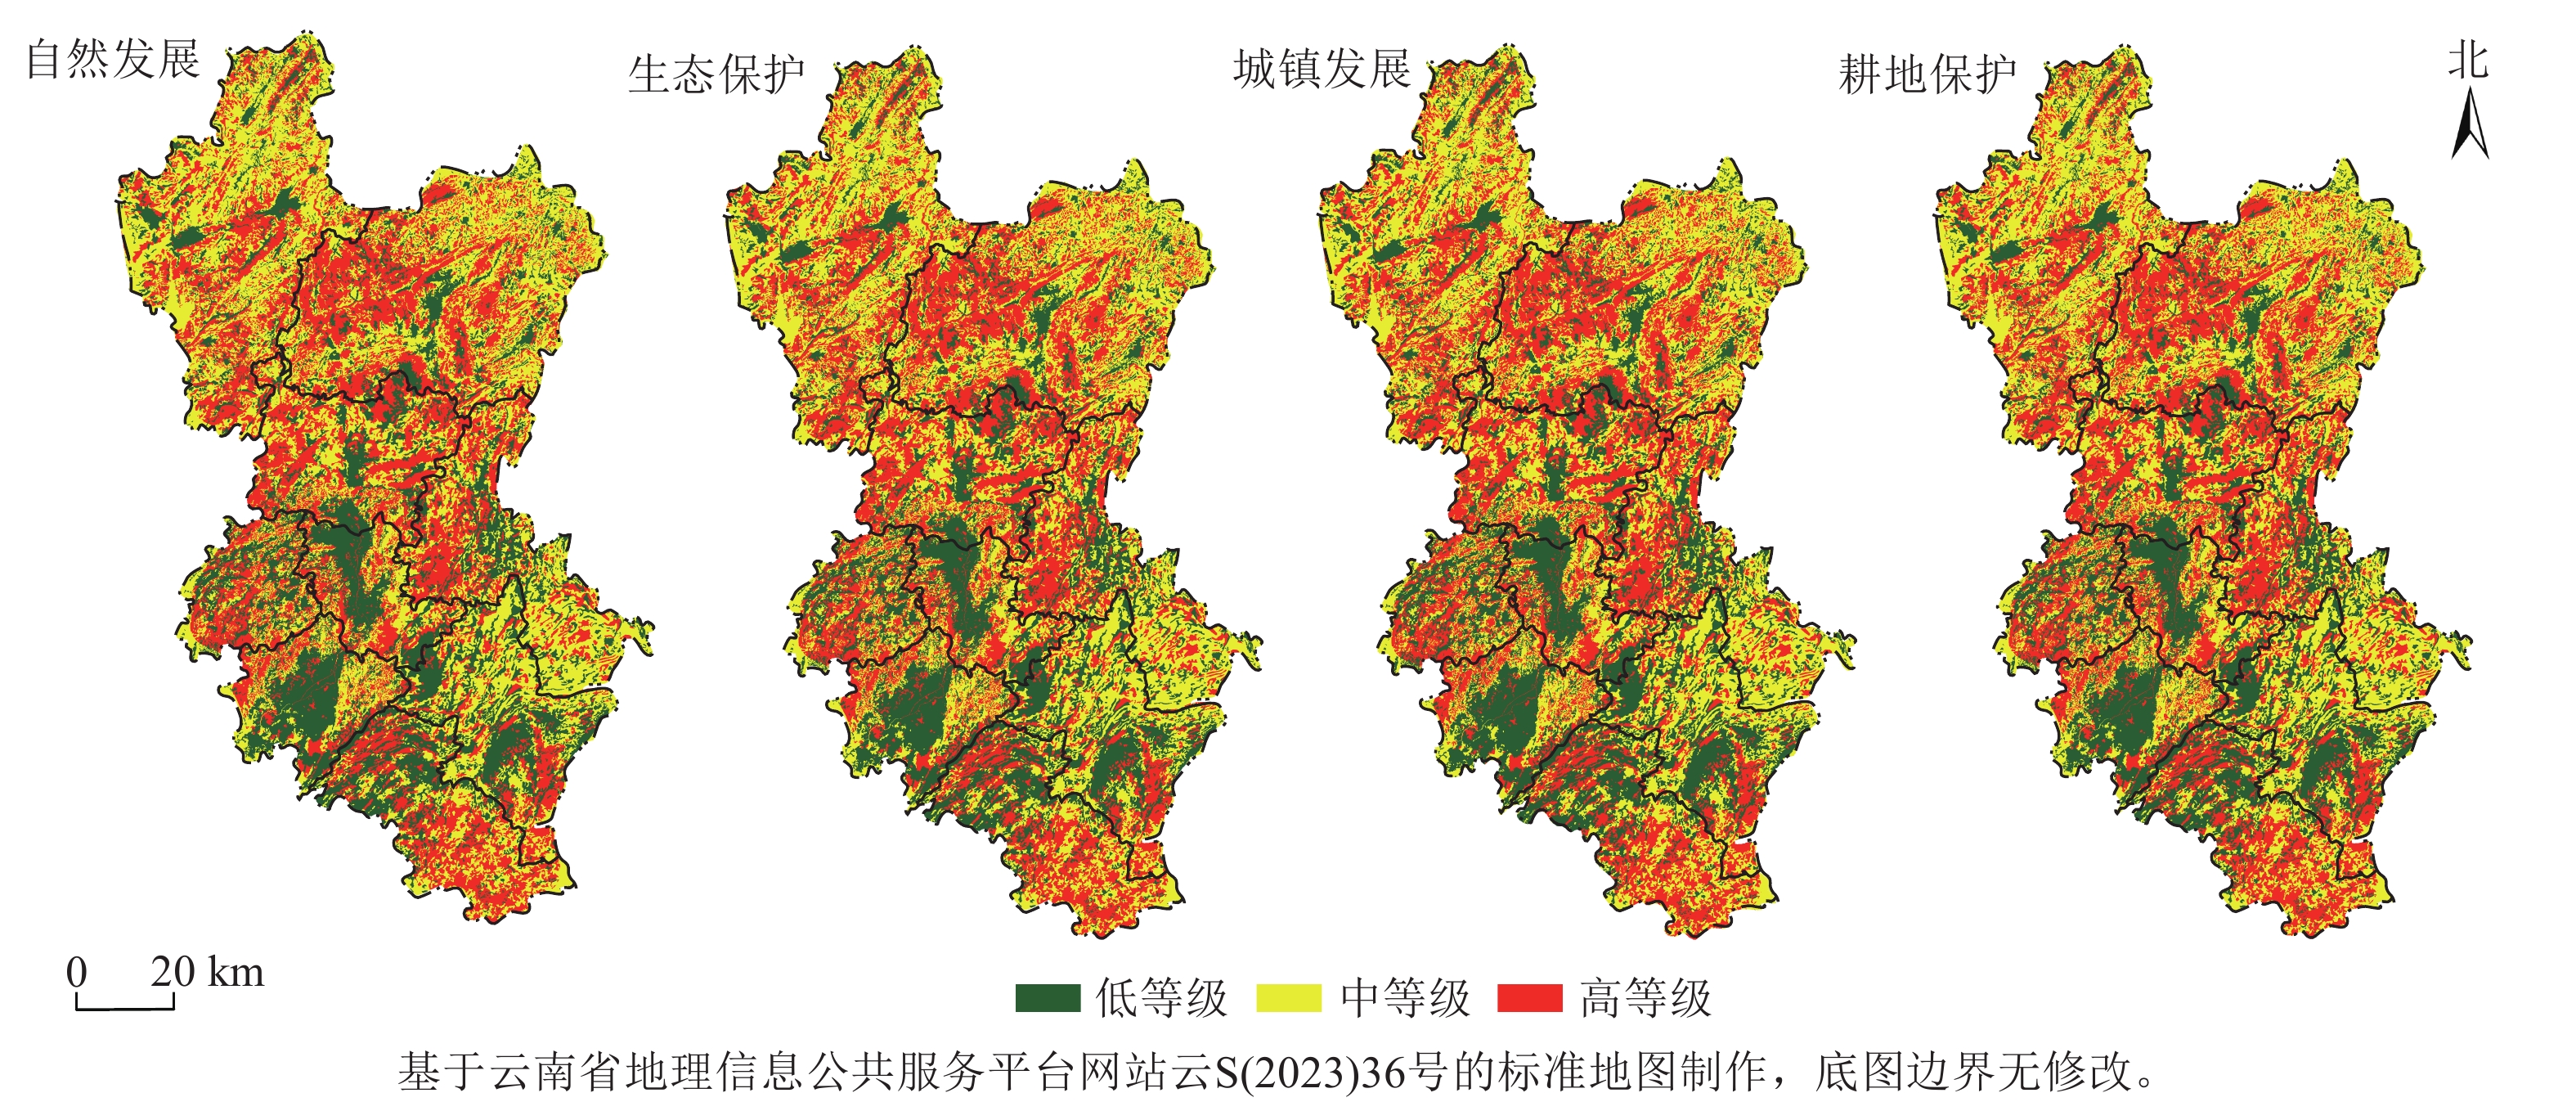
    • 4种情景下,曲靖市2040年土地结构变化与2020年相比存在差异(表4)。自然发展情景下,耕地、草地、水域面积均呈下降趋势,分别减小了24.264、284.066、0.274 km2;林地和建设用地面积均呈增加趋势,分别增加了206.999、101.615 km2。生态保护情景下,耕地、林地面积均呈增加趋势,分别增加了74.614、85.075 km2;草地面积减小了159.678 km2。城镇发展情景下,耕地、林地、草地面积均呈下降趋势,分别减小了29.552、30.018、373.648 km2;建设用地是唯一面积增加的地类,增加了433.229 km2。耕地保护情景下,耕地、林地面积均呈增加趋势,分别增加了155.774、228.114 km2;草地和水域面积均呈减小趋势,分别减小了377.636、8.832 km2;建设用地基本保持稳定。从空间看,除城镇发展情景下建设用地在曲沾坝和陆良坝中有扩张外,其余3种情景的土地利用类型空间分布与2020年基本一致。

      土地利用类型自然发展生态保护城镇发展耕地保护
      面积/km2占比/%面积/km2占比/%面积/km2占比/%面积/km2占比/%
      耕地6 730.11523.2756 828.99323.6166 724.82723.2566 910.15323.897
      林地10 254.96735.46410 133.04335.04310 017.95034.64510 276.08235.537
      草地10 936.92237.82211 061.31138.25310 847.34137.51310 843.35337.499
      水域235.2670.814235.5410.815235.5410.814226.7090.785
      建设用地679.2052.349577.5891.9971 010.8183.496580.1802.006
      未利用地79.7550.27679.7550.27679.7550.27679.7550.276

      Table 4.  Area and proportion of different land use types in different scenarios in 2040

    • 生境质量是区域土地利用类型变化程度的重要体现。基于曲靖市1980—2020年及2040年不同情景,采用自然断点法将生境质量分为3级:低等级[0.000, 0.480)、中等级[0.480, 0.828)、高等级[0.828, 1.000]。

    • 从过程看,1980、2000和2020年平均生境质量分别为0.686、0.688和0.683,整体呈先增加后减小趋势,为中等级水平,但不同等级生境质量变化存在差异。其中,低等级生境质量面积呈先减小后增加趋势,1980—2000年低等级面积减小了1.958%,2000—2020年低等级面积增加了4.248% (表5)。中等级生境质量面积呈先增加后减小趋势,1980—2000年中等级面积增加了0.728%,2000—2020年中等级面积减小了3.829%。高等级生境质量面积呈增加趋势,1980—2000年高等级面积增加了0.565%,2000—2020年高等级面积增加了1.686%。

      生境等级1980年2000年2020年
      面积/km2占比/%面积/km2占比/%面积/km2占比/%
      7 176.10124.8177 033.66024.3247 332.41625.357
      12 020.98041.57212 108.54141.87511 644.95940.272
      9 719.15133.6119 774.03233.8019 938.85834.371

      Table 5.  Area and proportion of habitat quality area of each grade from 1980 to 2020

      从分布看(图3),曲靖市生境质量呈北高南低特征。高等级生境质量区主要分布在山地和保护区内,形成以乌蒙山东北部的宣威和乌蒙山西南部的马鸣乡2个高值区,以及会泽驾车华山松省级自然保护区、罗平鲁布革及多依河风景区、独木水库水源地保护区3个高值区。低等级生境质量区主要分布在坝区和矿业开采区,主要在曲沾坝和陆良坝,以及会泽者海铅锌矿和富源营上煤炭开采区。

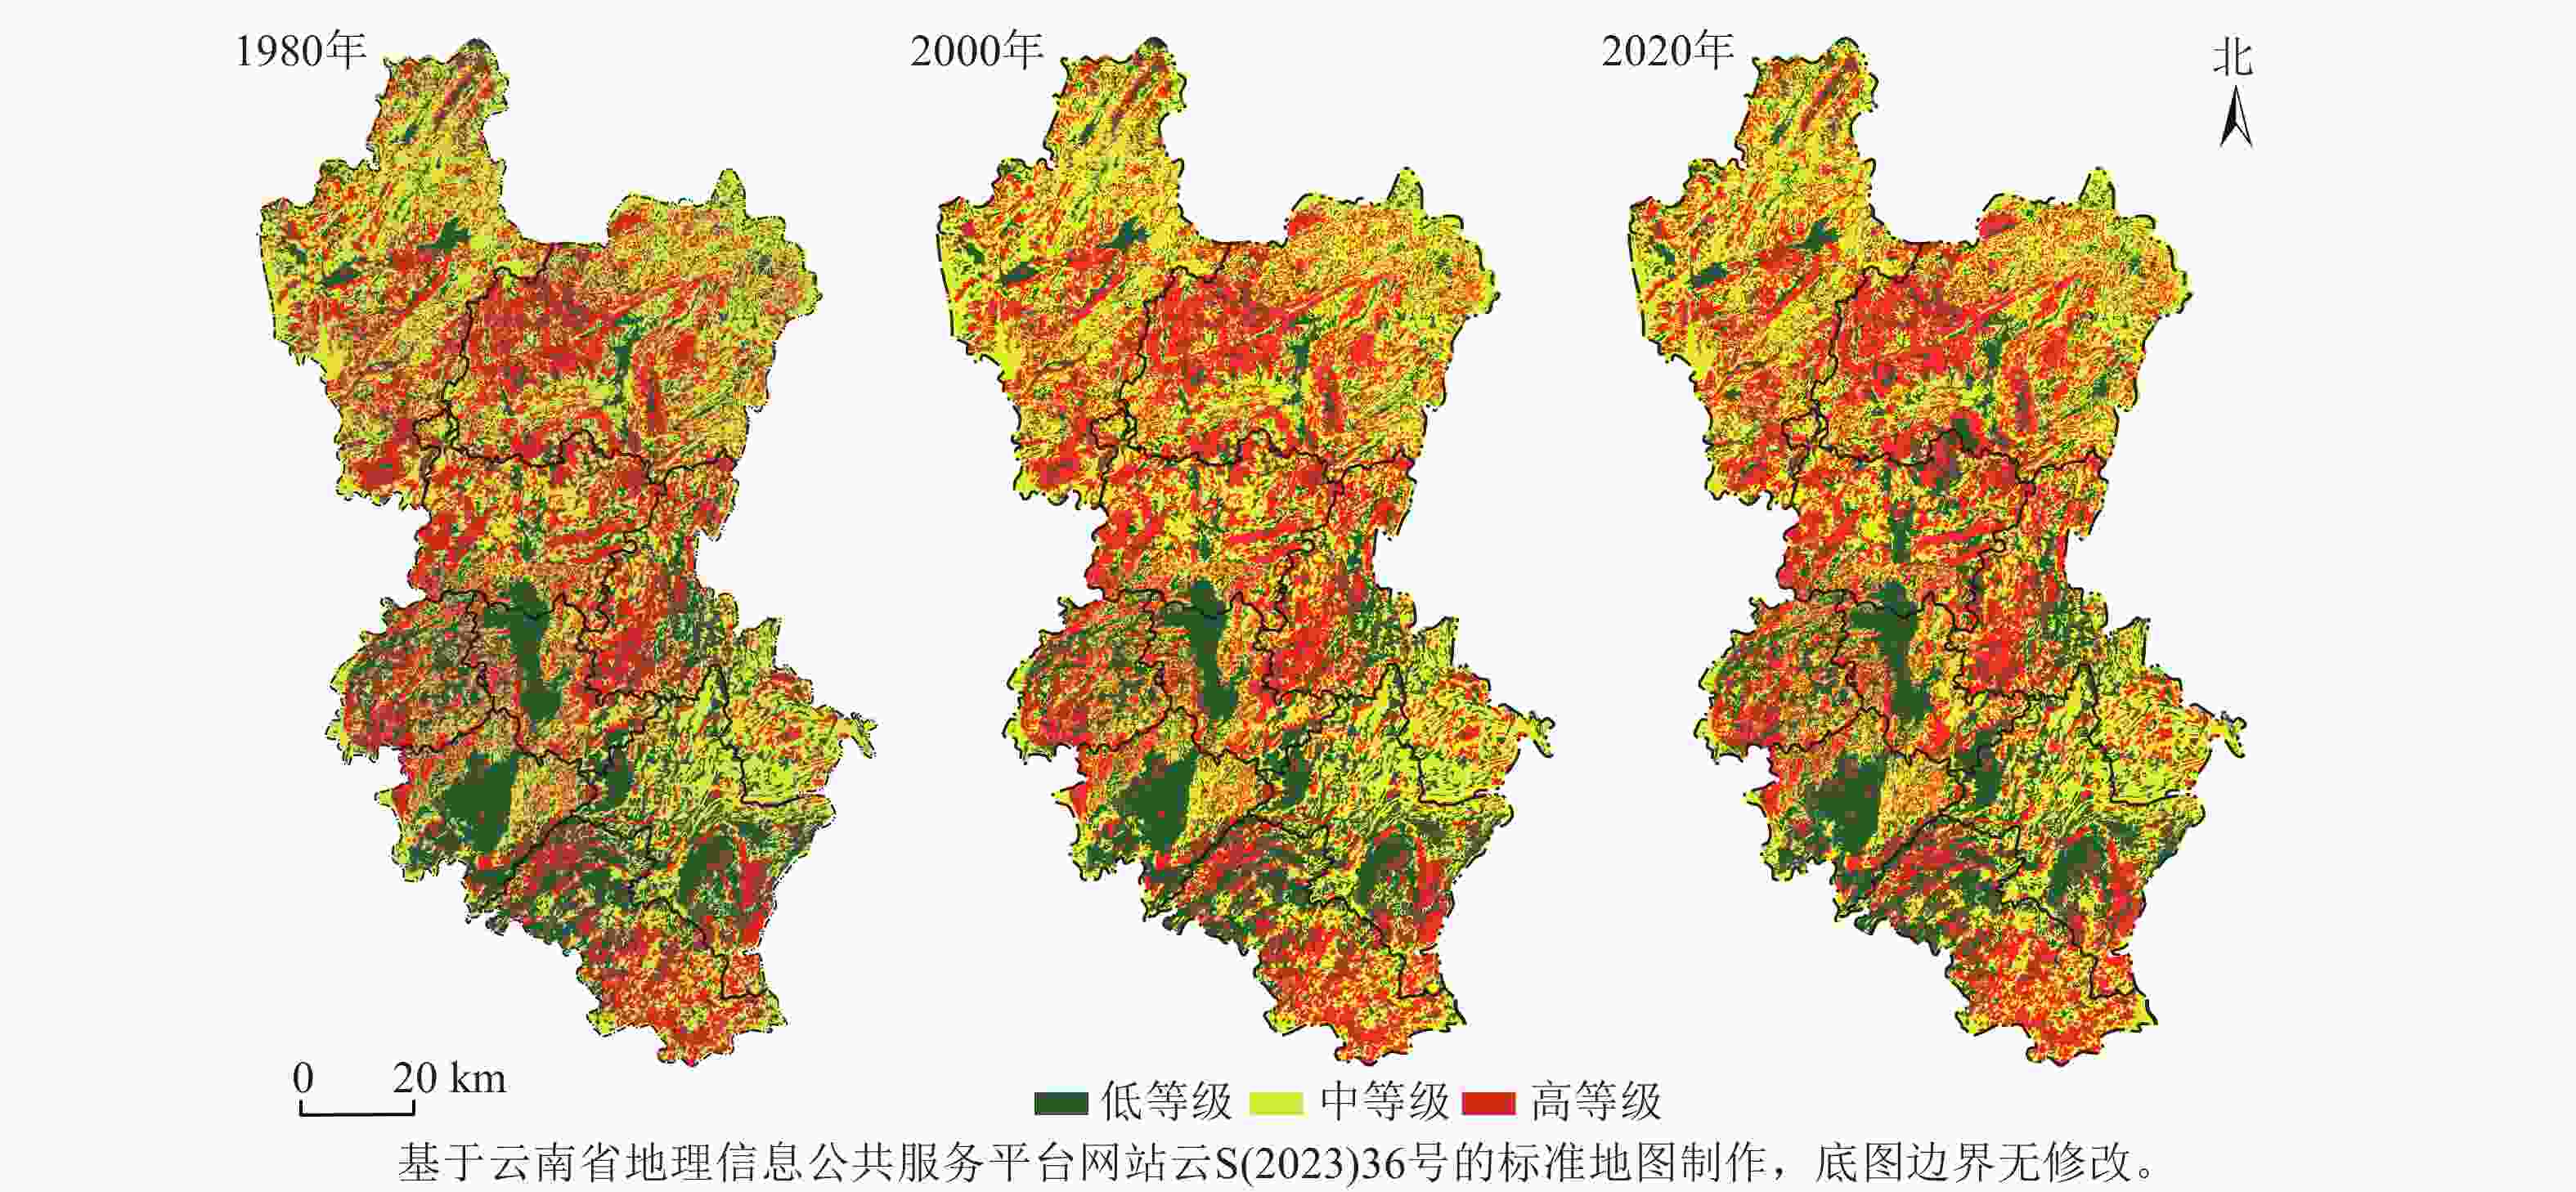
      Figure 3.  Spatial distribution of habitat quality in Qujing City from 1980 to 2020

    • 表6图4可知:曲靖市2040年自然发展、生态保护、城镇发展、耕地保护情景的平均生境质量分别为0.678、0.679、0.672和0.678,从高到低依次为:生态保护、耕地保护、自然发展、城镇发展。具体表现为:①自然发展的低中高生境质量面积分别为7 500.121、11477.810及9 938.301 km2,相较2020年分别增加167.705 km2、减小167.149 km2及0.557 km2。其中,低等级面积增加2.287%,主要由中等级转化。整体上看,曲沾坝、陆良坝及宣威坝生境质量进一步下降,是因为坝区既是农业活动集中区,又是城镇扩张的主要空间。曲靖作为滇中城市群的重要城市及省级副中心城市,未来仍需要大量耕地转化为城镇建设用地,以促进区域社会经济发展。②相较自然发展,生态保护的生境质量低等级面积占比增加较小。低中高生境质量面积分别为7 512.028、11 417.694、9 986.51 km2,相较2020年分别增加179.612 km2、减小227.265 km2及增加47.653 km2。整体上水域生境质量有明显提高,但研究区为喀斯特区,水域面积扩张受限,生境质量提高相对有限。③与自然情景相比,城镇发展的生境质量低等级面积占比明显增加,主要位于曲沾坝和陆良坝边缘地区。低中高生境质量面积分别为7 735.078、11 269.124、9 912.030 km2,相较2020年分别增加402.662 km2、减小375.835 km2及26.827 km2。其中,低等级面积增加了5.492%。④相较自然发展,耕地保护的生境质量低等级面积占比增加较大。低中高生境质量面积分别为7 551.210、11 478.007及9 887.015 km2,相较2020年分别增加218.794 km2、减小166.952 km2及51.834 km2。整体上看,与2020年相比,2040年4种情景下的曲靖市生境质量水平均呈现下降趋势。从空间分布看,2040年4种情景下曲靖市生境质量整体呈“北高南低”的分异规律,生境质量低值区与曲靖的坝子空间分布高度一致。

      情景 低等级 中等级 高等级
      面积/km2 占比/% 面积/km2 占比/% 面积/km2 占比/%
      自然发展 7 500.121 25.937 11 477.810 39.694 9 938.301 34.369
      生态保护 7 512.028 25.979 11 417.694 39.485 9 986.510 34.536
      城镇发展 7 735.078 26.750 11 269.124 38.972 9 912.030 34.278
      耕地保护 7 551.210 26.114 11 478.007 39.694 9 887.015 34.192

      Table 6.  Area and proportion of habitat quality in different scenarios in 2040

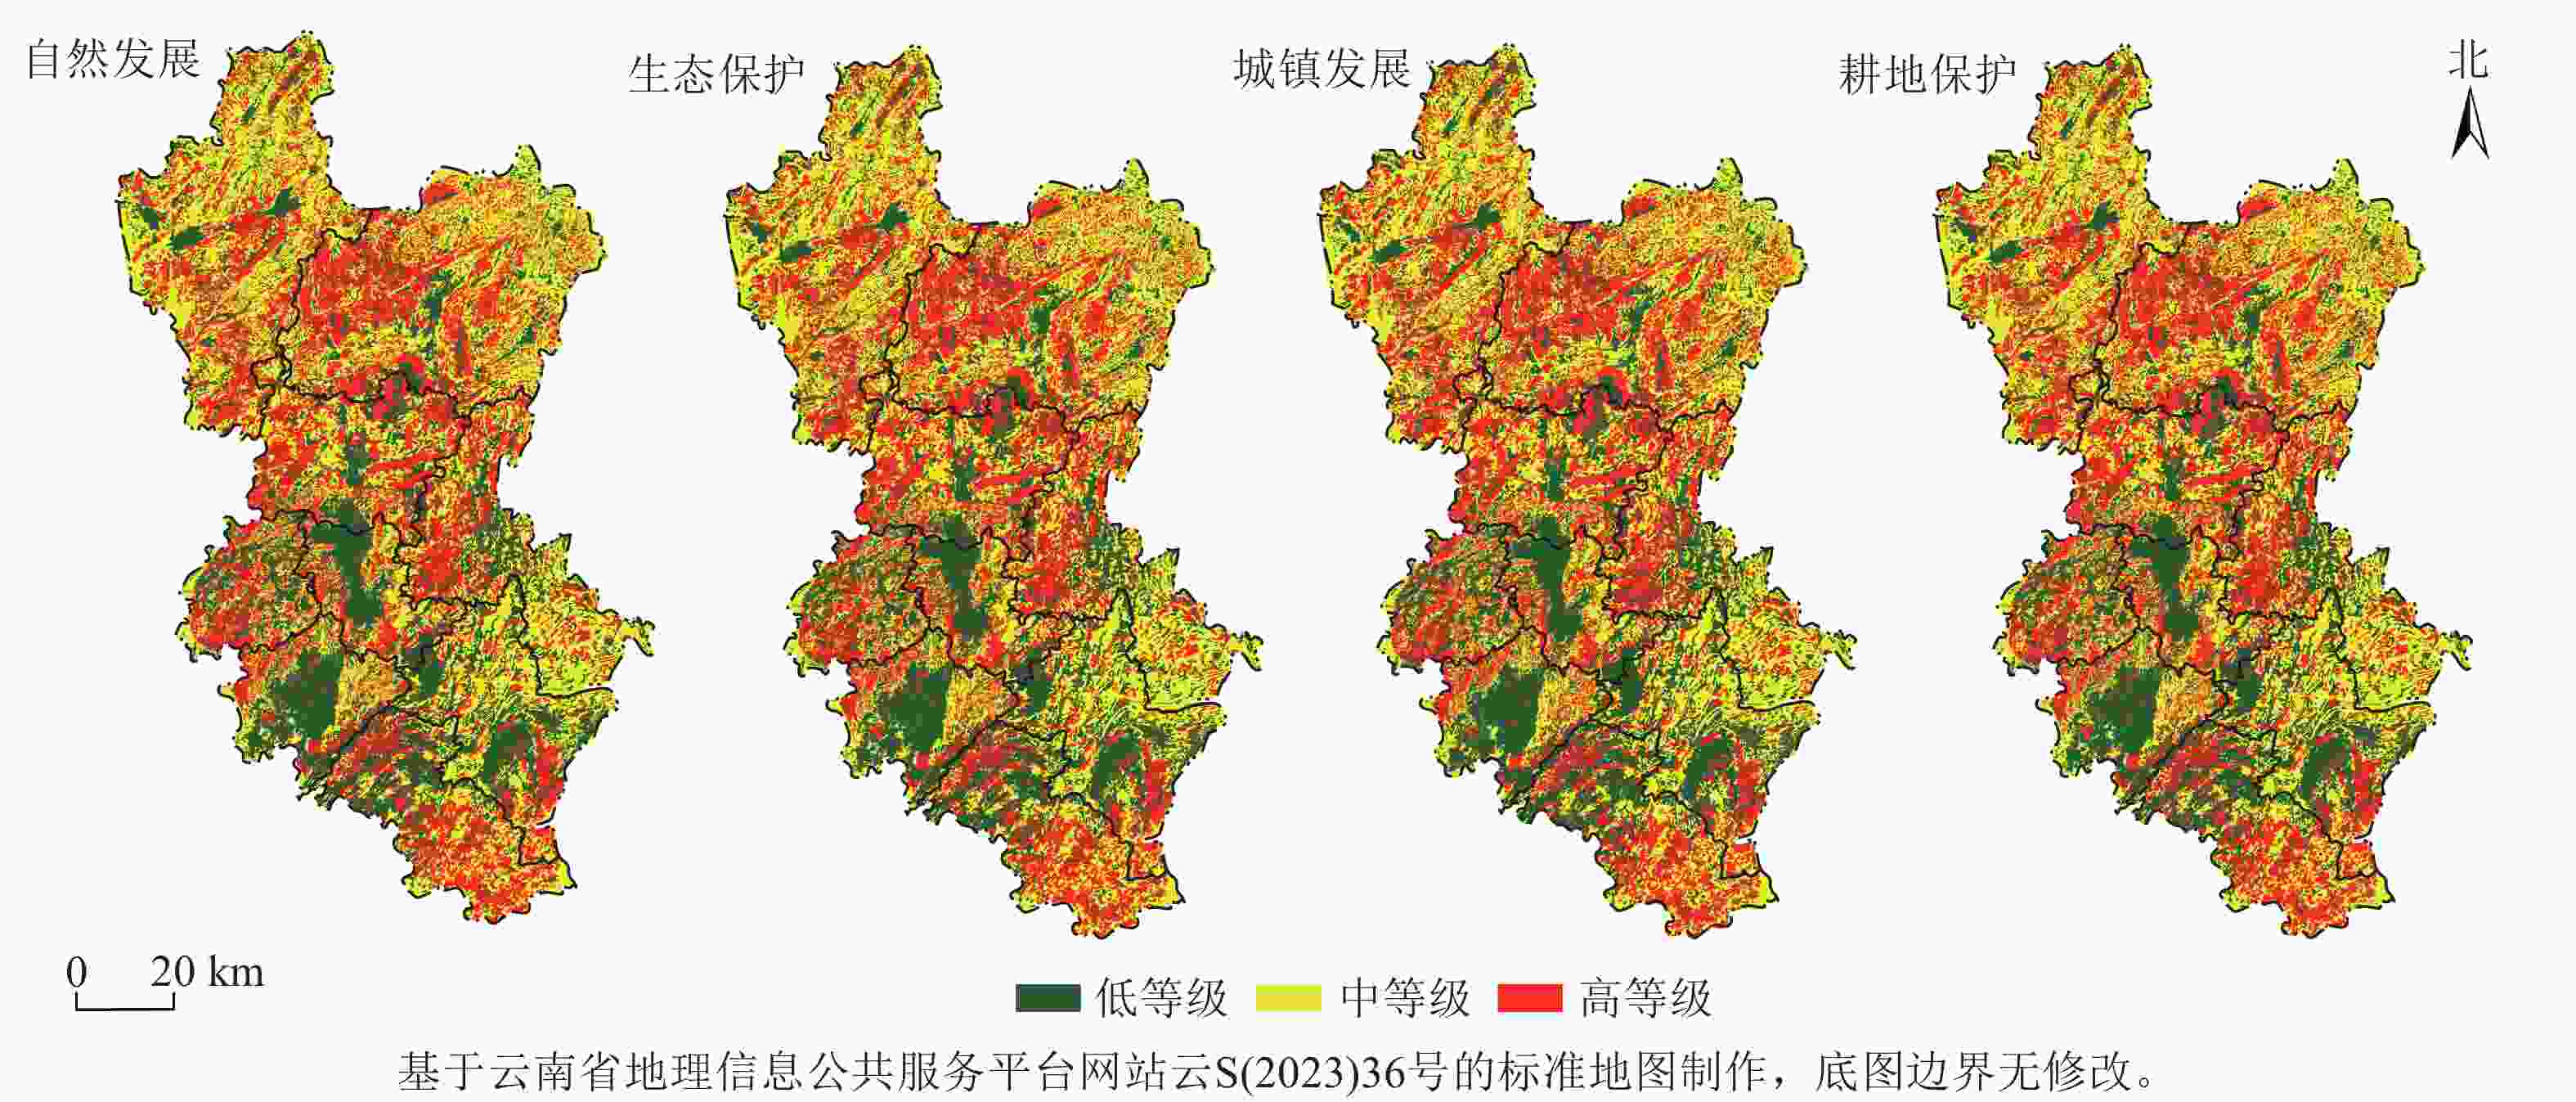
      Figure 4.  Spatial distribution of multi-scenarios habitat quality in Qujing City in 2040

      由生境质量冷热点可知:1980—2020年,曲靖市生境质量热点区范围缓慢缩小,面积由1980年的5 357.248 km2,减至2020年的5 069.327 km2。生境质量热点区集中分布在宣威西部及沾益北部、富源西部和麒麟东部、师宗南部,与草地及林地分布基本一致。冷点区范围快速缩小,面积由1980年的5 100.446 km2,减至2020年的4 663.243 km2。生境质量冷点区集中在曲沾坝、陆良坝、富源坝和罗平坝,与农业用地及建设用地分布基本一致。对比4种情景冷热点发现:除城镇发展情景外,其他3种情景下冷热点空间格局基本保持稳定,且热点面积为5 039.439 km2,冷点面积为3 067.258 km2。与2020年相比,2040年自然发展情景冷热点的面积相差不大,热点面积略缩小,冷点面积略扩大。但空间格局发生明显变化,表现为热点区南迁,冷点区北进趋势。生态保护情景的冷热点面积基本不变,空间格局整体呈北进态势。城镇发展情景的冷热点变化明显,热点面积减少344.268 km2,冷点面积减少150.438 km2;北部热点区域和南部冷点区域均呈缩小态势,尤其是北部的宣威和会泽,南部的陆良和罗平变化更为明显。耕地保护情景的热点面积不变,冷点面积扩大,热点西进,冷点东扩。

    • 曲靖市土地利用变化受自然与社会经济活动共同作用。具体来看,高原山地地形导致草地和林地分布较广、面积较大,与前人研究[30]认为高植被覆盖区多分布在地形崎岖的山地上一致。研究期内建设用地扩张最快,增幅最大,这源于滇中城市群建设的持续推进,与陈成等[31]对滇北区研究结果相近。其次水域增长较快,除了与退耕还湖[31]相关外,还与喀斯特地区水库兴建密切相关,如马龙车马碧水库修建。同时,林地面积整体呈增长态势,与长期生态治理工程、乡村能源结构改善、乡村畜牧业衰退等相关。整体上看,1980—2020年土地利用类型面积从大到小依次为:草地、林地、耕地、建设用地、水域、未利用地,与周俊鑫等[32]的研究结果有明显差异,这与曲靖市以山地地貌为主的自然地理环境密切相关:山坝结构导致城镇化发展滞后,农业为区域主导产业,但发展水平不高及喀斯特地区地表水难以形成。

      从研究区2040年的4种情景看,自然发展情景下建设用地以挤占草地、林地和耕地为主,面积扩张较快,与区域可持续发展理念相矛盾;耕地保护情景下建设用地受到严重制约,基本没有扩展;城镇发展情景下建设用地急剧扩张,大量挤占草地,与当下生态文明建设相冲突。整体上看,相较2040年自然发展情景,生态保护情景下的耕地增加98.878 km2,草地增加124.388 km2,水域增加0.274 km2,林地减少121.924 km2,建设用地减少101.615 km2,符合新时期对粮食安全和生态保护协调发展的需要。

    • 曲靖市生境质量与土地利用类型密切相关,主要表现为:生境质量高等级区主要分布在山区林地和坝区水域,生境质量中等级区主要分布在山区草地,生境质量低等级区主要分布在坝区的建设用地和耕地。这是导致冷点区域扩张的直接原因,与伊犁河谷生境质量研究[33]观点相近。但本研究中未利用地的生境质量为中等级区,而不是隋露等[33]认为的低值区,这可能是南北差异导致的。1980—2000年低等级面积减小了1.979%,可能与林草相关法律法规及生态工程实施相关,法规实施促使区域生态恢复。而2000—2020年低等级面积增加了4.237%,可能与2009—2015年连续干旱有关,长期干旱导致喀斯特生态脆弱区植被大面积死亡。同时,这也是区域农业及城镇化快速发展时期,促使耕地向坝区及周围低海拔山地开发,草林地面积缩小,导致区域生境质量降低。此外,1980—2020年生境质量高等级区面积占比持续增加,主要是因为林地为该等级的重要支撑用地类型,多分布在地形崎岖山地上,受人类干扰相对较弱,且在各项生态保护政策作用下更易修复。

      从2040年的4种情景看,生境质量中等级的面积占比在减小,而高等级及低等级面积占比在增加。生态保护情景下,高等级面积占比在4种情景中处于第1位,中及低等级均处于第3位。因此,生态保护情景为曲靖市生境质量发展的最佳模式,这与已有研究[2223]的结果一致。但在驱动机制上,已有研究[2223]认为是人造地表减小导致的生境质量提高,而本研究认为水域面积增加是导致生态保护情景下生境质量提高的重要原因。

      本研究中,各项参数主要来自已有成果,评估结果会有一定偏差,需通过实证调研优化各项参数。进行情景模拟时,将坡度≤8°且海拔≤2000 m的区域定为优质耕地,作为限制图层,导致自然发展情景下的土地利用空间分布与耕地保护情景相似,后续应进一步优化限制转换区。此外,研究中定性阐述了气候变化与人类活动对曲靖市生境质量变化的影响,难以为区域优化调控提供较强科学依据,后续应采用SSP-RCP数据进行区域生境质量预测。

    • 曲靖市北部为林地和草地集中区,南部以耕地和建设用地为主,草地和林地为研究区主要用地类型,但整体上呈减小趋势且草地优势较为明显。生境质量水平与土地利用类型之间存在高度的空间一致性,北部乌蒙山区为林地分布集中区,也是生境质量最高的地区,其次是草地生境质量较高,城镇人口密集区与农业活动较为强烈的耕作区则为生境质量低值区。生态保护情景为4种发展情景的最理想模式,相较于2020年,未来20 a中等级生境质量面积呈缓慢减小趋势,低等级生境质量面积呈增加趋势。

Reference (33)

Catalog

    /

    DownLoad:  Full-Size Img  PowerPoint
    Return
    Return