2024 Vol. 41, No. 5
2024, 41(5): 887-897.
doi: 10.11833/j.issn.2095-0756.20240277
Abstract:
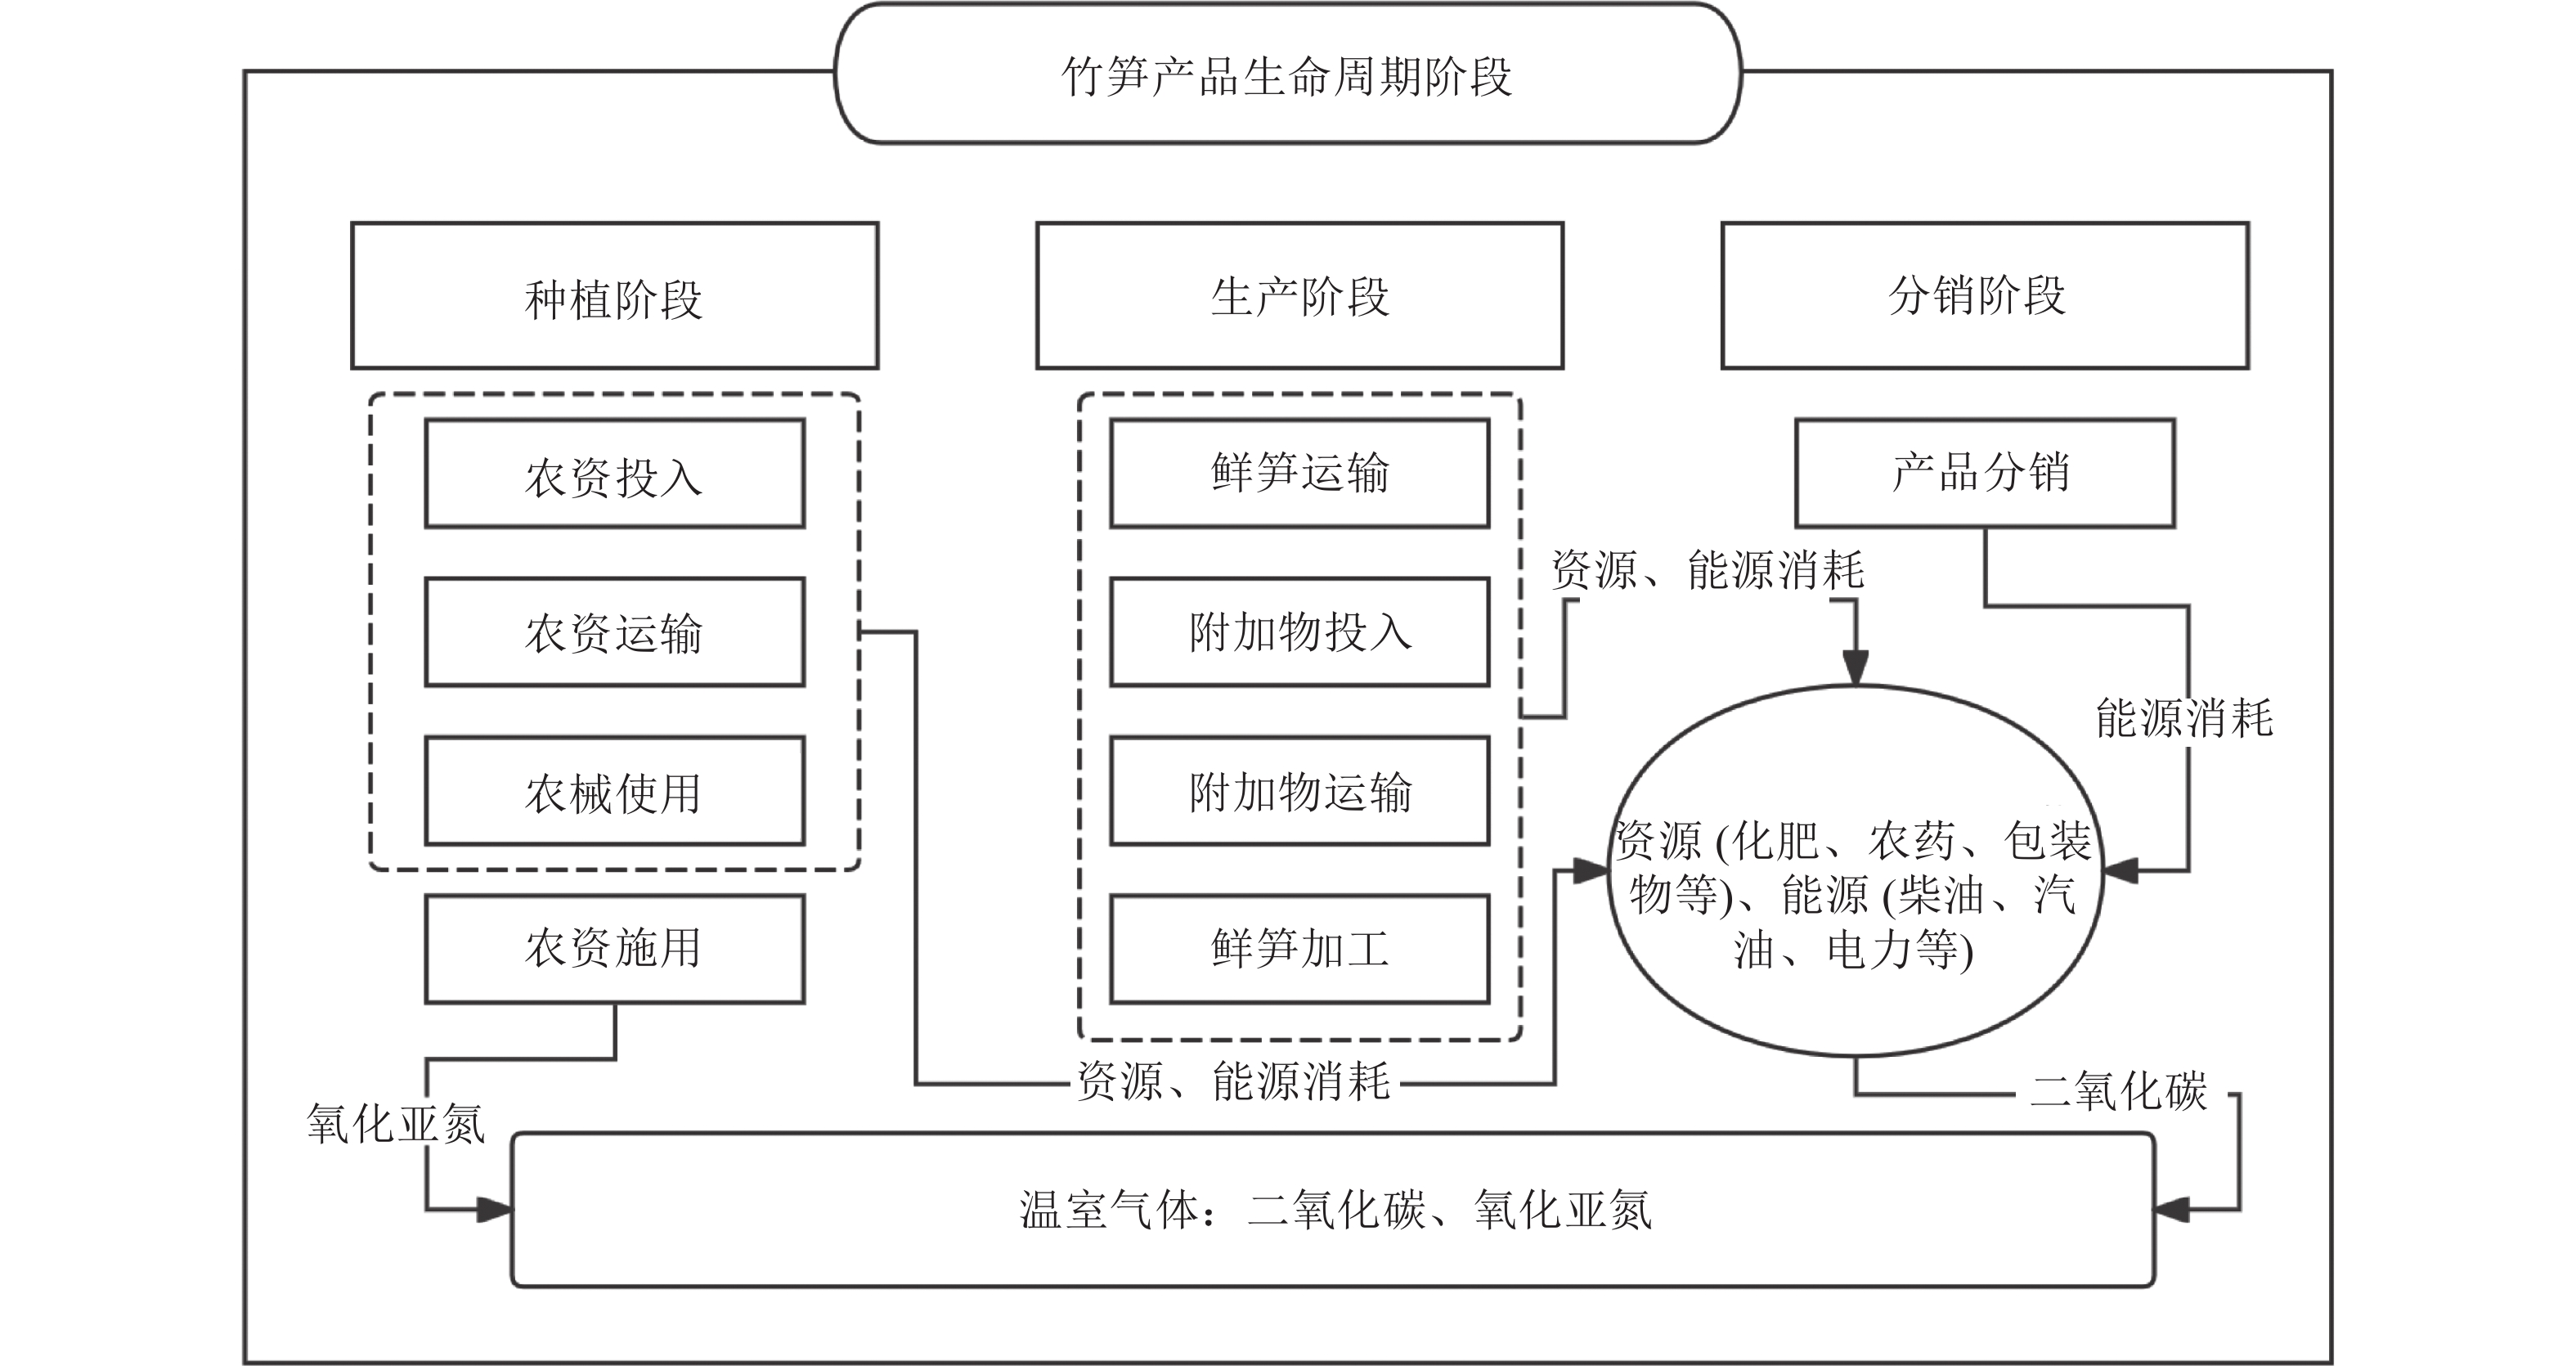
Objective This study aims to assess the carbon footprint of bamboo shoot products and explore their emission reduction potential, so as to promote low-carbon and high-quality development of the industry. Method Based on the field survey data from 2022 to 2023 in Lin’an District of Hangzhou City and Anji County of Huzhou City, Zhejiang Province, this study assessed the carbon footprint of five different types of bamboo shoot export products (seasoned bamboo shoots, hand-peeled bamboo shoots, dried bamboo shoots, boiled bamboo shoots, and fresh bamboo shoots) during the planting, production and distribution stages, identified carbon emission hotspots, designed emission reduction pathways, and calculated emission reduction based on scenario assumptions. The implied carbon emission and carbon emission intensity of bamboo shoot export products in China were estimated according to the export situation of bamboo shoot products in China from 2015 to 2023. Result (1) The carbon footprint of the five bamboo shoot products from large to small was as follows: seasoned bamboo shoot (1.387 4 kg·kg−1), hand-peeled bamboo shoot (1.010 7 kg·kg−1), dried bamboo shoot (0.927 4 kg·kg−1), boiled bamboo shoot (0.324 9 kg·kg−1), and fresh bamboo shoot (0.174 8 kg·kg−1). The carbon footprint composition analysis showed that the carbon emission hotspots of the five bamboo shoot products were mainly agricultural inputs, fresh shoot transportation, fresh shoot processing and additive inputs. (2) From 2015 to 2023, the average annual implied carbon emission of bamboo shoot exports in China was 1.848 2×10⁵ t, with an average carbon emission intensity of 0.966 9 tons per 10 000 yuan. (3) The emission reduction scenario design based on carbon emission hotspots showed that the average decrease in carbon footprint of the five bamboo shoot products in 2023 was 20.15%. Conclusion There are significant differences in the carbon footprint of different types of bamboo shoot products. The implied carbon emissions of bamboo shoot products exported from 2015 to 2023 show a fluctuating downward trend. The comprehensive implied carbon emission intensity shows a fluctuating upward trend. The carbon emission hotspots of bamboo shoot products vary, and there is potential for further reduction in carbon footprint through emission reduction measures. [Ch, 2 fig. 7 tab. 36 ref.]
2024, 41(5): 898-908.
doi: 10.11833/j.issn.2095-0756.20240156
Abstract:
Objective The aim is to explore the spatiotemporal evolution law and influencing factors of carbon emissions in planting industry in Zhejiang Province, in order to develop a carbon sequestration and emission reduction plan and promote low-carbon and green transformation of planting industry in Zhejiang Province. Method Based on the energy input data of planting industry in Zhejiang Province, the carbon emission coefficient method was used to assess the spatiotemporal evolution of carbon emissions of planting industry in Zhejiang Province from 2006 to 2021. Combined with Logarithmic Mean Weighted Divisia Index(LMDI), the driving factors of carbon emissions changes in planting industry were analyzed, and the grey prediction model was used to predict the carbon emissions of planting industry from 2022 to 2040. Result (1) From 2006 to 2021, the overall carbon emissions from planting industry in Zhejiang Province showed an upward trend followed by a downward trend, with an annual variation rate of −1.80%, and a total cumulative carbon emission of 129 million tons. Between 2006 and 2012, carbon emissions slowly increased and then sharply decreased after reaching a peak in 2012, with an average annual decline of 2.94%. (2) The carbon emissions from planting industry in Zhejiang Province showed a distribution pattern of high in the central region and low in the north and south. Hangzhou, Jinhua and Taizhou in the central region were the main carbon emitting regions, accounting for 39.86% of the province’s carbon emissions. (3) The improvement of planting industry efficiency and the optimization of regional industrial structure played a promoting role in carbon reduction, and the improvement of economic development level, the increase of population size, and the optimization of agricultural production structure were the driving factors that caused the increase in carbon emissions, among which the level of economic development was the dominant factor affecting the changes in carbon emissions, accounting for 41.58% of the total carbon emissions change. (4) The grey prediction model prediction results showed that the carbon emissions from planting industry in Zhejiang Province would continue to decline from 2022 to 2040, and the carbon emissions in 2040 would decrease to 37.20% of those in 2021. Among them, Hangzhou, Jiaxing, Shaoxing and Jinhua would have the largest decline. Conclusion Planting industry in Zhejiang Province has achieved carbon peak. To ensure a continuous decline in carbon emissions in the future, we should focus on optimizing agricultural production technology and adjusting industrial structure, applying chemical fertilizers rationally, improving planting efficiency, reducing energy consumption, and speeding up modernization of green agriculture, so as to accelerate the achievement of carbon neutrality goal. [Ch, 4 fig. 2 tab. 37 ref.]
2024, 41(5): 909-918.
doi: 10.11833/j.issn.2095-0756.20240373
Abstract:
The implementation of carbon labeling for agricultural products can promote precise and efficient carbon reduction in agricultural sector, support the realization of agricultural ecological value, innovate agricultural income models, and enhance domestic and international market competitiveness. China started late in this respect compared with foreign countries, with insufficient guidance from the top, and it was necessary to accelerate the implementation process. Difficulties existing in the implementation process of carbon labeling for agricultural products were analyzed. On the one hand, the carbon footprint accounting capacity for agricultural products was weak. Due to incomplete accounting standards and the weak data base, the accounting results were incomplete and inconsistent and comparability was low. On the other hand, there was insufficient driving force for the implementation of carbon labeling for agricultural products. Factors such as limited awareness, ability, and motivation of agricultural producers, weak willingness of consumers to pay, and lack of established standards and systems all contributed to limited credibility of accounting and certification results, and funding and other elements of security were not guaranteed. The main paths for promoting the application of carbon labeling for agricultural products were discussed, such as speeding up the development of accounting standards, consolidating the data base, promoting international mutual recognition of standards, data, and results, so as to enhance the capacity of carbon footprint accounting. Then, sound carbon labeling system should be established, including certification system and factor support system. Finally, the promotion of carbon labeling should be intensified by developing green consumption scenarios and providing technical support. [Ch, 2 fig. 1 tab. 45 ref.]
The implementation of carbon labeling for agricultural products can promote precise and efficient carbon reduction in agricultural sector, support the realization of agricultural ecological value, innovate agricultural income models, and enhance domestic and international market competitiveness. China started late in this respect compared with foreign countries, with insufficient guidance from the top, and it was necessary to accelerate the implementation process. Difficulties existing in the implementation process of carbon labeling for agricultural products were analyzed. On the one hand, the carbon footprint accounting capacity for agricultural products was weak. Due to incomplete accounting standards and the weak data base, the accounting results were incomplete and inconsistent and comparability was low. On the other hand, there was insufficient driving force for the implementation of carbon labeling for agricultural products. Factors such as limited awareness, ability, and motivation of agricultural producers, weak willingness of consumers to pay, and lack of established standards and systems all contributed to limited credibility of accounting and certification results, and funding and other elements of security were not guaranteed. The main paths for promoting the application of carbon labeling for agricultural products were discussed, such as speeding up the development of accounting standards, consolidating the data base, promoting international mutual recognition of standards, data, and results, so as to enhance the capacity of carbon footprint accounting. Then, sound carbon labeling system should be established, including certification system and factor support system. Finally, the promotion of carbon labeling should be intensified by developing green consumption scenarios and providing technical support. [Ch, 2 fig. 1 tab. 45 ref.]
2024, 41(5): 919-927.
doi: 10.11833/j.issn.2095-0756.20240141
Abstract:
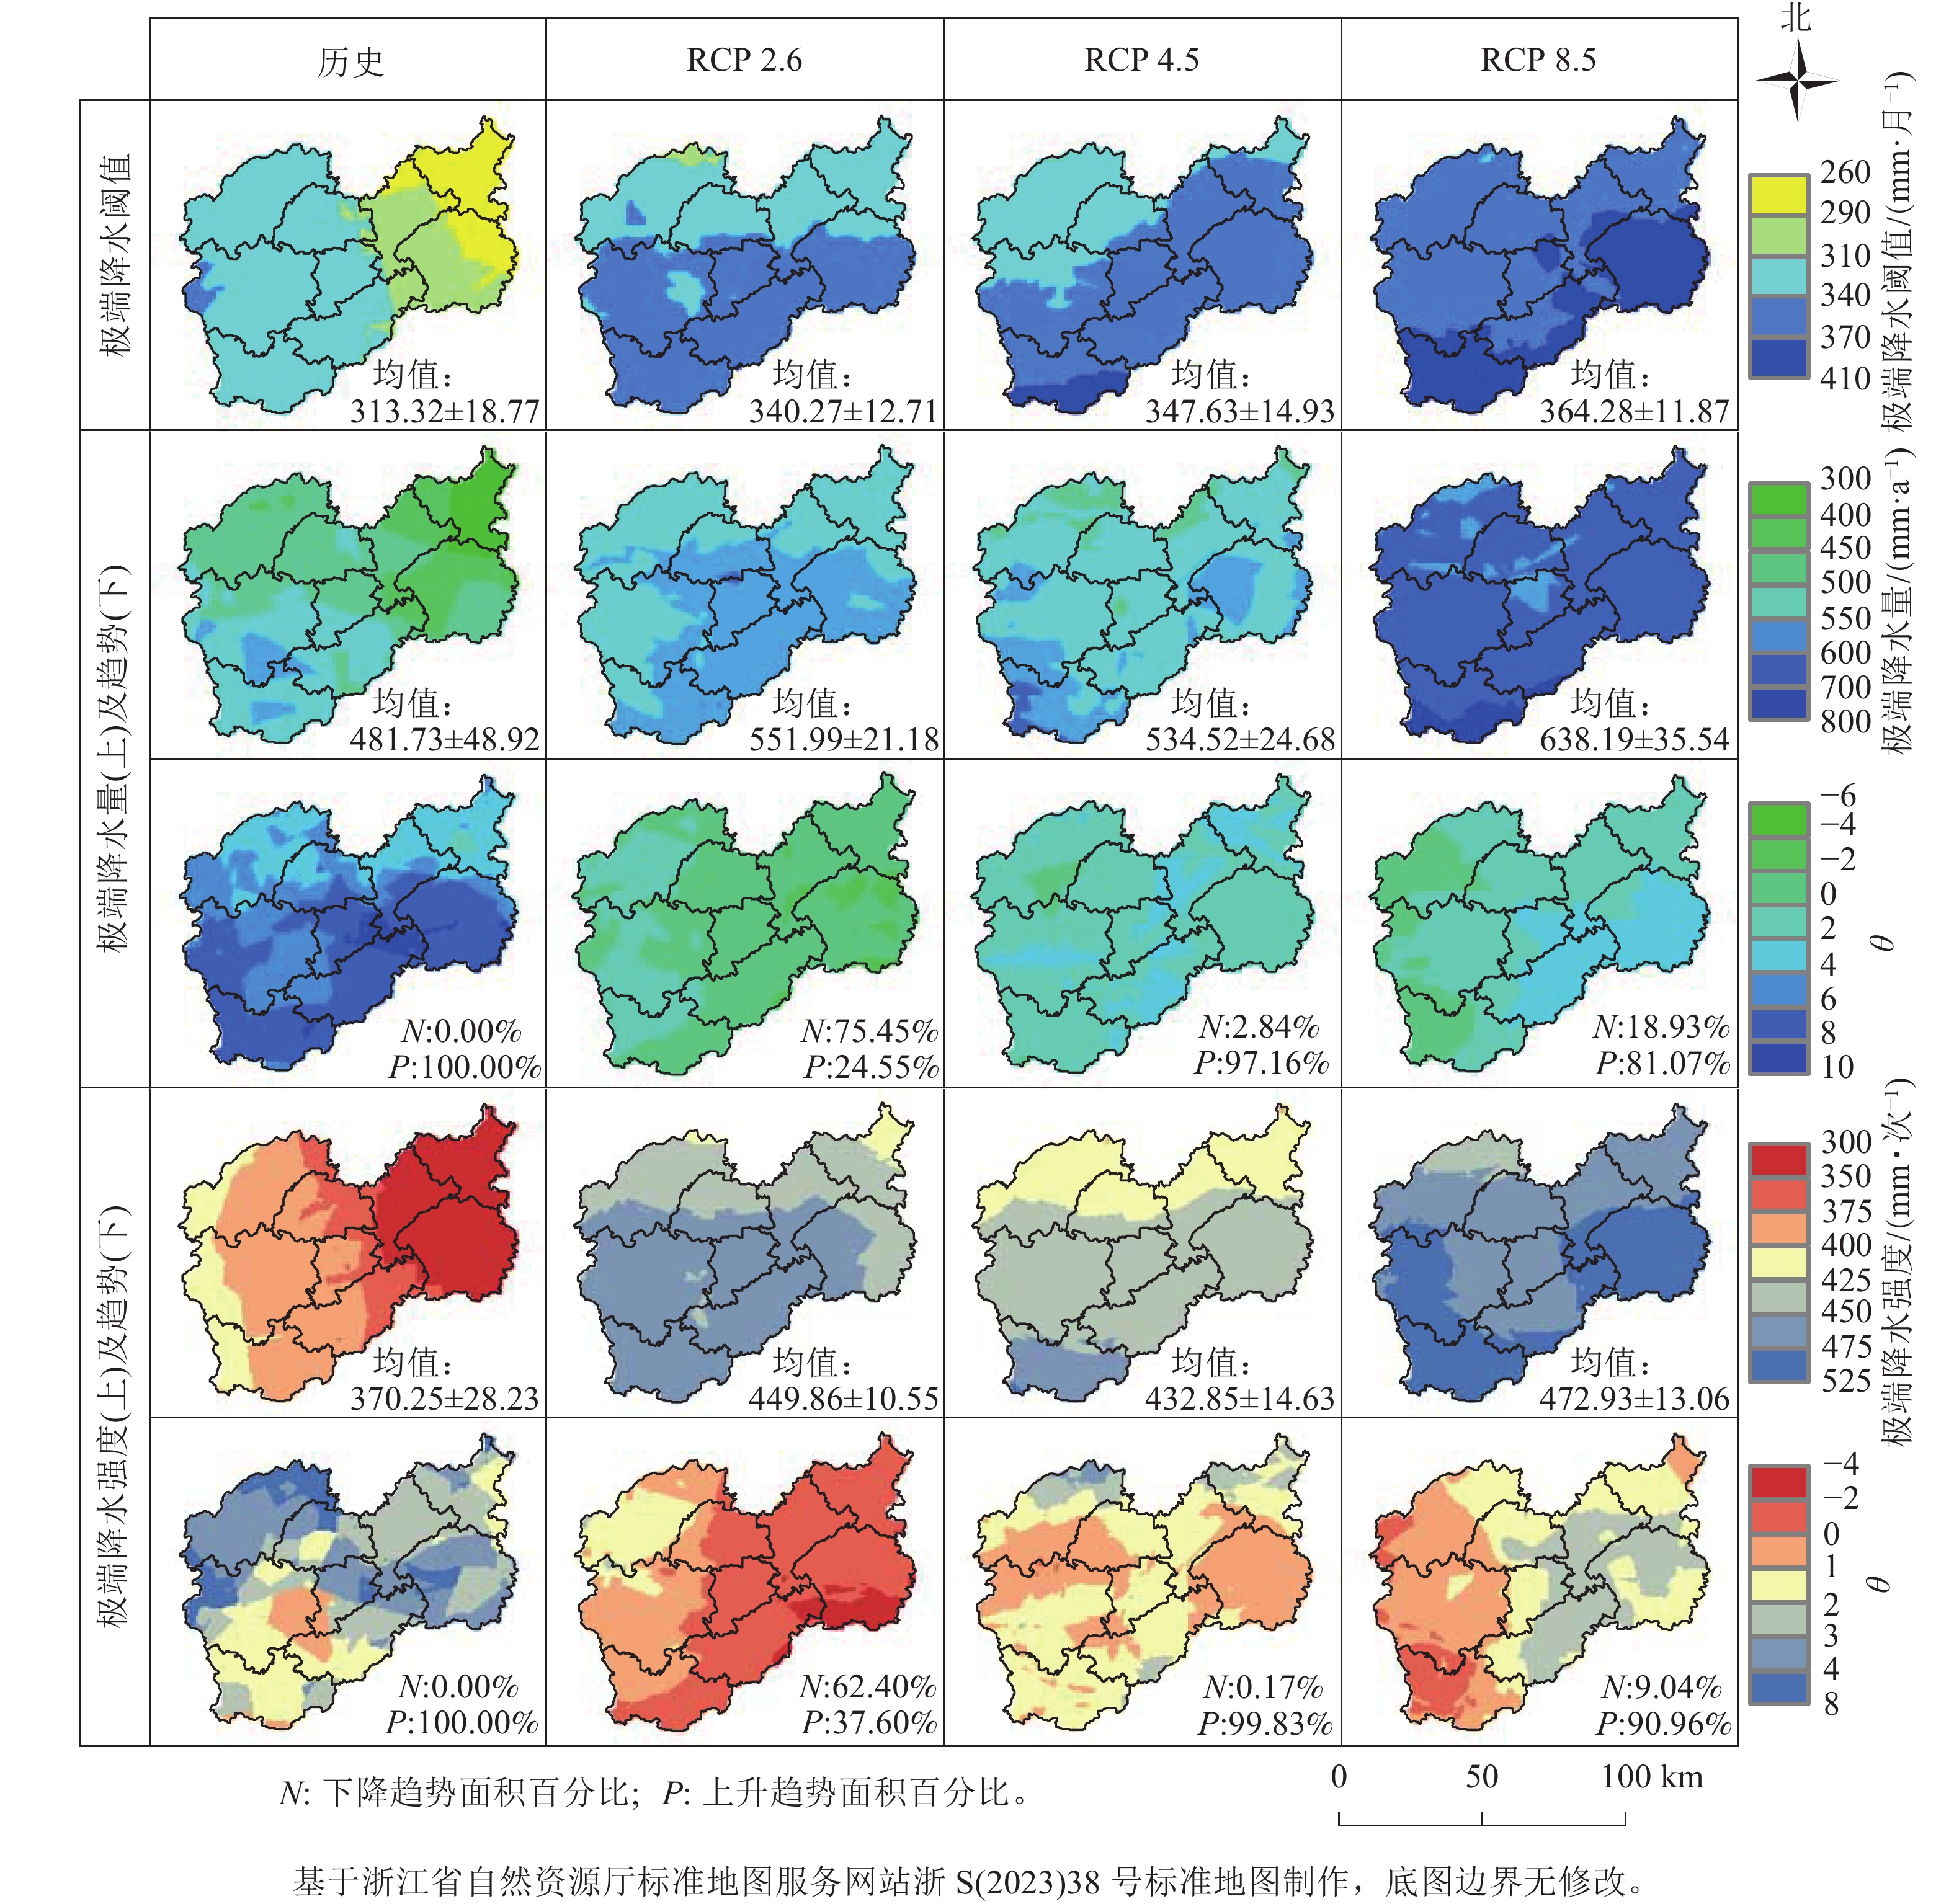
Objective The objective is to simulate and analyze the spatiotemporal evolution trend of forest net ecosystem productivity (NEP) in Lishui City, and reveal its response mechanism to extreme precipitation, so as to provide data support for spatiotemporal assessment of forest carbon sink potential in Lishui. Method The spatiotemporal pattern of forest NEP in Lishui from 1979 to 2079 was simulated under three climate scenarios (RCP 2.6, RCP 4.5, and RCP 8.5) by integrating plot survey, remote sensing observation and InTEC model. The spatiotemporal characteristics of extreme precipitation were analyzed and a structural equation model was constructed to explore the impact of extreme precipitation on NEP. Result (1) The frequency and intensity of extreme precipitation in Lishui during 1979-2015 showed an increasing trend. In the future climate scenario (except RCP 2.6), the extreme precipitation, frequency and intensity of RCP 4.5 and RCP 8.5 would continue to increase, with a higher trend of extreme precipitation events in areas such as Liandu District, Jinyun County and Jingning She Autonomous County. (2) Forest NEP showed an increasing trend from 1979 to 2015, with a growth rate of 20.18 g·m−2·a−1. From 2016 to 2079, forest NEP showed a downward trend under the three climate scenarios, but the total carbon sink showed an increasing trend, with the maximum NEP accumulation reaching 10.97 Pg. (3) From 1979 to 2015, extreme precipitation had positive effects on NEP, while it had negative impacts on NEP under the other two scenarios (RCP 4.5 and RCP 8.5) during 2016-2079, except for RCP 2.6 scenario under which extreme precipitation had no significant effect on NEP. However, extreme precipitation under RCP 8.5 had less impact on NEP than that under RCP 4.5. Conclusion Forests in Lishui demonstrate strong carbon sink capacity, and have high carbon sink potential under future climate scenarios. However, the impact of extreme precipitation on NEP should not be ignored. [Ch, 5 fig. 22 ref.]
2024, 41(5): 928-938.
doi: 10.11833/j.issn.2095-0756.20240162
Abstract:
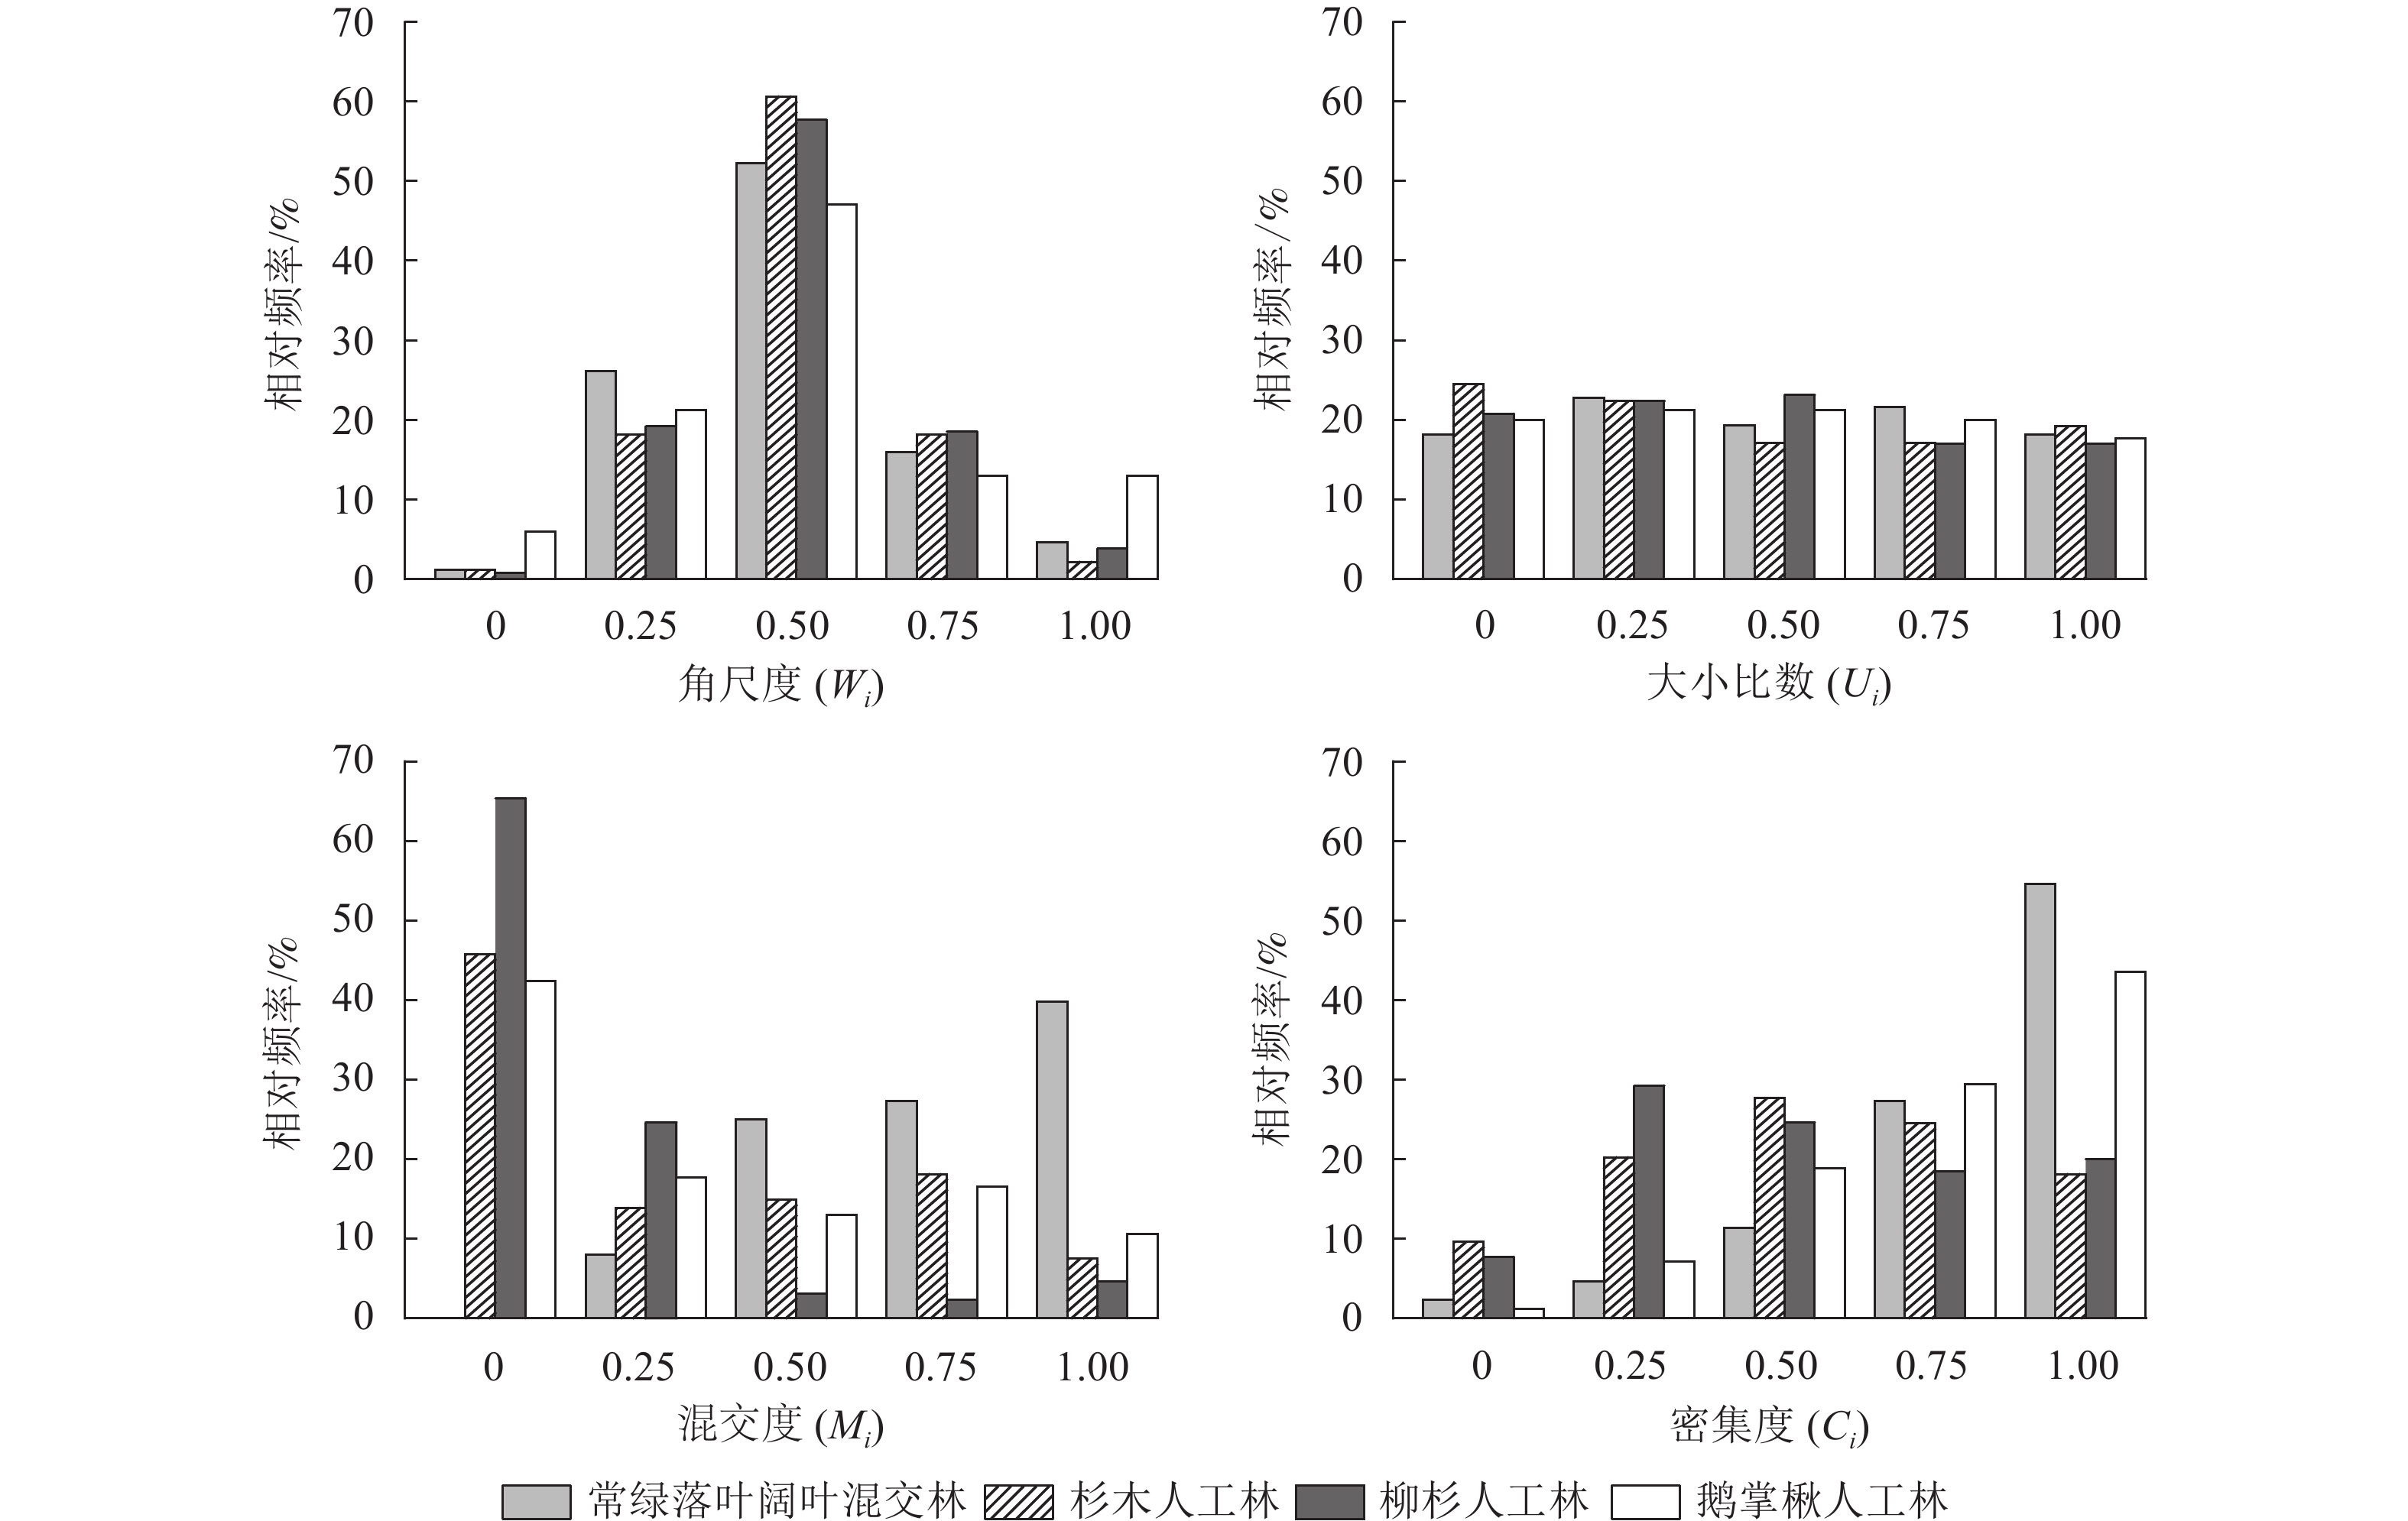
Objective The objective is to comprehensively evaluate the spatial structure of four forest types in Jinzishan state-owned forest farm in Hubei Province, and determine the main factors affecting the forest stand structure in the region, so as to provide a theoretical basis for improving sustainable forest management level and forest quality. Method Based on the measured plot data of evergreen deciduous broad-leaved mixed natural forest, Cunninghamia lanceolata plantation, Cryptomeria japonica var. sinensis plantation and Liriodendron chinense plantation, forest spatial structure indicators such as uniform angle index, neighborhood comparison, mingling degree, and crowding degree were selected, and the unit circle comprehensive evaluation system was applied to comprehensively evaluate the four typical forest types. Result The proportion of random individual trees in different types was the highest, and the proportion of trees in different neighborhood comparison degrees was similar on the whole. The overall distribution of trees in the evergreen deciduous broad-leaved mixed natural forest was random [average value of uniform angle index (\begin{document}$\overline W $\end{document} \begin{document}$\overline M $\end{document} \begin{document}$\overline U $\end{document} \begin{document}$\overline C $\end{document} \begin{document}$\overline W $\end{document} \begin{document}$\overline W $\end{document} \begin{document}$\overline C $\end{document} \begin{document}$\overline C $\end{document} \begin{document}$\overline C $\end{document} Conclusion There are differences in stand structure of different origins in the same region, and the spatial structure of evergreen deciduous broad-leaved mixed natural forest is better than that of Cunninghamia lanceolata, Cryptomeria japonica var. sinensis and L. chinense plantations. [Ch, 2 fig. 6 tab. 37 ref.]
2024, 41(5): 939-948.
doi: 10.11833/j.issn.2095-0756.20240107
Abstract:
Objective This study aims to explore the advantages of acquiring three-dimensional point cloud of forests based on backpack laser scanning (BLS) and unmanned aerial vehicle laser scanning (ULS) technology, and use LiDAR360 MLS and LiDAR360 software to realize accurate measurement of single tree diameter at breast height (DBH) and tree height, meanwhile, determine the optimal method for individual tree segmentation and extraction. Method Taking 6 circular plots of Pinus yunnanensis natural pure forest with a radius of 15.0 m in Luomian Township, Fumin County, Yunnan Province as an example, the iterative closest point algorithm (ICP) was employed to fuse BLS and ULS point cloud. LiDAR360 MLS and LiDAR360 software were used to denoise, classify, normalize, segment individual trees and extracted DBH and tree height of individual trees from the point cloud data. The correlation between measured values and estimated parameters was established by linear fitting, and the estimation effect of DBH and tree height was evaluated. Result Compared with LiDAR360 based on elevation information for classification, LiDAR360 MLS based on deep learning for classification was more in line with reality in the number of tree extraction. The tree extraction results from BLS and fusion point cloud were consistent, and the recall rate reached 100%. ULS performed single tree segmentation through seed points, with accuracy, recall, and F-measure of 94.59%, 88.98%, and 91.70%, respectively. However, due to canopy connectivity, there existed some under-segmentation and over-segmentation. The determination coefficient (R2) and root mean square error (ERMSE) of DBH extraction based on BLS were 0.904 and 2.046 cm, respectively. R2 and ERMSE extracted by tree height were 0.791 and 1.173 m, respectively. The fusion point cloud was affected by discrete points around the trunk, and the DBH extraction effect was relatively poorer than BLS. R2 and ERMSE were 0.881 and 2.284 cm, respectively. However, the information of canopy and understory of fusion point cloud was more complete, and the estimation accuracy of tree height was higher than that of BLS, with R2 and ERMSE values of 0.933 and 0.812 m, respectively. Conclusion Due to differences in working principles, ULS and BLS technologies each have their own advantages in acquiring point cloud from the canopy and understory. The combination of ULS and BLS can achieve a complementary effect, which can reflect the forest spatial structure more precisely, and realize the high-precision extraction of DBH and tree height. [Ch, 5 fig. 3 tab. 28 ref.]
2024, 41(5): 949-958.
doi: 10.11833/j.issn.2095-0756.20240251
Abstract:
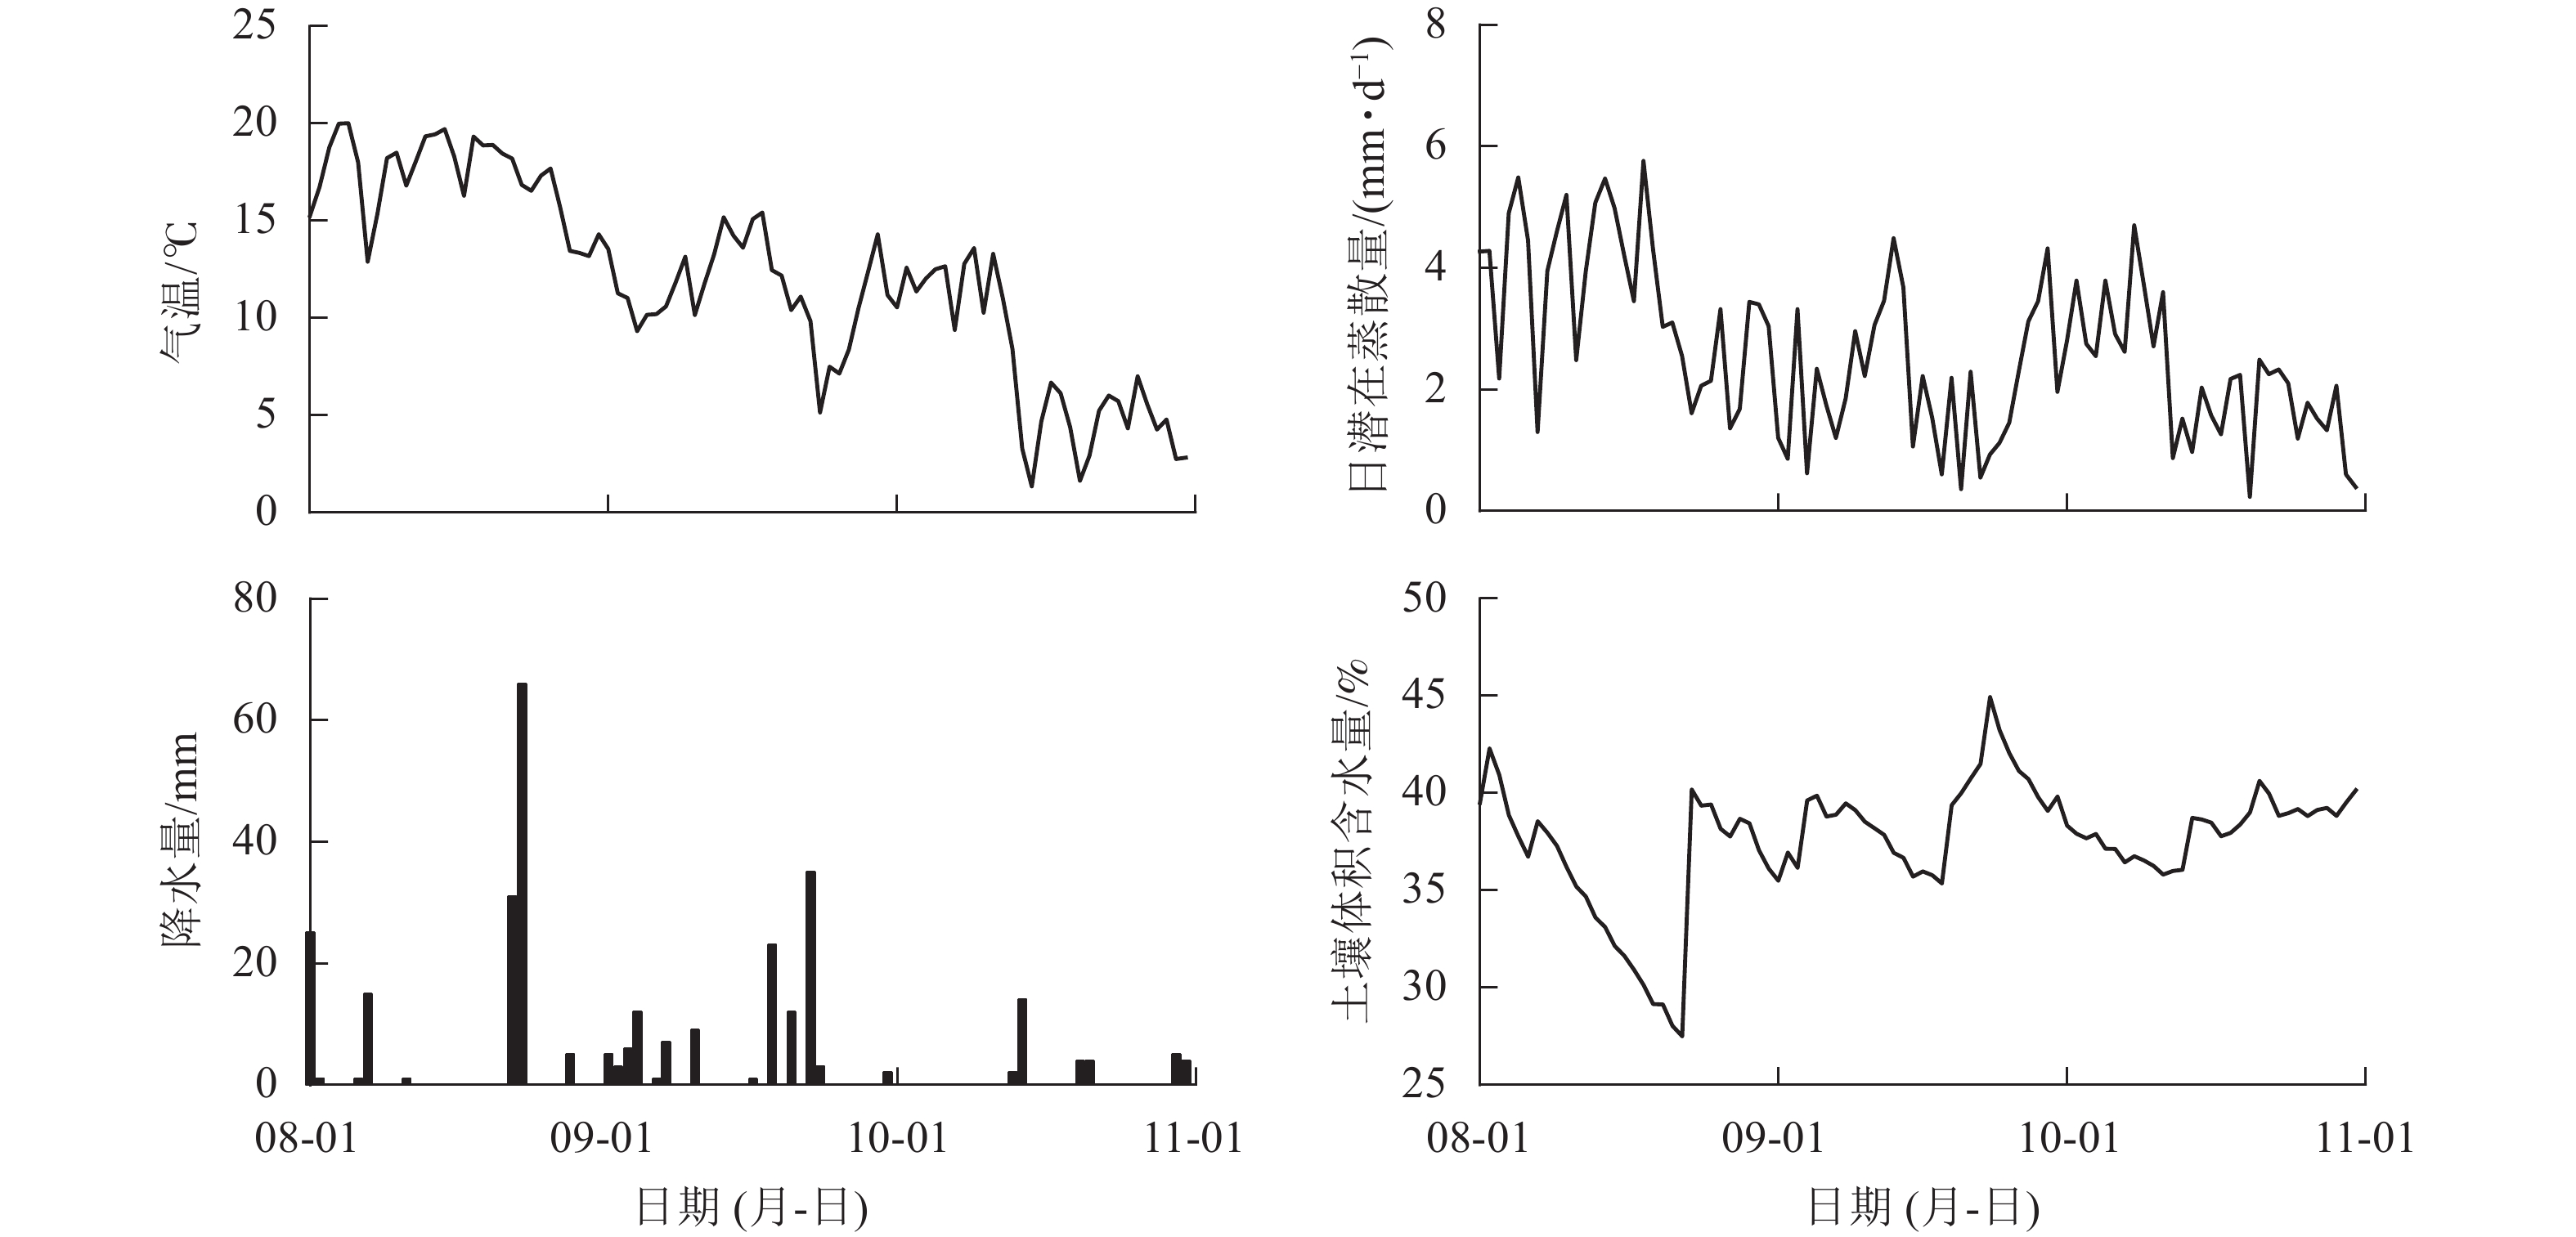
Objective The purpose of this study is to explore the impact of soil moisture on the daily understory evapotranspiration in Larix principis-rupprechtii plantation, so as to provide a theoretical basis for understanding the mechanism of forest evapotranspiration adapting to climate change and developing plans for coordinated forest water management. Method Taking L. principis-rupprechtii plantation in Diediegou small watershed in semi-arid area of Liupan Mountain in Ningxia as the research object, two experiments (blocking precipitation or water-proof input, and natural precipitation input) were conducted. Soil moisture gradient was artificially increased, and the effects of environmental factors (air temperature, solar radiation intensity, precipitation, and so on) on the daily understory evapotranspiration under the two soil moisture conditions were analyzed. Result The daily understory evapotranspiration in August, September and October under natural precipitation condition was 67.06, 36.32 and 29.49 mm·d−1, respectively, which was greater than that under water-proof treatment (54.22, 20.07, and 11.35 mm·d−1). The daily understory evapotranspiration under the two water conditions was characterized by a gradual decrease, and the fluctuations under natural condition was greater than those under water-proof treatment. From August to October, the difference in daily understory evapotranspiration under both water conditions generally showed a wavy pattern of first increasing and then decreasing, while the ratio showed a gradually increasing wavy pattern. In August, September and October, the mean difference between natural evapotranspiration and water-proof evapotranspiration was 0.41, 0.54 and 0.59 mm·d−1, respectively, with ratios of 1.29, 1.91 and 2.74, respectively. As the potential evapotranspiration increased, the ratio of daily evapotranspiration difference to soil volumetric water difference under both water conditions gradually increased. The effect of soil moisture on understory evapotranspiration was small when the daily potential evapotranspiration was less than 3 mm·d−1, but increased when the daily potential evapotranspiration was more than 3 mm·d−1, and increased significantly when the daily potential evapotranspiration was more than 5 mm·d−1. Conclusion The factors affecting daily understory evapotranspiration are roughly the same under both water conditions. The difference lies in that the daily understory evapotranspiration under natural condition is more affected by precipitation, while that under waterproof treatment is more affected by soil moisture. Future study should focus on the influence of multiple soil moisture gradients on understory evapotranspiration difference. [Ch, 7 fig. 1 tab. 28 ref.]
2024, 41(5): 959-969.
doi: 10.11833/j.issn.2095-0756.20230535
Abstract:
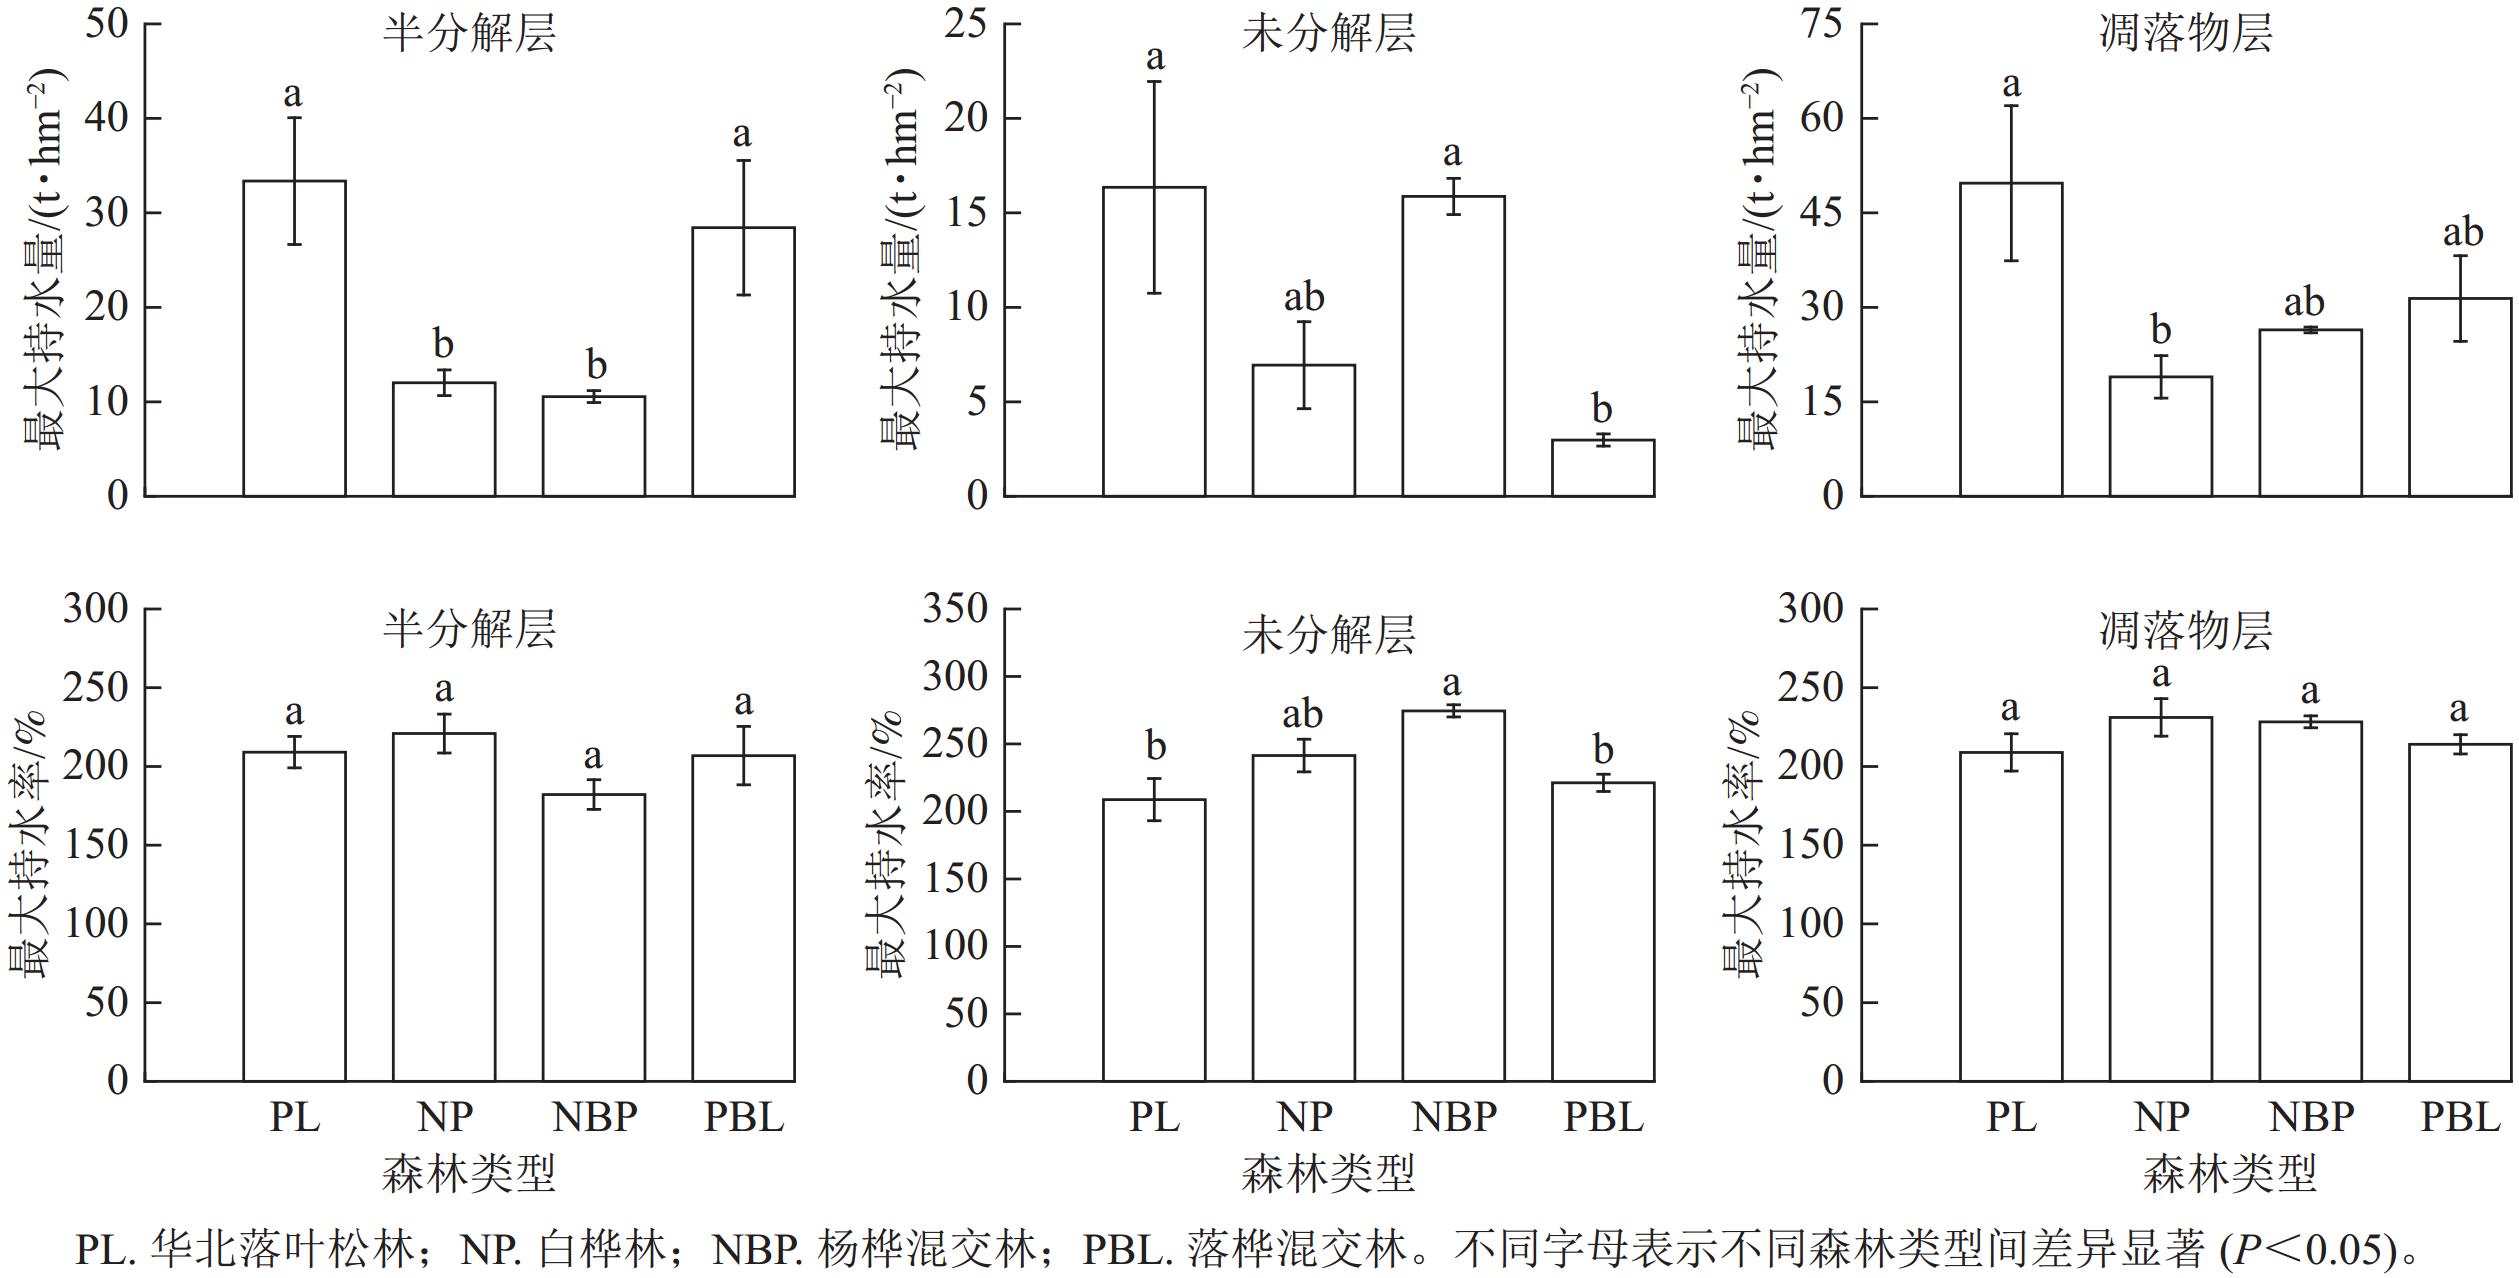
Objective This study, with an investigation of the water conservation capacity of litter layers in different forest types in the Bashang region, an important water conservation functional area in the Beijing-Tianjin-Hebei region, is aimed to provide a basis for the restoration, management and improvement of water and soil conservation in this region. Method With four types of forests, including Larix gmelinii var. principis-rupprechtii (PL), Betula platyphylla (NP), Populus davidiana and B. platyphylla mixed forest (NBP), L. gmelinii var. principis-rupprechtii and B. platyphylla mixed forest (PBL), selected as research objects in the Heping Forest Farm in Zhangjiakou City, field investigations and indoor immersion methods were employed to measure the ecological hydrological indicators of litter layers. Result (1) The thickness of litter layers in different forests ranged from 32.0 to 62.0 mm, with the PBL mixed forest having the thickest litter layer, followed by PL forest, NBP mixed forest, and NP forest. (2) The maximum water holding rate, maximum retention rate, and effective retention rate of litter layers were higher in NP forest and NBP mixed forest than PBL mixed forest and PL forest, with NP forest having the highest values of 231.15%, 207.60%, and 172.94%, respectively, and PL forest having the lowest values of 208.92%, 170.29%, and 138.95%, respectively. (3) The biomass, maximum water holding capacity, maximum retention capacity, and effective retention capacity of litter layers in the four types of forests ranged from 8.27 to 23.33 t·hm−2, 18.96 to 49.71 t·hm−2, 16.73 to 39.05 t·hm−2, and 13.90 to 31.56 t·hm−2, respectively, and the general trend was PL>PBL mixed forest>NBP mixed forest>NP forest. (4) The water holding capacity of litter layers in the four types of forests showed a logarithmic function relationship with the immersion time (R2>0.94) while the water absorption rate showed a power function relationship with the immersion time (R2> 0.92). Conclusion The water absorption performance of litter layers per unit mass in PL forest was weaker than that in NP forest, but when considering the biomass, the total water holding and retention capacity of PL forest was significantly higher than NP forest, indicating a strong comprehensive water conservation capacity. [Ch, 5 fig. 3 tab. 38 ref.]
2024, 41(5): 970-977.
doi: 10.11833/j.issn.2095-0756.20240161
Abstract:
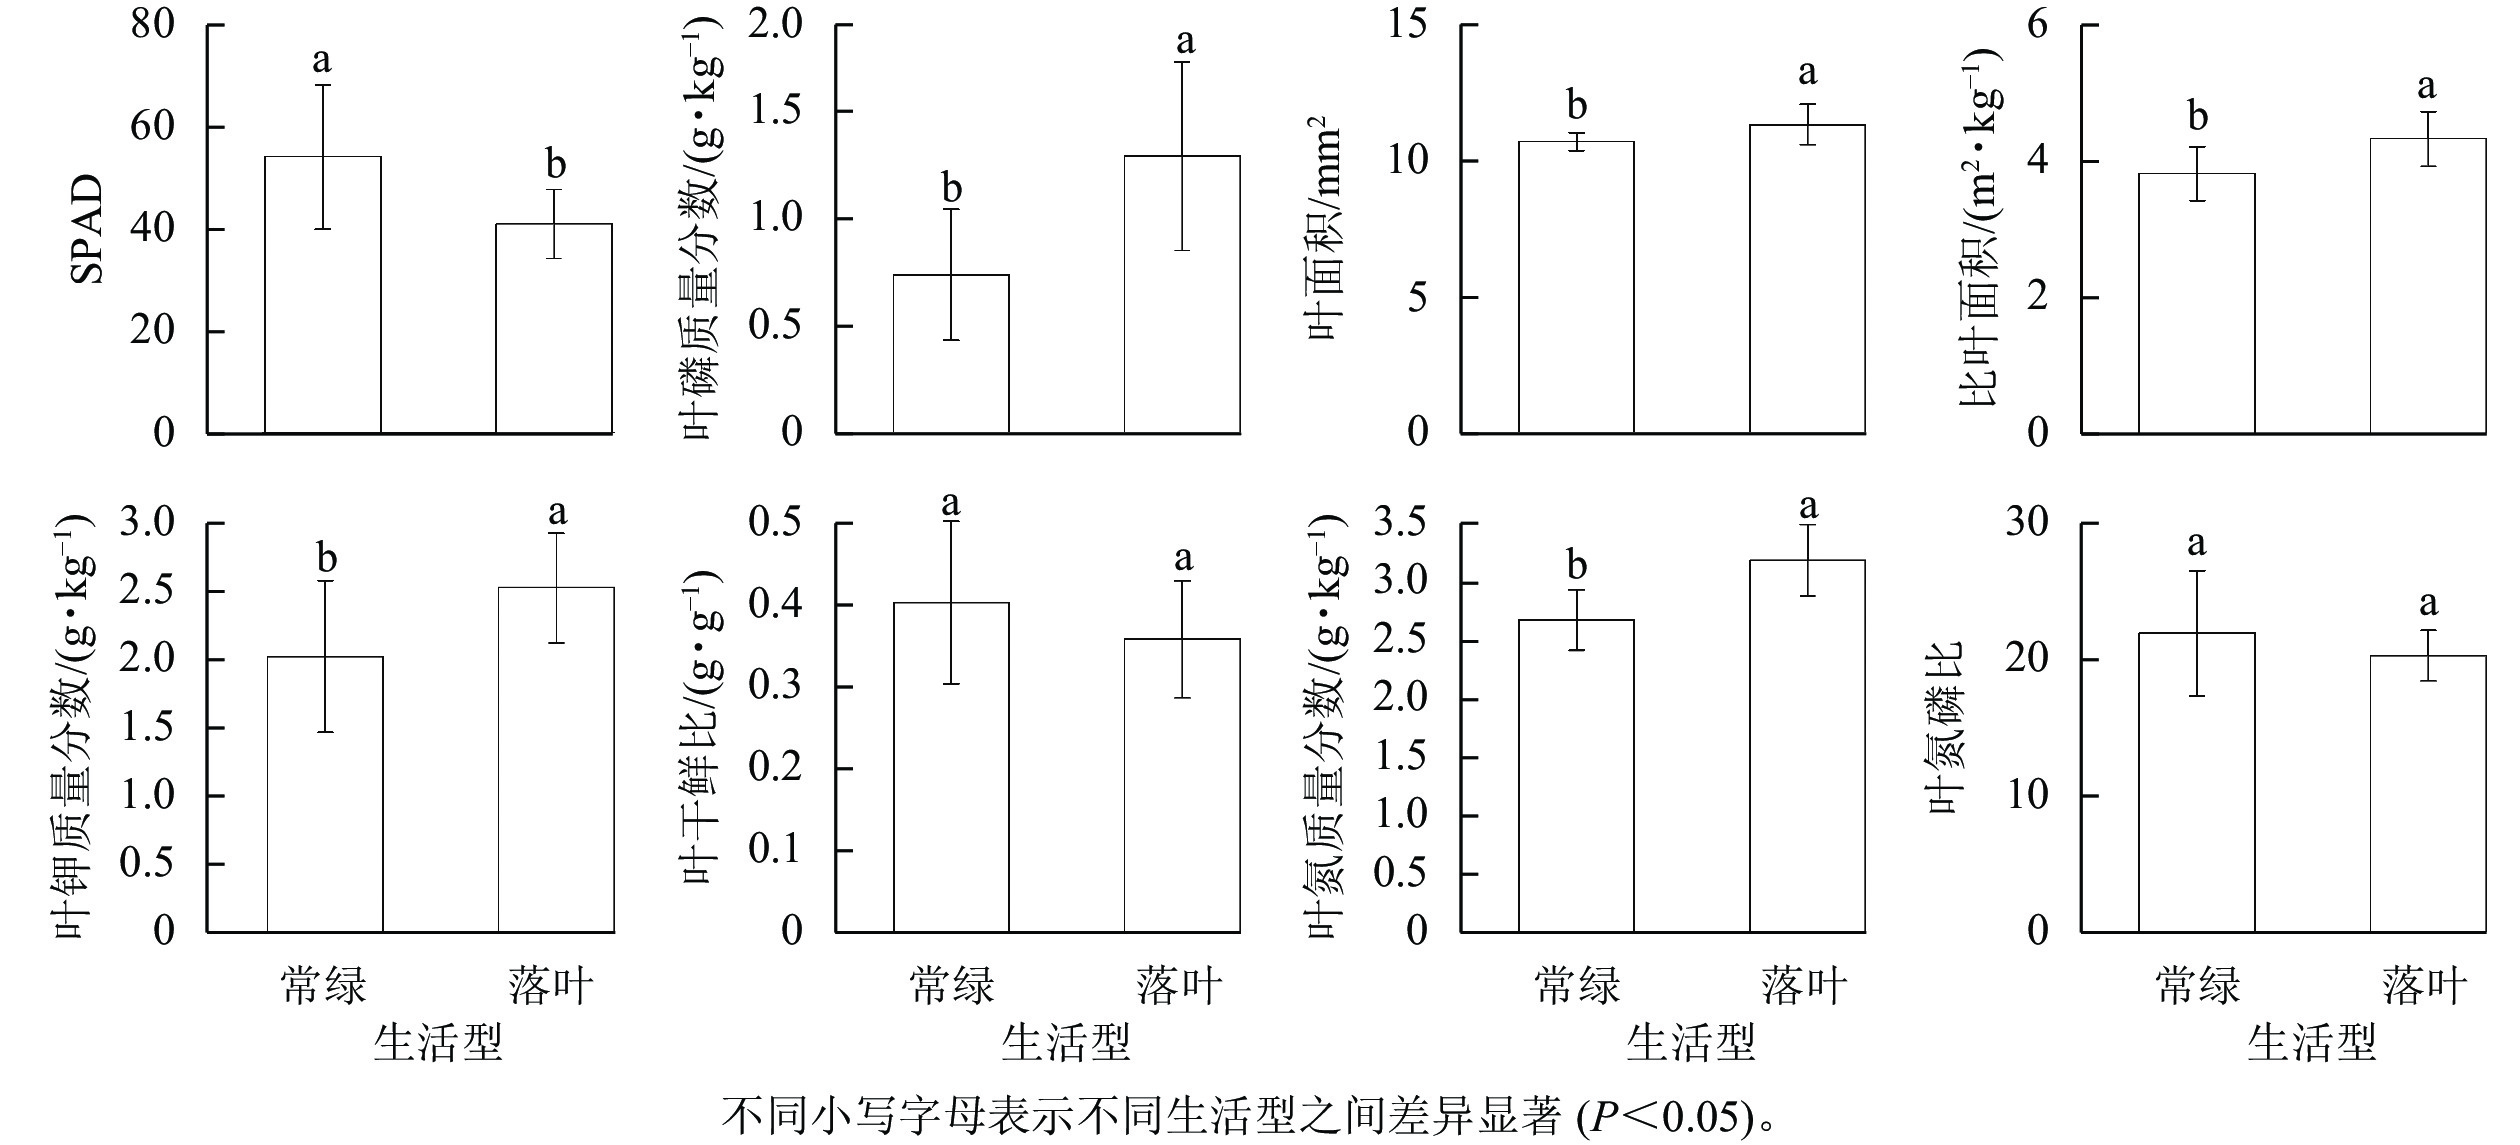
Objective This study aim to explore the variation of leaf functional traits among different life forms of woody plants on the northern edge of the Dabie Mountains, investigate the coupling relationship between indicators of leaf functional traits, and provide a basis for deciphering the response mechanisms of plants to climate change. Method Leaf functional traits of 30 common woody plants with different life forms (evergreen, deciduous, arbor, shrub) in Liankangshan National Nature Reserve on the northern edge of the Dabie Mountains were collected, and eight leaf functional traits including chlorophyll content, dry/fresh ratio, nitrogen content, phosphorus content, potassium content, nitrogen/phosphorus ratio, leaf area, and specific leaf area were determined. The leaf functional traits and their correlations of different life forms of woody plants were analyzed. Result There were certain differences in leaf functional traits among different life forms of woody plants, among which the average chlorophyll content, nitrogen content, phosphorus content, potassium content, leaf area, and specific leaf area of evergreen and deciduous trees showed significant differences (P<0.05). The average leaf area, nitrogen content, phosphorus content, potassium content, dry/fresh ratio, and nitrogen/phosphorus ratio of arbor and shrub showed significant differences (P< 0.05). There were certain correlations between some leaf functional traits, such as positive correlation between leaf nitrogen and phosphorus content and potassium content (P< 0.05), significant positive correlation between leaf nitrogen content and phosphorus content (P<0.05), positive correlation between leaf area and leaf nitrogen, phosphorus, potassium content (P<0.05), and positive correlation between specific leaf area and leaf nitrogen, phosphorus, potassium content (P< 0.05). The principal component analysis results showed that the leaf phosphorus, nitrogen, and potassium contents were important indicators of leaf functional traits, and the 30 woody plants could be classified into four functional groups based on the first and second principal components, with the contribution rates of 55.2% and 12.8% to the variation of plant leaf functional traits respectively. Conclusion There exists a certain pattern of variation in leaf functional trait indicators among different life forms of woody plants. Among them, leaf phosphorus, nitrogen, and potassium mass fractions are indicative indicators, and they are significantly positively correlated with leaf area. [Ch, 4 fig. 1 tab. 28 ref.]
Diversity characteristics of herbaceous species under Robinia pseudoacacia forest in different years
2024, 41(5): 978-985.
doi: 10.11833/j.issn.2095-0756.20240128
Abstract:
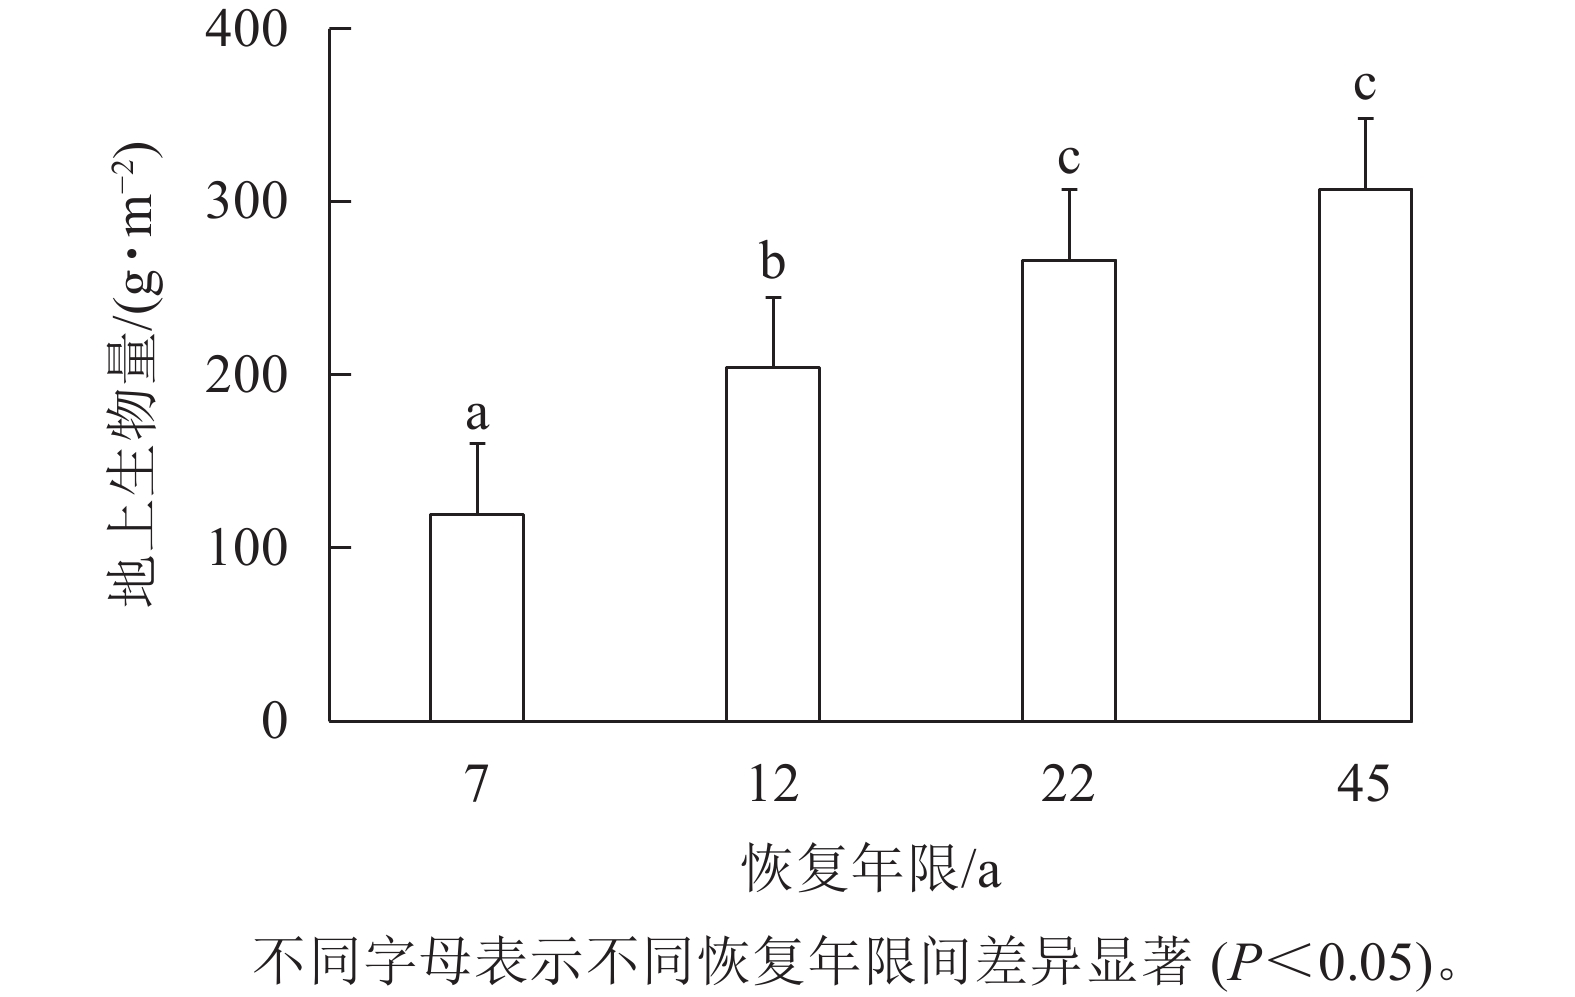
Objective This study, with an investigation into the species composition and diversity index of herbaceous layer under Robinia pseudoacacia forests in the hilly gully region of the Loess Plateau, is aimed to explore the characteristics and main influencing factors of its diversity index, in order to provide reference for the practice of regional vegetation restoration. Method With the R. pseudoacacia forests in different years (7, 12, 22 and 45 years) in Zichang City selected as study subjects, the species composition of the herbaceous layer in the understorey of R. pseudoacacia forests of different years were investigated employing the “space instead of time” method and the plot survey method before an analysis was conducted of the main factors influencing the diversity index using redundancy analysis (RDA). Result (1) There were 55 species of herbaceous species in R. pseudoacacia forests of different years, belonging to 18 families, and their dominant species were mainly Asteraceae, Gramineae and Leguminosae, with the overall performance showing that the dominant species belong to a few families, while the subordinate species belong to most families; the Artemisia vulgaris, A. caruifolia and A. gmehinii have higher importance values; (2) The aboveground biomass of understory herbaceous in R. pseudoacacia forests increased with years, and planting years increased significantly the aboveground productivity of the herbaceous layer (P<0.05). (3) Ammonium nitrogen, soil organic carbon, soil moisture and total phosphorus were the main factors influencing the Margalef and Simpson index of species diversity as well as aboveground biomass of the understory herbaceous layer whereas total nitrogen, total phosphorus, ammonium nitrogen, and soil silt were the main factors affecting Shannon-Wiener and Pielou index. Conclusion The herbaceous layer of R. pseudoacacia forests in the study area showed different species diversity at different years. Artemisia plants showed great adaptive ability at different years, and species diversity indicators and biomass are significantly affected by soil moisture and nutrients. Therefore, it is important to focus on the balance of soil moisture and nutrients in future afforestation practices in the Loess Plateau region to enhance the stability and sustainability of plantation ecosystem development. [Ch, 2 fig. 2 tab. 31 ref.]
2024, 41(5): 986-995.
doi: 10.11833/j.issn.2095-0756.20230604
Abstract:
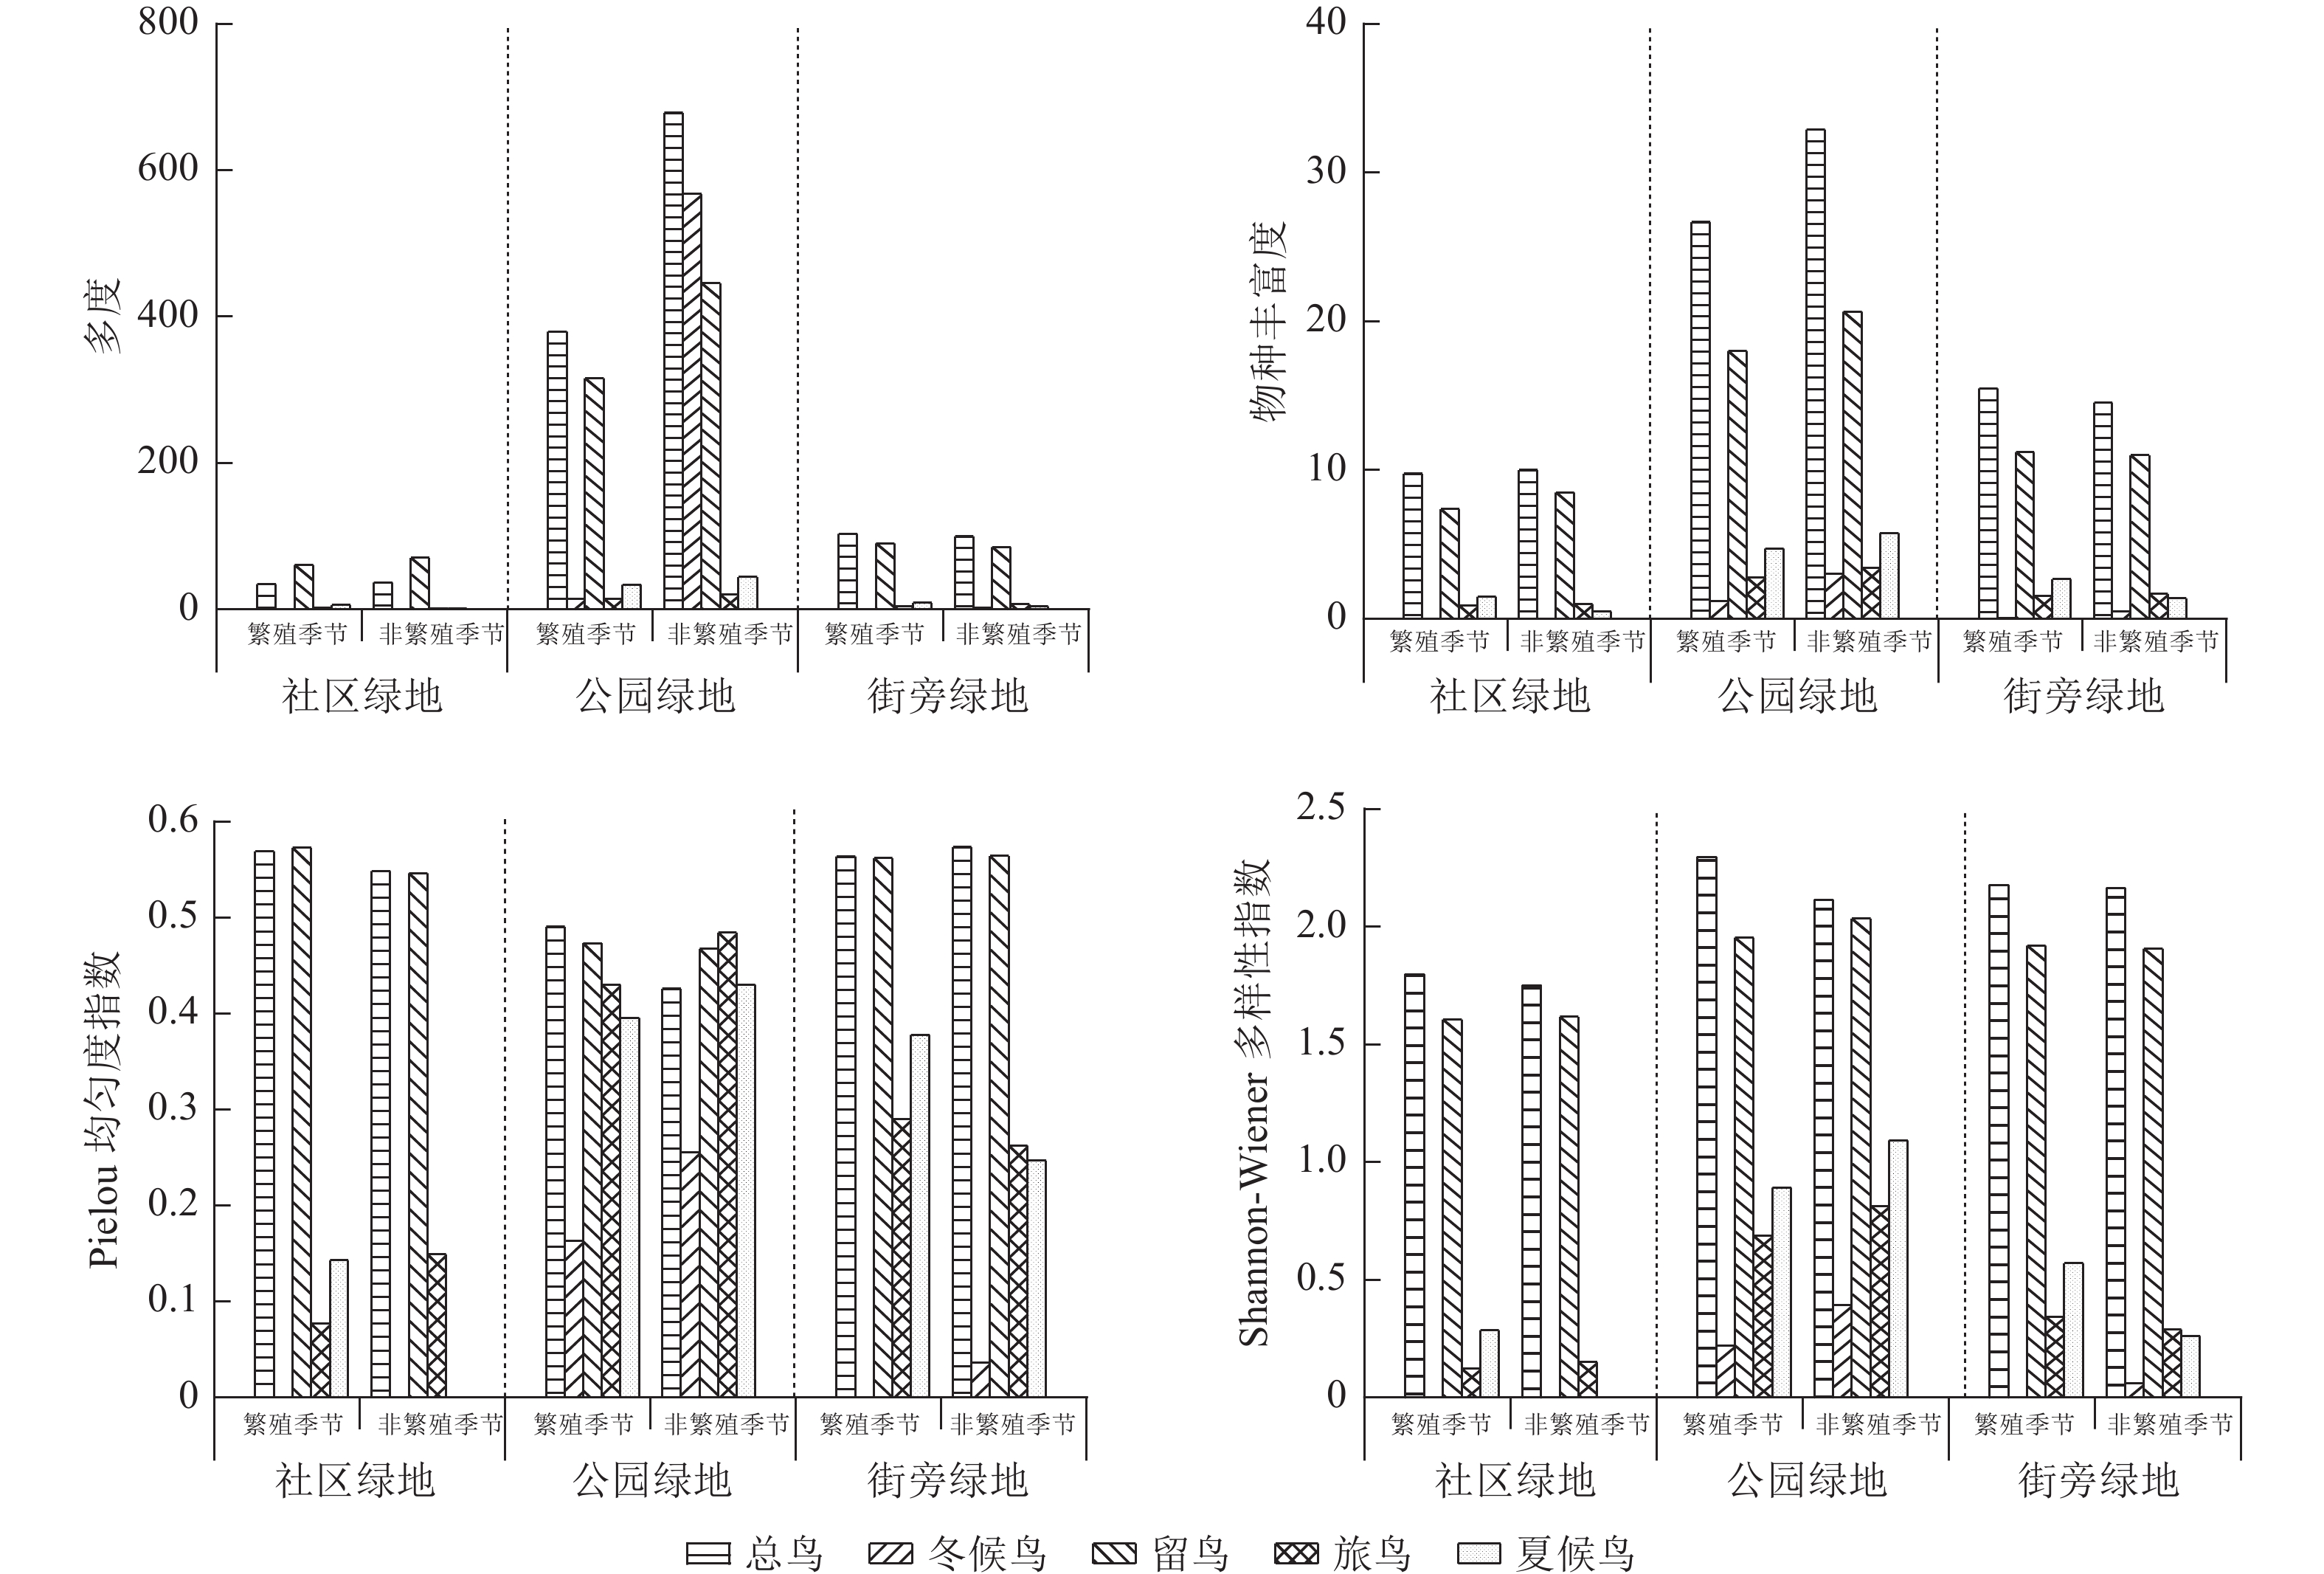
Objective The objective of this study is to investigate bird communities in parks, roadside green spaces, and community green spaces in Kunming urban construction zone, analyze the differences in bird community composition across different recreational green spaces and their root causes, and explore the impact of urban green space environments on bird communities. Method From July 2021 to August 2022, birds were investigated in three types of recreational green spaces in Kunming City. Redundancy analysis and multiple linear regression were used to analyze the relationship between the diversity of resident birds and environmental factors during breeding and non-breeding seasons. Result (1) A total of 31 058 individuals in 176 species were recorded, belonging to 17 orders and 53 families, which included 1 species under national first-class key protection and 12 species under national second-class key protection. (2) Parks had the highest richness, abundance, and Shannon-Wiener diversity index of bird species, followed by roadside green spaces, and community green spaces had the lowest. However, the Pielou evenness index showed the opposite trend. (3) Redundancy analysis indicated that other internal environmental factors, except for the green space shape index, had a promoting effect on improving bird diversity. (4) Multiple linear regression showed the building index in buffer zones of 50 and 400 m was negatively correlated with bird diversity. The distance from the city center was positively correlated with bird diversity. The distance from Dian Lake was negatively correlated with bird diversity in roadside green spaces. The distance from the mountain was positively correlated with bird diversity in roadside green spaces, but negatively correlated with bird diversity in community green spaces. Conclusion In the future construction of recreational green spaces, it is necessary to reduce the impact of surrounding buildings on parks and roadside green spaces, increase heterogeneous landscape habitats, and focus on enhancing the richness of vegetation communities inside community green spaces. [Ch, 3 fig. 3 tab. 28 ref.]
2024, 41(5): 996-1004.
doi: 10.11833/j.issn.2095-0756.20240114
Abstract:
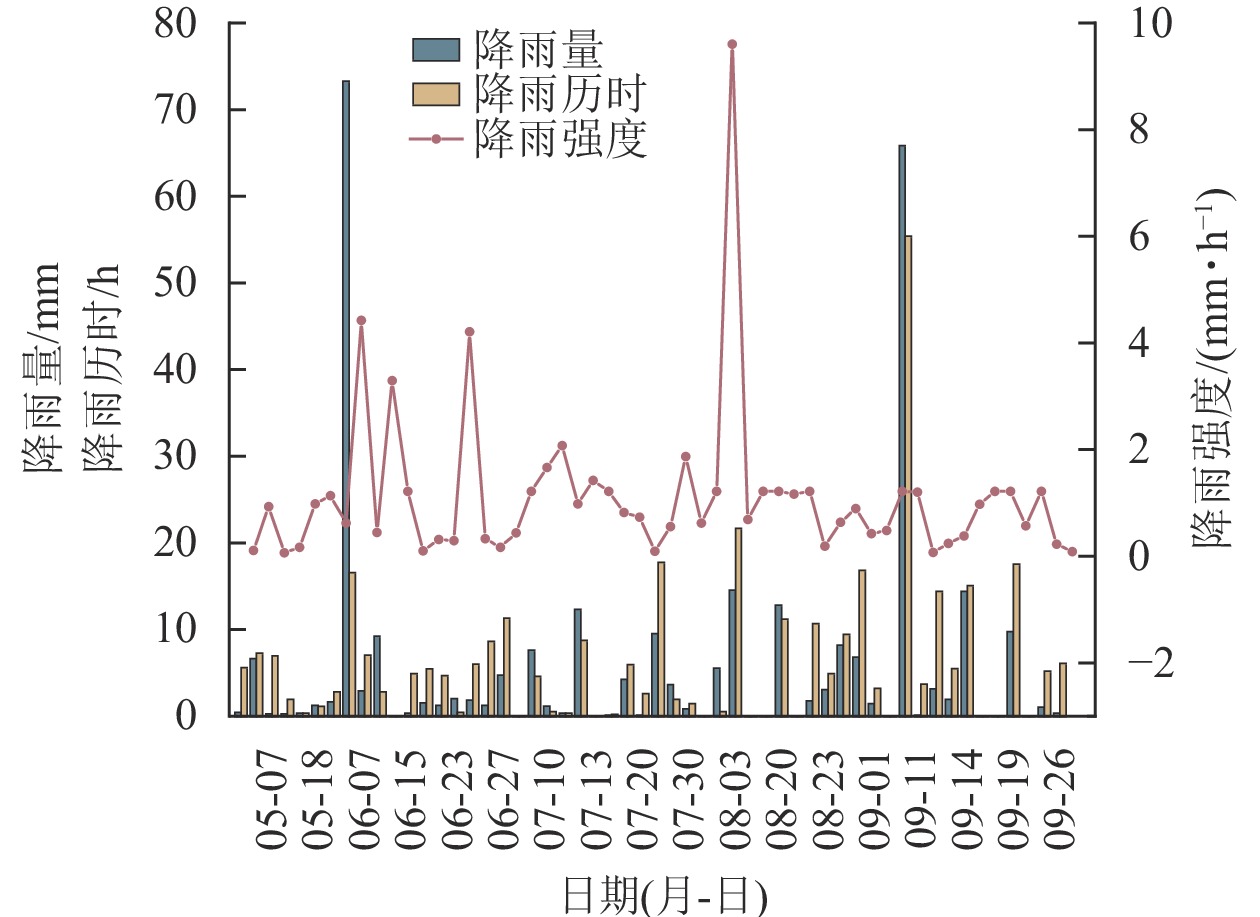
Objective This study, with an exploration of the effects of typical afforestation tree species and level bench measure on soil moisture dynamics in 0−180 cm soil layer in the loess region of western Shanxi Province, is aimed to provide a reference for vegetation restoration and comprehensive watershed management. Method Taking the level bench , which is a typical engineering measure and the main afforestation tree species (Robinia pseudoacacia and Platycladus orientalis) in Caijiachuan watershed in the loess plateau region of western Shanxi as the research objects, the soil moisture was monitored in the growing season of 2019 (May − September), with a synchronous observation made of the soil moisture of natural slopes of R. pseudoacacia and P. orientalis using the paired experimental design before an analysis was conducted of the soil moisture characteristics under the comprehensive influence of different vegetation types and level bench and the response process to rainfall events and the effects of typical engineering measures on soil moisture of different vegetation types were evaluated. Result The changes of soil moisture before and after soil preparation with different vegetation types and level bench were closely related to the changes of rainfall and the average soil moisture decreased from level bench-P. orientalis (18.68%), slope-P. orientalis (16.19%), level bench-R. pseudoacacia (16.10%) to slope-R. pseudoacacia (15.42%). Compared with natural slope, level bench could increase the soil moisture of P. orientalis and R. pseudoacacia by 15.38% and 4.41% respectively and according to the vertical variation characteristics of soil moisture, level bench could significantly increase the depth of active layer and secondary active layer of soil moisture: the depth of horizontal active layer and secondary active layer of P. orientalis ranged from 0 to 80 cm, which was 33% higher than that of P. orientalis slope while the depth of horizontal active layer and secondary active layer of R. pseudoacacia ranged from 0 to 140 cm, which was 40% higher than that of R. pseudoacacia slope. Conclusion The dynamic change of soil water content is closely related to rainfall, engineering measures and vegetation. Level bench is an effective engineering measure to carry out ecological restoration in small watershed of loess plateau, and the lifting effect of P. orientalis level bench is better than that of R. pseudoacacia level bench. [Ch, 3 fig. 3 tab. 37 ref.]
2024, 41(5): 1005-1012.
doi: 10.11833/j.issn.2095-0756.20230626
Abstract:
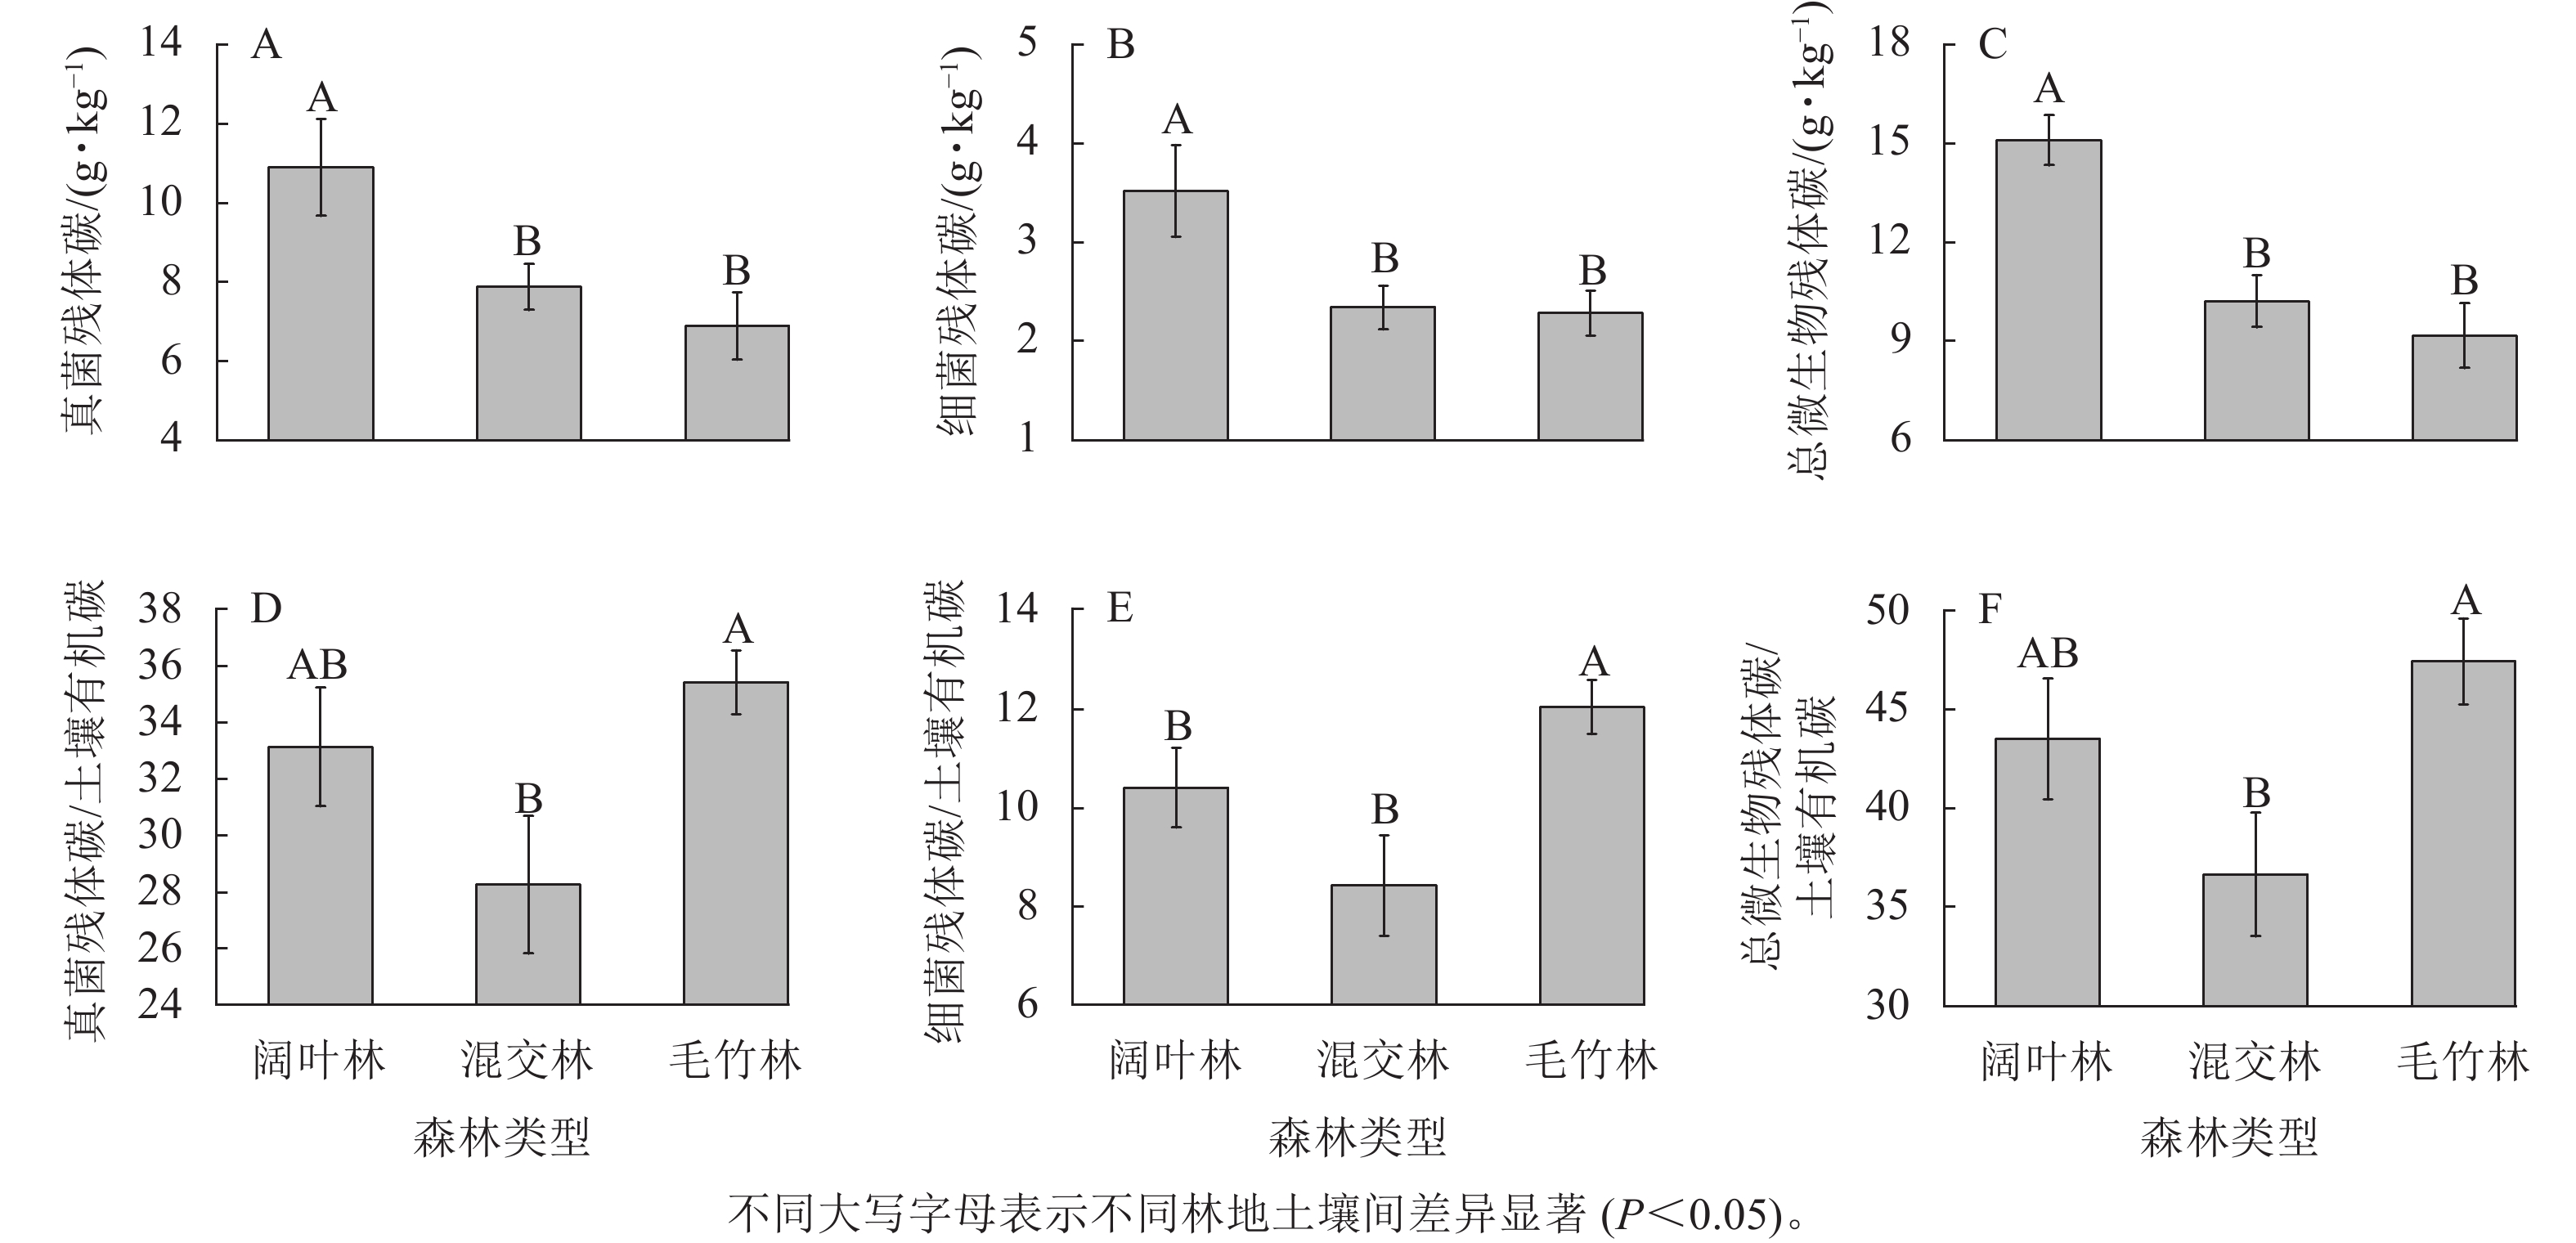
Objective This study is to reveal the dynamic changes of soil organic carbon (SOC) in evergreen broad-leaved forests during the expansion of Phyllostachys edulis in subtropical regions by affecting the accumulation of soil microbial residue carbon. Method Taking amino sugar as the research object, this study investigated the accumulative effect of microbial residue carbon in surface soil (0−10 cm) of evergreen broad-leaved forest, Ph. edulis and broad-leaved mixed forest, and pure Ph. edulis forest in the state-owned forest farm of Lingfengsi in Anji, Zhejiang Province, as well as the correlation characteristics with organic carbon. Result During the expansion of Ph. edulis, soil fungal residue carbon, bacterial residue carbon and microbial residue carbon all significantly (P<0.05) decreased (36.76%, 35.13% and 40.32%, respectively), and the annual litter production indirectly affected SOC, fungi biomass, soil bacteria biomass and total microbial biomass, thereby affecting the cumulative effects of soil fungal residue carbon, bacterial residue carbon and total microbial residue carbon, respectively. There was no significant change in the ratio of fungal residue carbon, bacterial residue carbon and total microbial carbon residue to SOC in the early stage of Ph. edulis expansion (from evergreen broad-leaved forest to Ph. edulis and broad-leaved mixed forest), but in the late stage of expansion (from Ph. edulis and broad-leaved mixed forest to Ph. edulis forest), the ratio increased significantly. Conclusion The role of microbial carbon on SOC gradually increases during the expansion of Ph. edulis into evergreen broad-leaved forests. [Ch, 4 fig. 1 tab. 26 ref.]
2024, 41(5): 1013-1023.
doi: 10.11833/j.issn.2095-0756.20230532
Abstract:
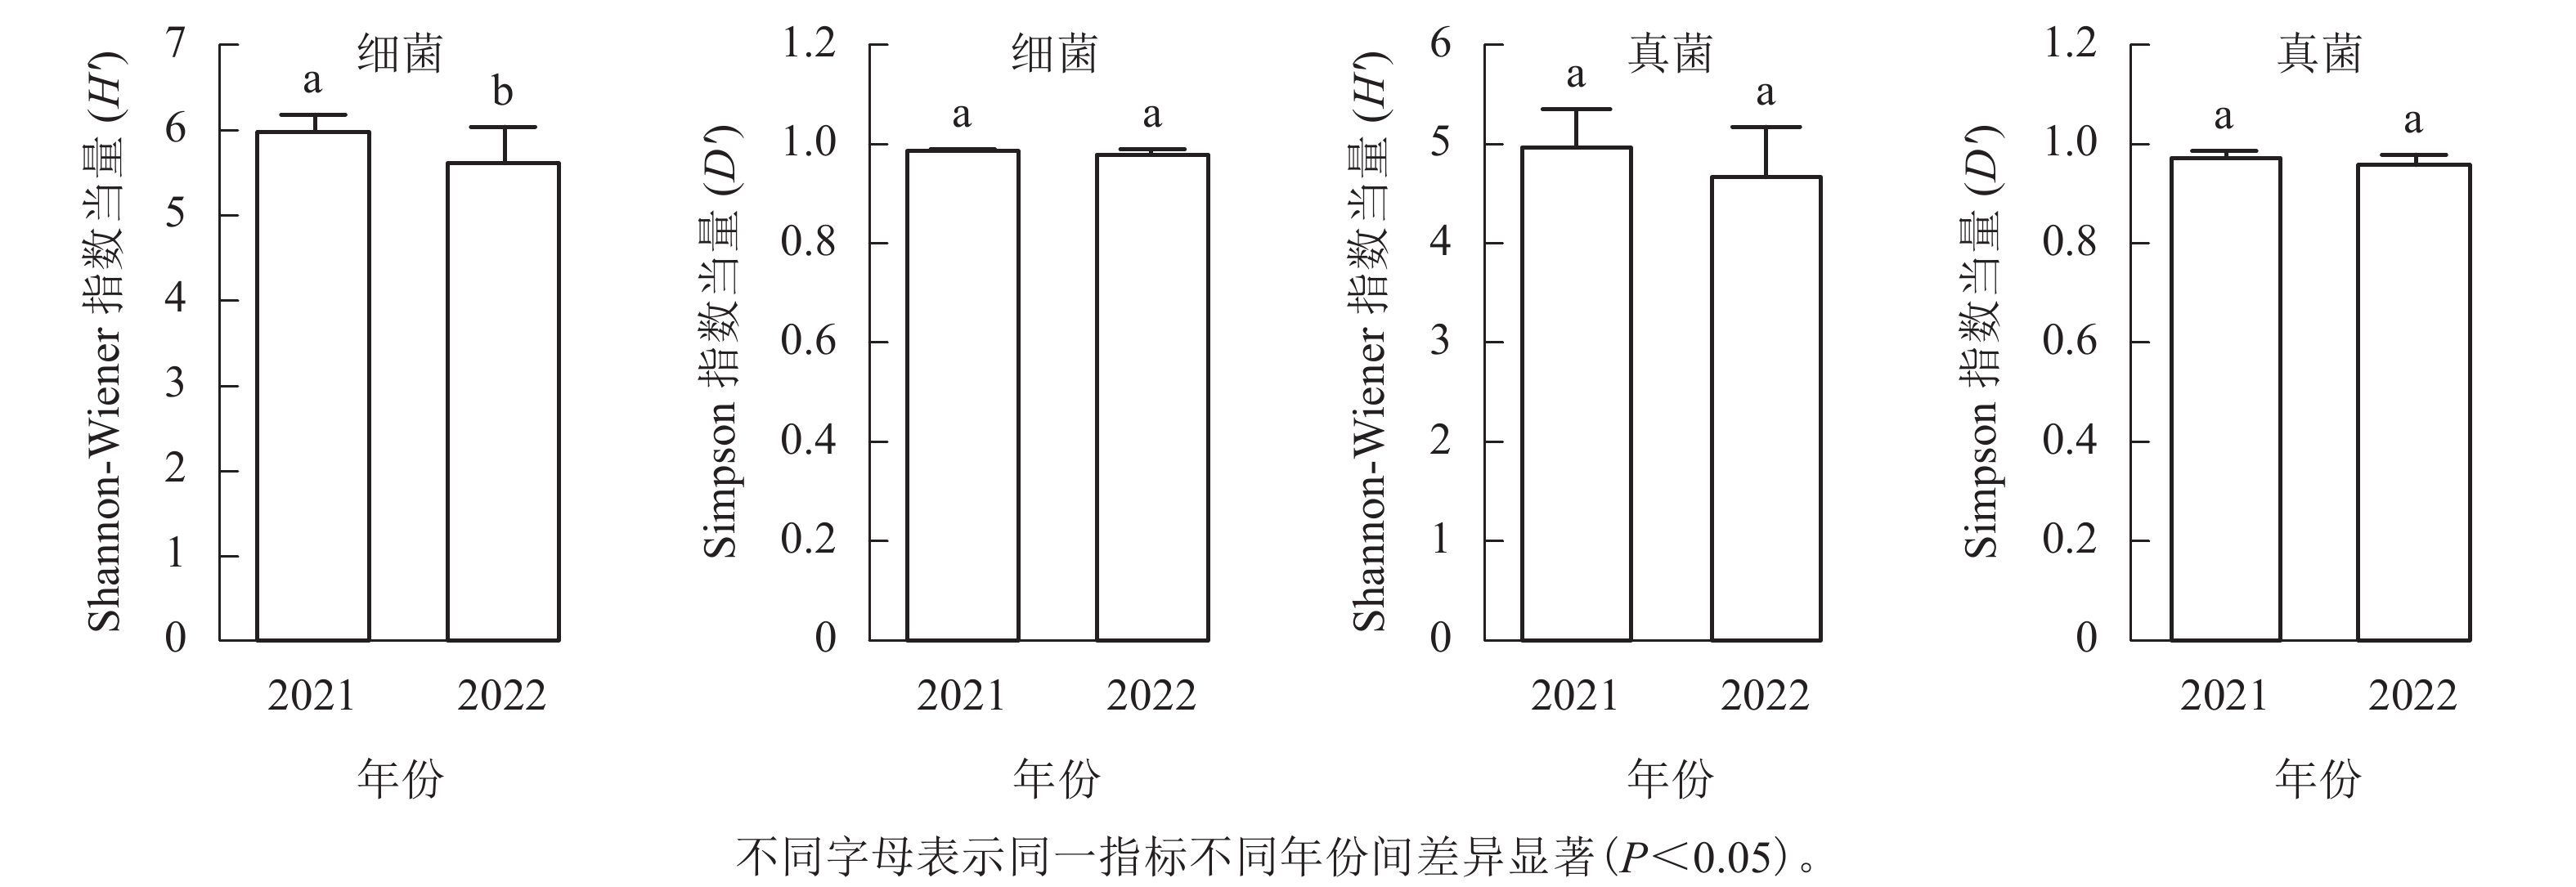
Objective This study, with an investigation into the temporal and spatial changes of soil microbial diversity in the habitat of the rare plant Emmenopterys henryi and the main controlling factors of these changes, is aimed to provide reference for the protection and breeding of the rare species. Method High throughput sequencing technology was used to detect operatonal taxonomic units (OTUs) of bacteria and fungi in soil from 34 E. henryi dominated stands before an analysis was conducted of the effects of altitude, slope direction, soil nutrition, and characteristics of the tree communities on the diversities of soil bacteria and fungi. Result α diversity analysis indicated that the mean of Shannon-Wiener index of bacterial communities was 5.87, and that of fungal communities was 0.98; the numbers equivalent of Shannon-Wiener index (H') decreased significantly with the increase of altitude (P<0.05) and increased significantly with the increased soil pH (4.62 − 5.83) (P<0.05); meanwhile, the numbers equivalent of Simpson index (D') was significantly and negatively correlated with the content of available potassium in soil (P<0.05); H' and D' of soil fungi firstly decreased and then increased with the increased altitude, and significantly decreased with the increased alkali-hydrolyzed nitrogen content in soil (P<0.05); meanwhile, there was a significant and positive correlation between D' and the basal area of the central E. henryi tree (P<0.05). β diversity analysis indicated that the mean Sorenson index of bacterial communities was 0.39, with 70.2% contributions of species turnover component, and that of fungal communities was 0.72, with 85.1% contributions of species turnover component; the Sorenson indices of soil bacterial and fungal communities were both significantly spatial auto-correlated (P<0.05), and correlated with differences in soil nutrient content and tree species composition. The partial Mantel test results indicated that: the species turnover components of bacteria were significantly correlated with differences in soil nutrient content and tree species composition (P<0.05), while the species richness difference of soil bacteria was significantly correlated with the difference in sampling year (P<0.05); the species turnover components of fungi were significantly spatially auto correlated (P<0.05), and correlated with differences in soil nutrient content, while the species richness difference of fungi was significantly correlated with the differences in sampling year and the altitude (P<0.05). Conclusion Compared with other forests in China, the habitat of E. henryi in Jiulongshan boasts more diverse soil fungal, less diverse soil bacterial and higher spatiotemporal heterogeneity in soil microbial diversity. Altitude, soil alkaline nitrogen content, and the size of E. henryi tree are the main factors affecting α diversity of soil microbes, while soil physicochemical properties and the composition of tree communities are the main factors that influence β diversity of soil microbes. [Ch, 4 fig. 2 tab. 32 ref.]
2024, 41(5): 1024-1036.
doi: 10.11833/j.issn.2095-0756.20230584
Abstract:
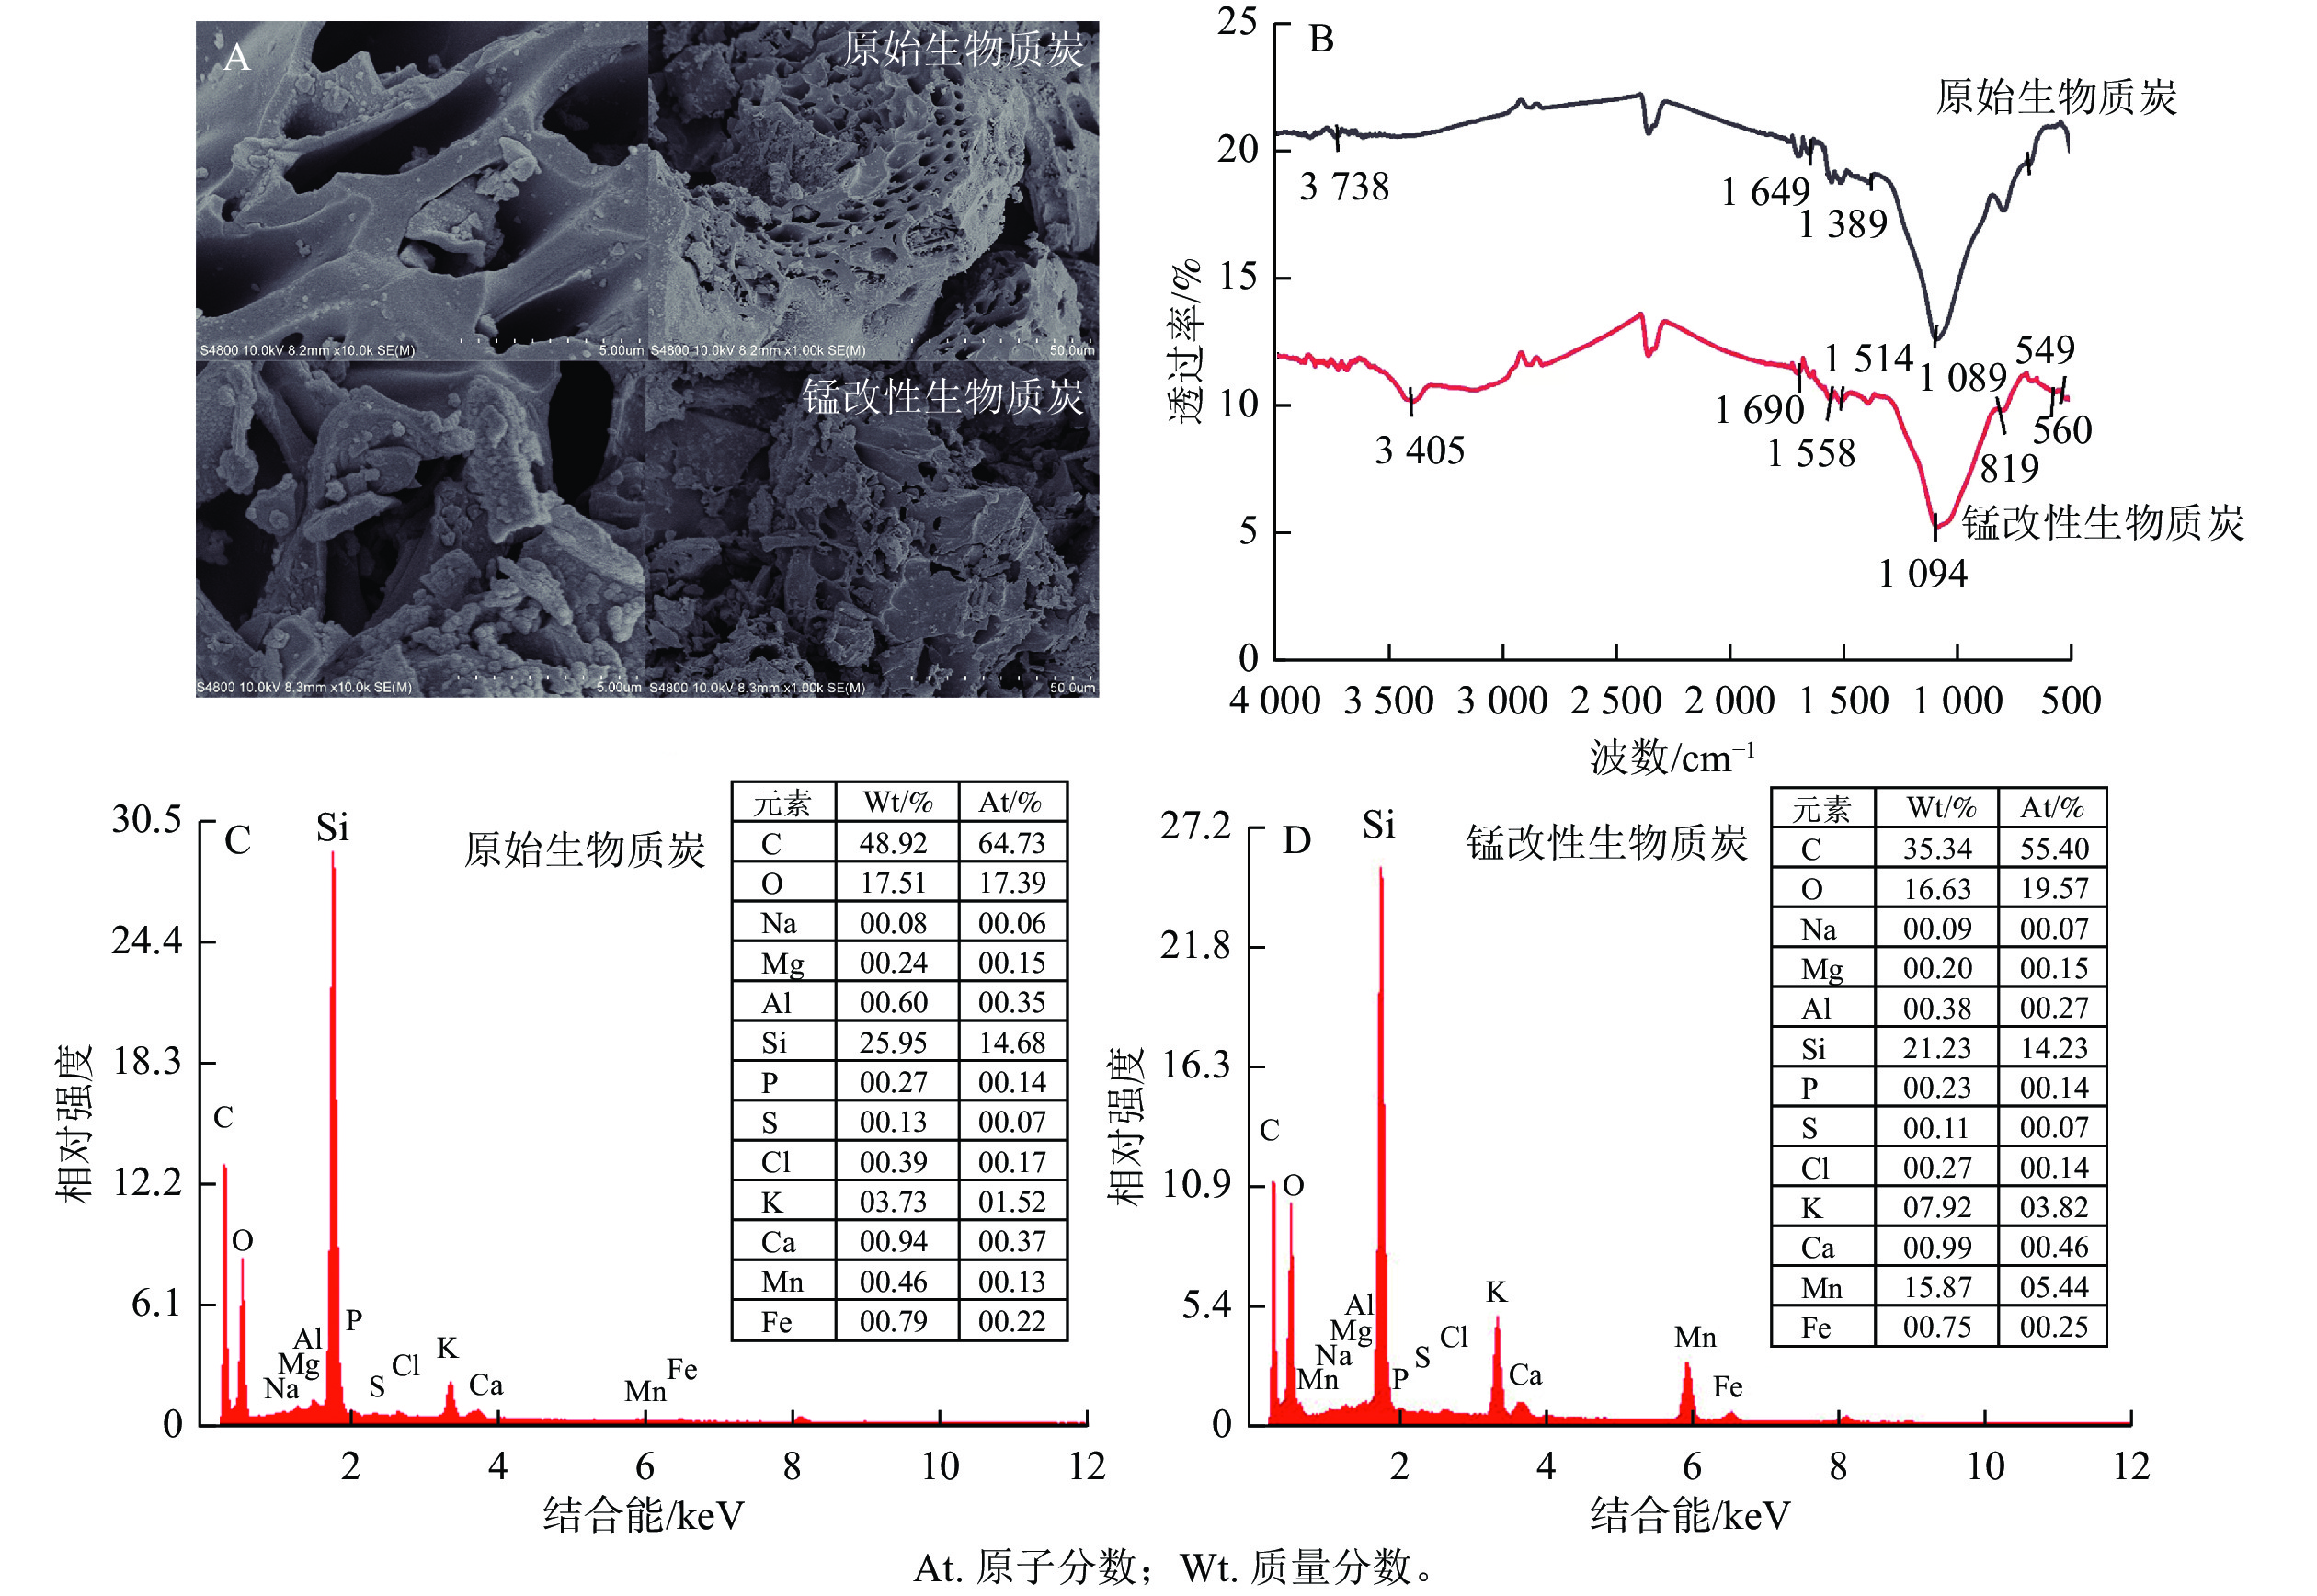
Objective Soil heavy metal pollution is a common problem encountered in agricultural production activities, and how to effectively and synchronously passivate arsenic and lead in soil has become a research hotspot. Method Raw biochar was prepared from rice husks, and manganese-modified biochar was obtained through potassium permanganate. Pot experiments were conducted using garlic (Allium sativum) as an indicator plant to evaluate the effects of raw biochar and manganese-modified biochar at different application rates (10 and 30 g·kg−1) on the bioavailability of arsenic and lead in soil and soil enzyme activities. Result The application of different proportions and types of biochar significantly increased the content and pH of soil organic matter, available potassium and available phosphorus (P<0.05), while decreased the content of soil alkaline hydrolyzed nitrogen. The effect of manganese-modified biochar was more significant than that of original biochar. The application of 10 g·kg−1 manganese-modified biochar significantly reduced the content of available arsenic in soil by 11.5%, while 30 g·kg−1 manganese-modified biochar significantly decreased the content of lead in the extractable state of diethylenetriamine pentaacetic acid (DTPA) in soil by 28.3%. Compared with the control, the application of 10 g·kg−1 manganese-modified biochar increased the activities of β-N-acetylglucosamine glycase by 11.6%, and the application of 30 g·kg−1 manganese-modified biochar significantly increased the activity of acid phosphatase and β-glucoglycase by 9.8% and 37.7%, respectively. Meanwhile, the contents of nitrogen, phosphorus and potassium in garlic plants treated with manganese-modified biochar significantly increased (P<0.05), while the contents of arsenic and lead significantly decreased (P<0.05). Conclusion Manganese-modified biochar has significant potential in improving soil fertility and repairing arsenic-lead contaminated soil. [Ch, 8 fig. 1 tab. 52 ref.]
2024, 41(5): 1037-1046.
doi: 10.11833/j.issn.2095-0756.20240110
Abstract:
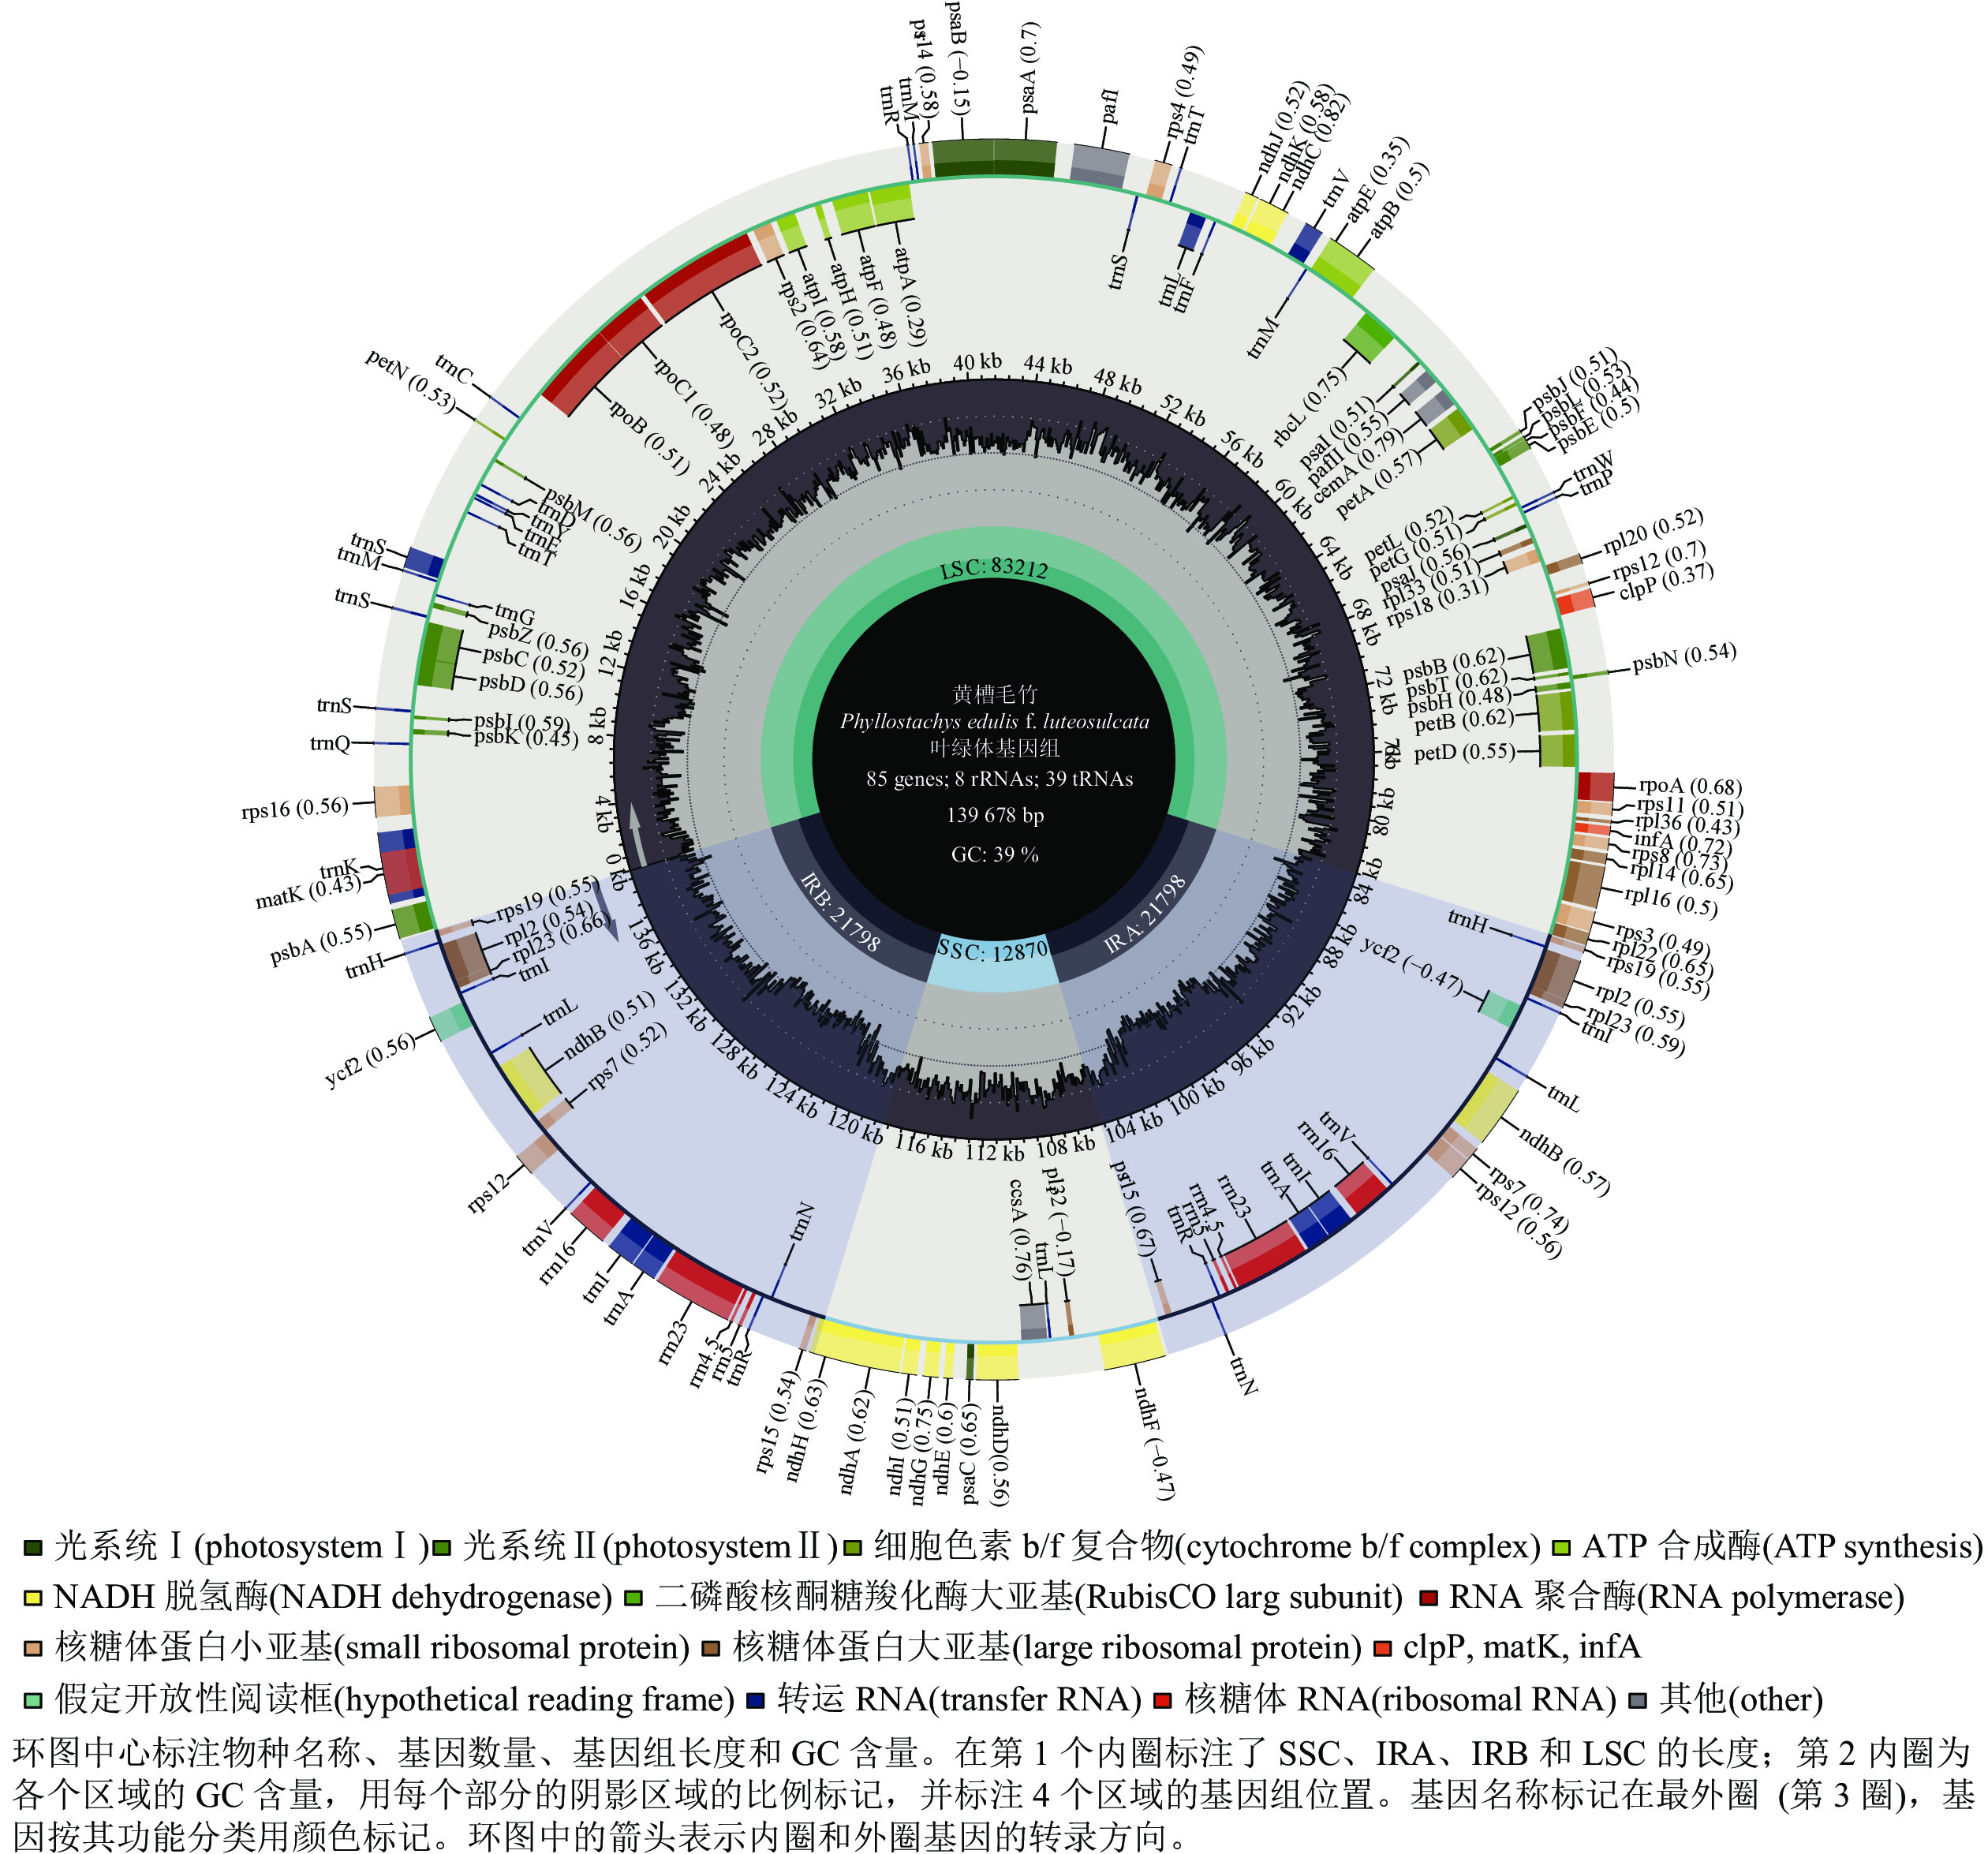
Objective This study aims to sequence, assemble, annotate, and analyze the chloroplast genome of Phyllostachys edulis f. luteosulcata. The research also involves comparing its chloroplast genetic information and phylogenetic relationships with those of other subspecies of Ph. edulis (moso bamboo). Method High-throughput sequencing data were used to assemble and annotate the complete chloroplast genome of Ph. edulis f. luteosulcata. Subsequently, we analyze the composition, codon preference, and repetitive sequences of the genome. Furthermore, sequence comparison and phylogenetic analysis were conducted to compare the phylogenetic relationships and genome sequence differences among different subspecies of moso bamboo. Result The chloroplast genome of Ph. edulis f. luteosulcata is a double-loop DNA of 139 678 bp in length containing 132 genes, including 85 protein-coding genes, eight ribosomal RNAs (rRNAs), and 39 transfer RNAs (tRNAs). The codon preference for this genome has an A/U base at the end. There are 49 repetitive sequences with the most common type being A/T and 55 Simple Sequence Repeat (SSR) sites. Phylogenetic analyses constructed using the chloroplast genome sequences showed that Ph. edulis f. luteulosulcata is in a monophyletic branch together with other subspecies of Ph. edulis and is closely related to the original variety of Ph. edulis var. pubescens. The analysis of chloroplast genome sequence and coding gene characteristics showed that there were differences in the number and structure of coding genes and low degree of sequence variation among the subspecies of Ph. edulis. Conclusion This study is the first to comparatively analyze the chloroplast genomes of subspecies of Ph. edulis and reveals a degree of sequence variation in these subspecies of Ph. edulis. This variation information would be available for the identification and comparison of subspecies of Ph. edulis. [Ch, 5 fig. 2 tab. 27 ref.]
2024, 41(5): 1047-1055.
doi: 10.11833/j.issn.2095-0756.20230583
Abstract:
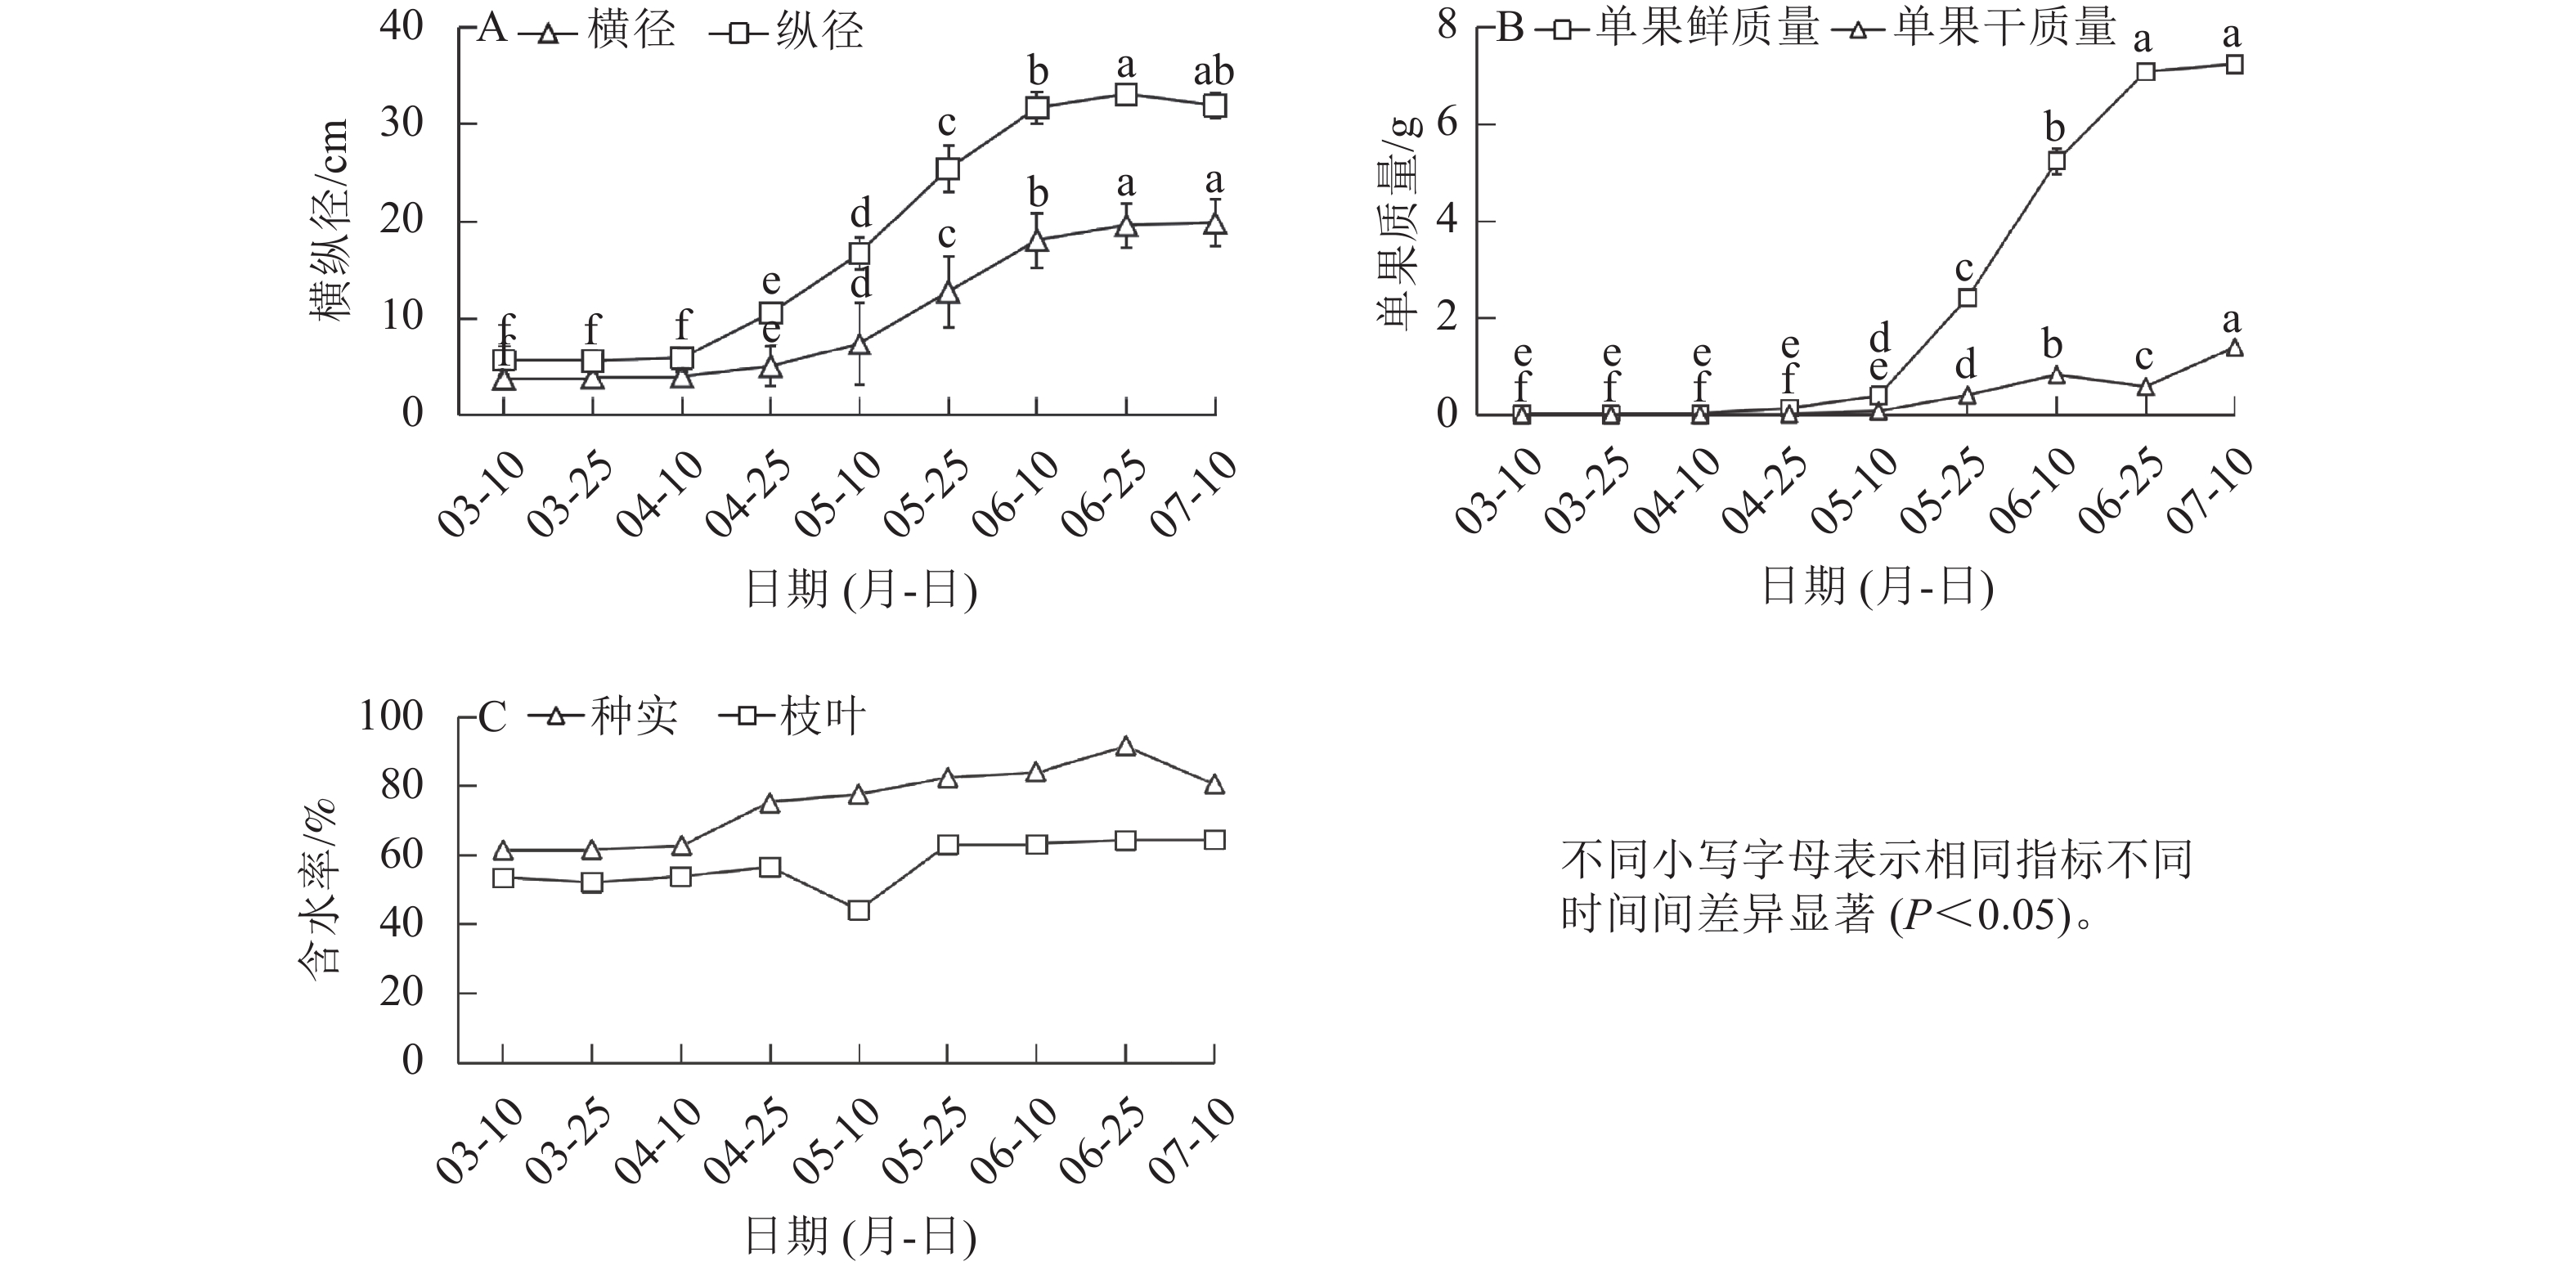
Objective The objective is to explore the relationship between the content and accumulation of mineral elements in the branch-leaf mixture and seeds of Torreya grandis ‘Merrillii’ during the early growth stage of seeds, in order to provide a basis for scientific fertilization and improve the quality and yield of T. grandis ‘Merrillii’ seeds. Method T. grandis ‘Merrillii’ trees (2 a rootstocks and 17 a after grafting) were selected for experiment on Donghu campus of Zhejiang A&F University. Lateral branches (with leaves) and seeds of the second generation were collected from early March to early July, and the dynamic changes in nitrogen (N), phosphorus (P), potassium (K), calcium (Ca), magnesium (Mg), zinc (Zn), manganese (Mn) and copper (Cu) content and accumulation in branch-leaf mixture and seeds were analyzed. Result In the early growth stage of T. grandis ‘Merrillii’ seeds, there was no significant change in the transverse and longitudinal diameter of the seeds, dry and fresh weight, and moisture content of each fruit before early April. However, from mid April to mid June, the growth rate increased rapidly and then stabilized, and the accumulation of N, P, and K in branch-leaf mixture decreased while the accumulation and content of N, P, and K in seeds continued to increase, which indicated that N, P, and K in branch-leaf mixture were preferentially supplied to the growth of seeds. During the slow growth and flower bud differentiation stage, the demand for N, P, and K by seeds was relatively small, while during the rapid growth stage, the demand for N, P, and K by seeds increased. This phenomenon intensified with time. On a time scale, Ca gradually absorbed and accumulated in the branch-leaf mixture, while Ca content and accumulation in seeds decreased and ertremely decreased significantly. After the rapid growth period, the accumulation of Mg in seeds increased, while the accumulation and content of Mg in branch-leaf mixture decreased with the expansion of seeds. During the early growth stage of T. grandis ‘Merrillii’ seeds, the accumulation of Zn and Cu in branch-leaf mixture showed a decreasing trend, and the seed had a relatively small demand for Zn, Cu and Mn. Conclusion (1) The volume and moisture content of the fast-growing T. grandis ‘Merrillii’ seeds increase rapidly, and tend to stabilize after the filling period. (2) The content and accumulation of elements are closely related to the long-term growth of T. grandis ‘Merrillii’ seeds. To improve the quality of seeds, N, P and K fertilizers should be applied at the end of the slow growth period and the beginning of the fast growth period, along with an appropriate amount of trace element fertilizers such as Zn and Cu. Mg fertilizer should be applied after seed harvest. [Ch, 5 fig. 27 ref.]
2024, 41(5): 1056-1065.
doi: 10.11833/j.issn.2095-0756.20240160
Abstract:
Objective This study, with an investigation of the classification of Osmanthus fragrans Colour Group and the changes of leaf color and related physiological characteristics during its growth, is aimed to provide theoretical basis for the classification, selection and improvement of Colour Group. Method With a total of 29 germplasm materials of Colour Group selected and classified by quantitative criteria and cluster analysis, two representative lines (‘Luocai 3’and ‘Luocai 28’) were selected to observe the pigment distribution, component qualitative analysis, content determination and physiological index determination. Result Based on the cluster analysis at the stage of 30% leaf discoloration (S2), the cultivars were divided into two categories and three color series, namely the reddish brown series (the first subclass of Class Ⅰ), the orange brown series (the second subclass of Class I), and the purple pink series (the second subclass of Class Ⅱ). The anatomical structures of the two strains showed that anthocyanins were mainly distributed in the upper and lower epidermal cells of young leaves, and gradually decrease with leaf growth with the content of anthocyanins gradually decreasing, the content of chlorophyll continuing to rise and the content of carotenoids gradually increasing insignificantly. During the growth process of leaves, there was no significant pattern in the changes of soluble protein and soluble sugar content between the two, but they were relatively high in the S1 stage. The POD activity continued to increase, with ‘Luocai 3’ being higher than ‘Luocai 28’ at each stage and the pH value of the leaves showed no significant change and remained within the acidic range. Conclusion Based on the leaf color parameters of the S2 period, a detailed color scheme division can be carried out for Colour Group. The color change of Colour Group leaves is mainly affected by the decrease in anthocyanin content and the increase in chlorophyll content, in which POD plays an important role. The difference between the reddish brown and orange brown series lies in the content and ratio of anthocyanins and carotenoids. [Ch, 7 fig. 1 tab. 29 ref.]
2024, 41(5): 1066-1074.
doi: 10.11833/j.issn.2095-0756.20240109
Abstract:
Objective In order to study the effects of different kinds and amount of biochar on the growth and nutrition of Acer truncatum seedlings, the better biochar and its application amount are selected to provide a theoretical reference for the scientific application of biochar in A. truncatum seedlings. Method The seedlings were used as experimental objects, and pot experiments were carried out. Conventional light substrate without biochar was taken as the control (ck1). 3 types of biochar (rubber biochar, rice husk biochar and bamboo biochar) with addition of 30.0, 50.0 and 70.0 g·kg−1 were set up. The growth, biomass, photosynthetic index, root morphology and nutrition of the seedlings under different treatments were determined. The principal component analysis and membership function analysis of the seedlings were used to comprehensively evaluate the indicators and explore the best biochar and addition proportion. Result The growth, biomass, root morphological index, photosynthetic index and nutrient content of the seedlings were all promoted by adding biochar to the substrate, the effect of rice husk biochar on seedling height, stem diameter, photosynthetic index and root morphology was better than that of bamboo biochar and rubber biochar. 50.0 g·kg−1 rice husk biochar addition proportion was the best for root growth of seedlings, compared with ck1, the total root length, total root surface area, total root volume and average root diameter increased by 98.79%, 110.22%, 175.00% and 37.50%, respectively. 70.0 g·kg−1 rice husk biochar addition proportion had significant effects on chlorophyll, net photosynthetic rate, stomatal conductance, and transpiration rate, compared with ck1, which increased by 50.00%, 221.76%, 200.00% and 146.91%, respectively. The evaluation index of seedlings with 50.0 g·kg−1 rice husk biochar was the highest (0.665), which was the best amount of biochar. Conclusion The addition of biochar to the the substrate could promote the absorption and utilization of nutrients in A. truncatum seedlings. It is suggested that 50.0 g·kg−1 rice husk biochar should be preferentially selected when adding biochar to A. truncatum seedling substrate. [Ch, 3 fig. 4 tab. 31 ref.]
2024, 41(5): 1075-1084.
doi: 10.11833/j.issn.2095-0756.20240157
Abstract:
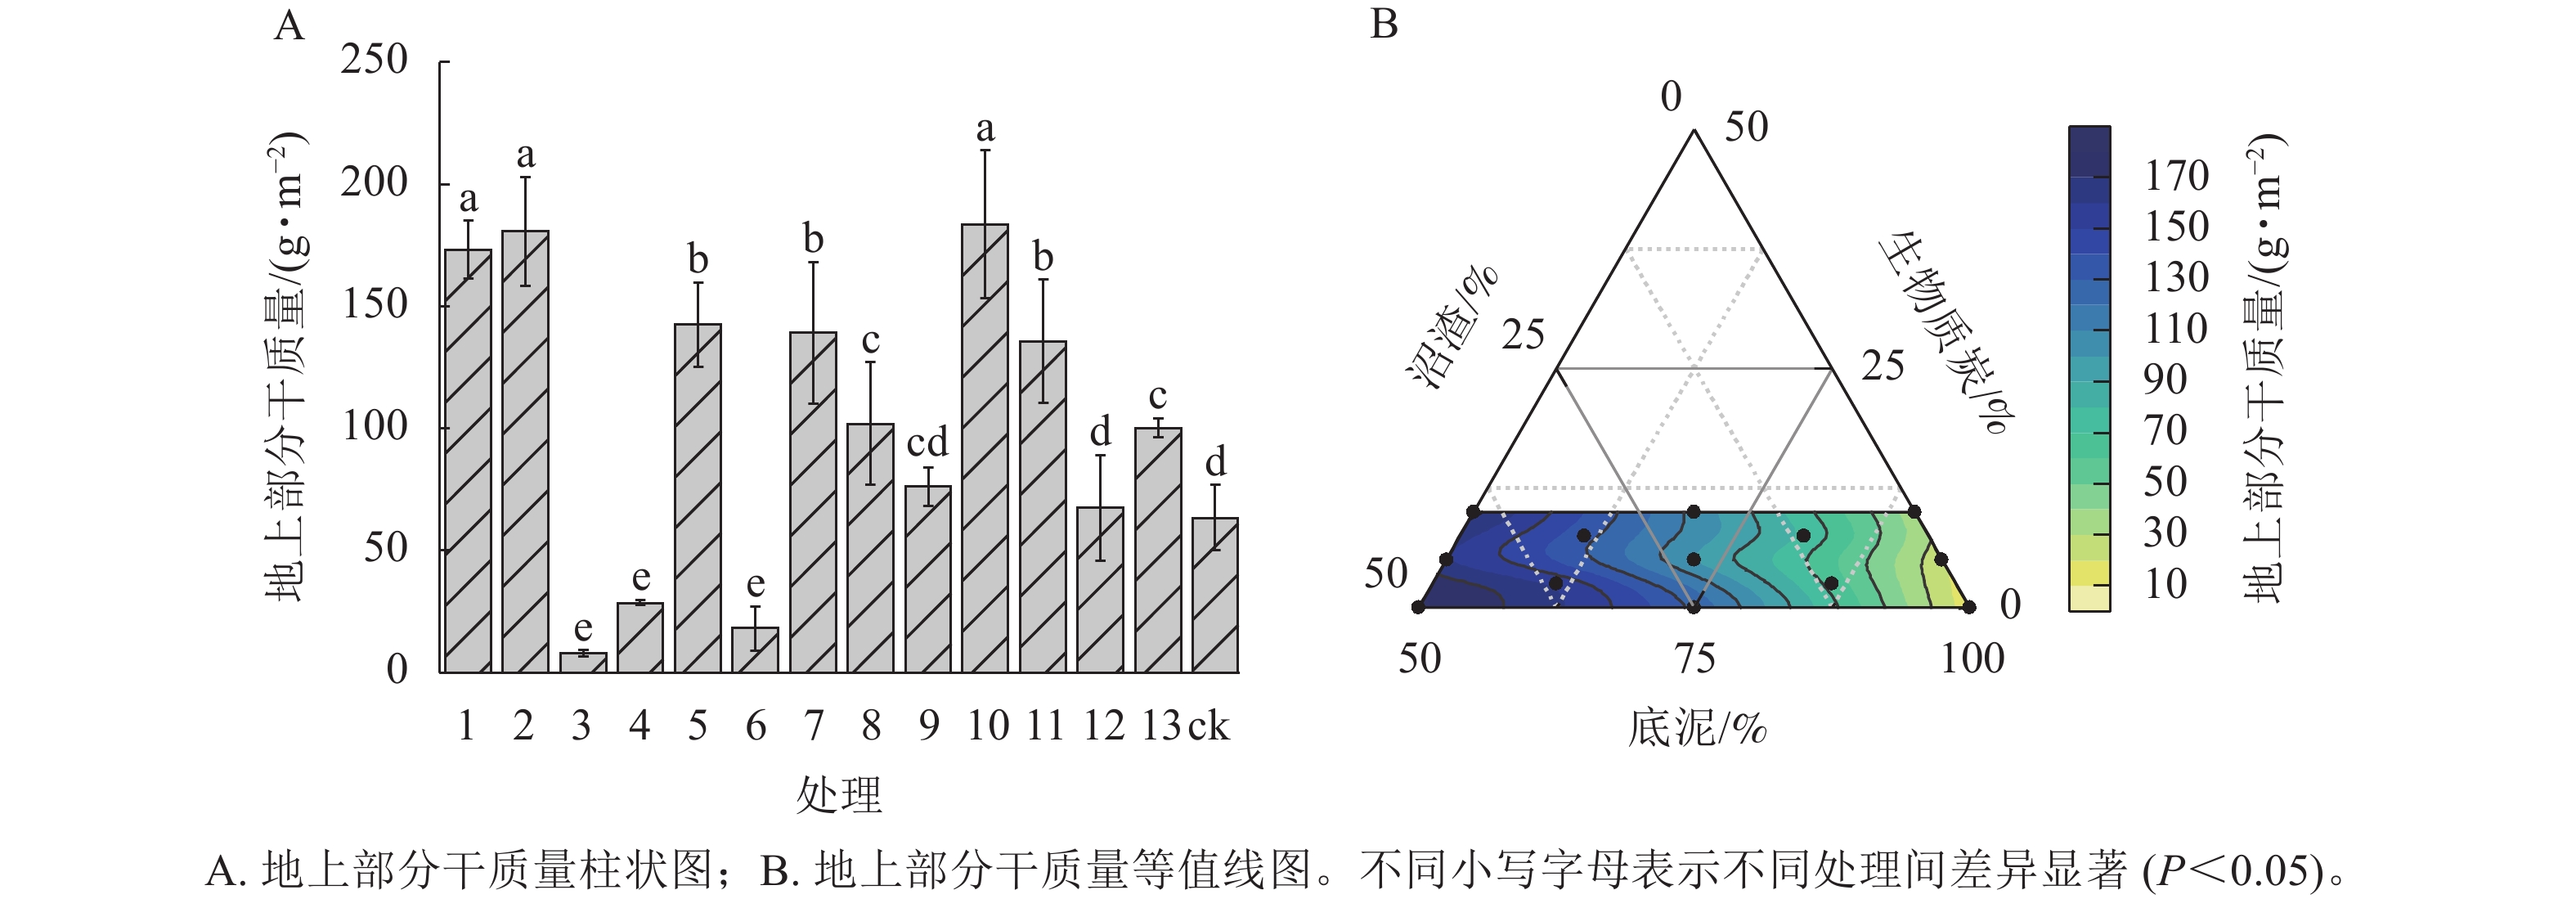
Objective The dredging sediment from rivers, lakes, reservoirs and ponds can be used for the production of high-economic value landscape plants such as turf, which can not only solve the problem of occupying cultivated farmland and destroying top soil layer, but also solve the treatment and disposal problem of organic solid waste such as sediment. Method Based on the mixed material design and the principle of maximum consumption of river sediment, the proportion of the three raw materials, namely sediment, biogas residue, and biochar, was set to be 50%≤sediment≤100%, 0≤biogas residue≤50%, and 0≤biochar≤10%, respectively, totaling 13 treatments. Meanwhile, cultivated soil was set as the control, and the growth indicators (biomass dry mass, chlorophyll, root activity) and physiological indicators (soluble sugar, malondialdehyde, antioxidant protective enzymes) were measured to explore the feasibility and suitability of planting Agrostis stolonifera ‘PENN A-4’ with the substrate of river sediment as the main material instead of the traditional cultivated soil. Result Compared with the control, the dry weight of above ground part and underground part of A. stolonifera ‘PENN A-4’ significantly increased by 58.53% and 17.19%, respectively (P<0.05) and the root activity nearly doubled (P<0.01) when the proportion of sediment in the mixed substrate was 75.00%, the proportion of biogas residue was 20.00%, and the proportion of biochar was 5.00%, but the content of chlorophyll a and b in plants decreased by approximately 20.00% (P<0.01). In addition, the mixed substrate significantly increased superoxide dismutase activity (28.66%, P<0.01), but had no significant effect on the contents of soluble sugar and malondialdehyde, catalase activity and peroxidase activity in plants. Conclusion It is feasible to use river sediment as the main material, mixed with an appropriate proportion of biogas residue and biochar as a substrate instead of cultivated soil for A. stolonifera ‘PENN A-4’ planting. The mixed biogas residue can effectively increase the aboveground biomass and root vitality of the turf grass, while biochar can effectively increase the underground biomass of the grass. [Ch, 5 fig. 4 tab. 25 ref.]
2024, 41(5): 1085-1093.
doi: 10.11833/j.issn.2095-0756.20230505
Abstract:
Objective The acceleration of urbanization leads to the change of urban underlying surface, serious landscape fragmentation, and continuous intensification of urban heat island effect, especially in the urban center where buildings and populations are highly clustered. The establishment of reasonable ecological network has become one of the important ways to improve the urban ecological environment. Method Based on the “source-sink” theory, this study used morphological spatial pattern analysis (MSPA) and landscape connectivity index to select the “source” and “sink” landscapes with good landscape stability and high connectivity as ecological sources in the study area. The minimum cumulative resistance model, gravity model and hydrological analysis module were used to construct and screen important ecological corridors in the study area, so as to establish a multi-level “source-sink” landscape network to alleviate urban thermal environment problems. Result The results showed that 24 core patches with important connectivity were selected as important ecological sources. There were 102 “source-source” corridors, 141 “source-sink” corridors, 325 “source-sink” corridors, 103 ecological nodes and 148 obstacle points. Through comprehensive superposition, the first-level compensation corridor was mainly composed of Minjiang River, Pihe River and other river channels, the second-level transport corridor was mainly distributed in the area with dense “sink” landscape, and the third-level action corridor was mainly distributed in the high-intensity construction area. Conclusion The optimization pattern of a multi-level ecological network based on the “source-sink” theory is an important measure for effectively mitigating the urban heat island effect. [Ch, 4 fig. 3 tab. 25 ref.]
2024, 41(5): 1094-1104.
doi: 10.11833/j.issn.2095-0756.20240166
Abstract:
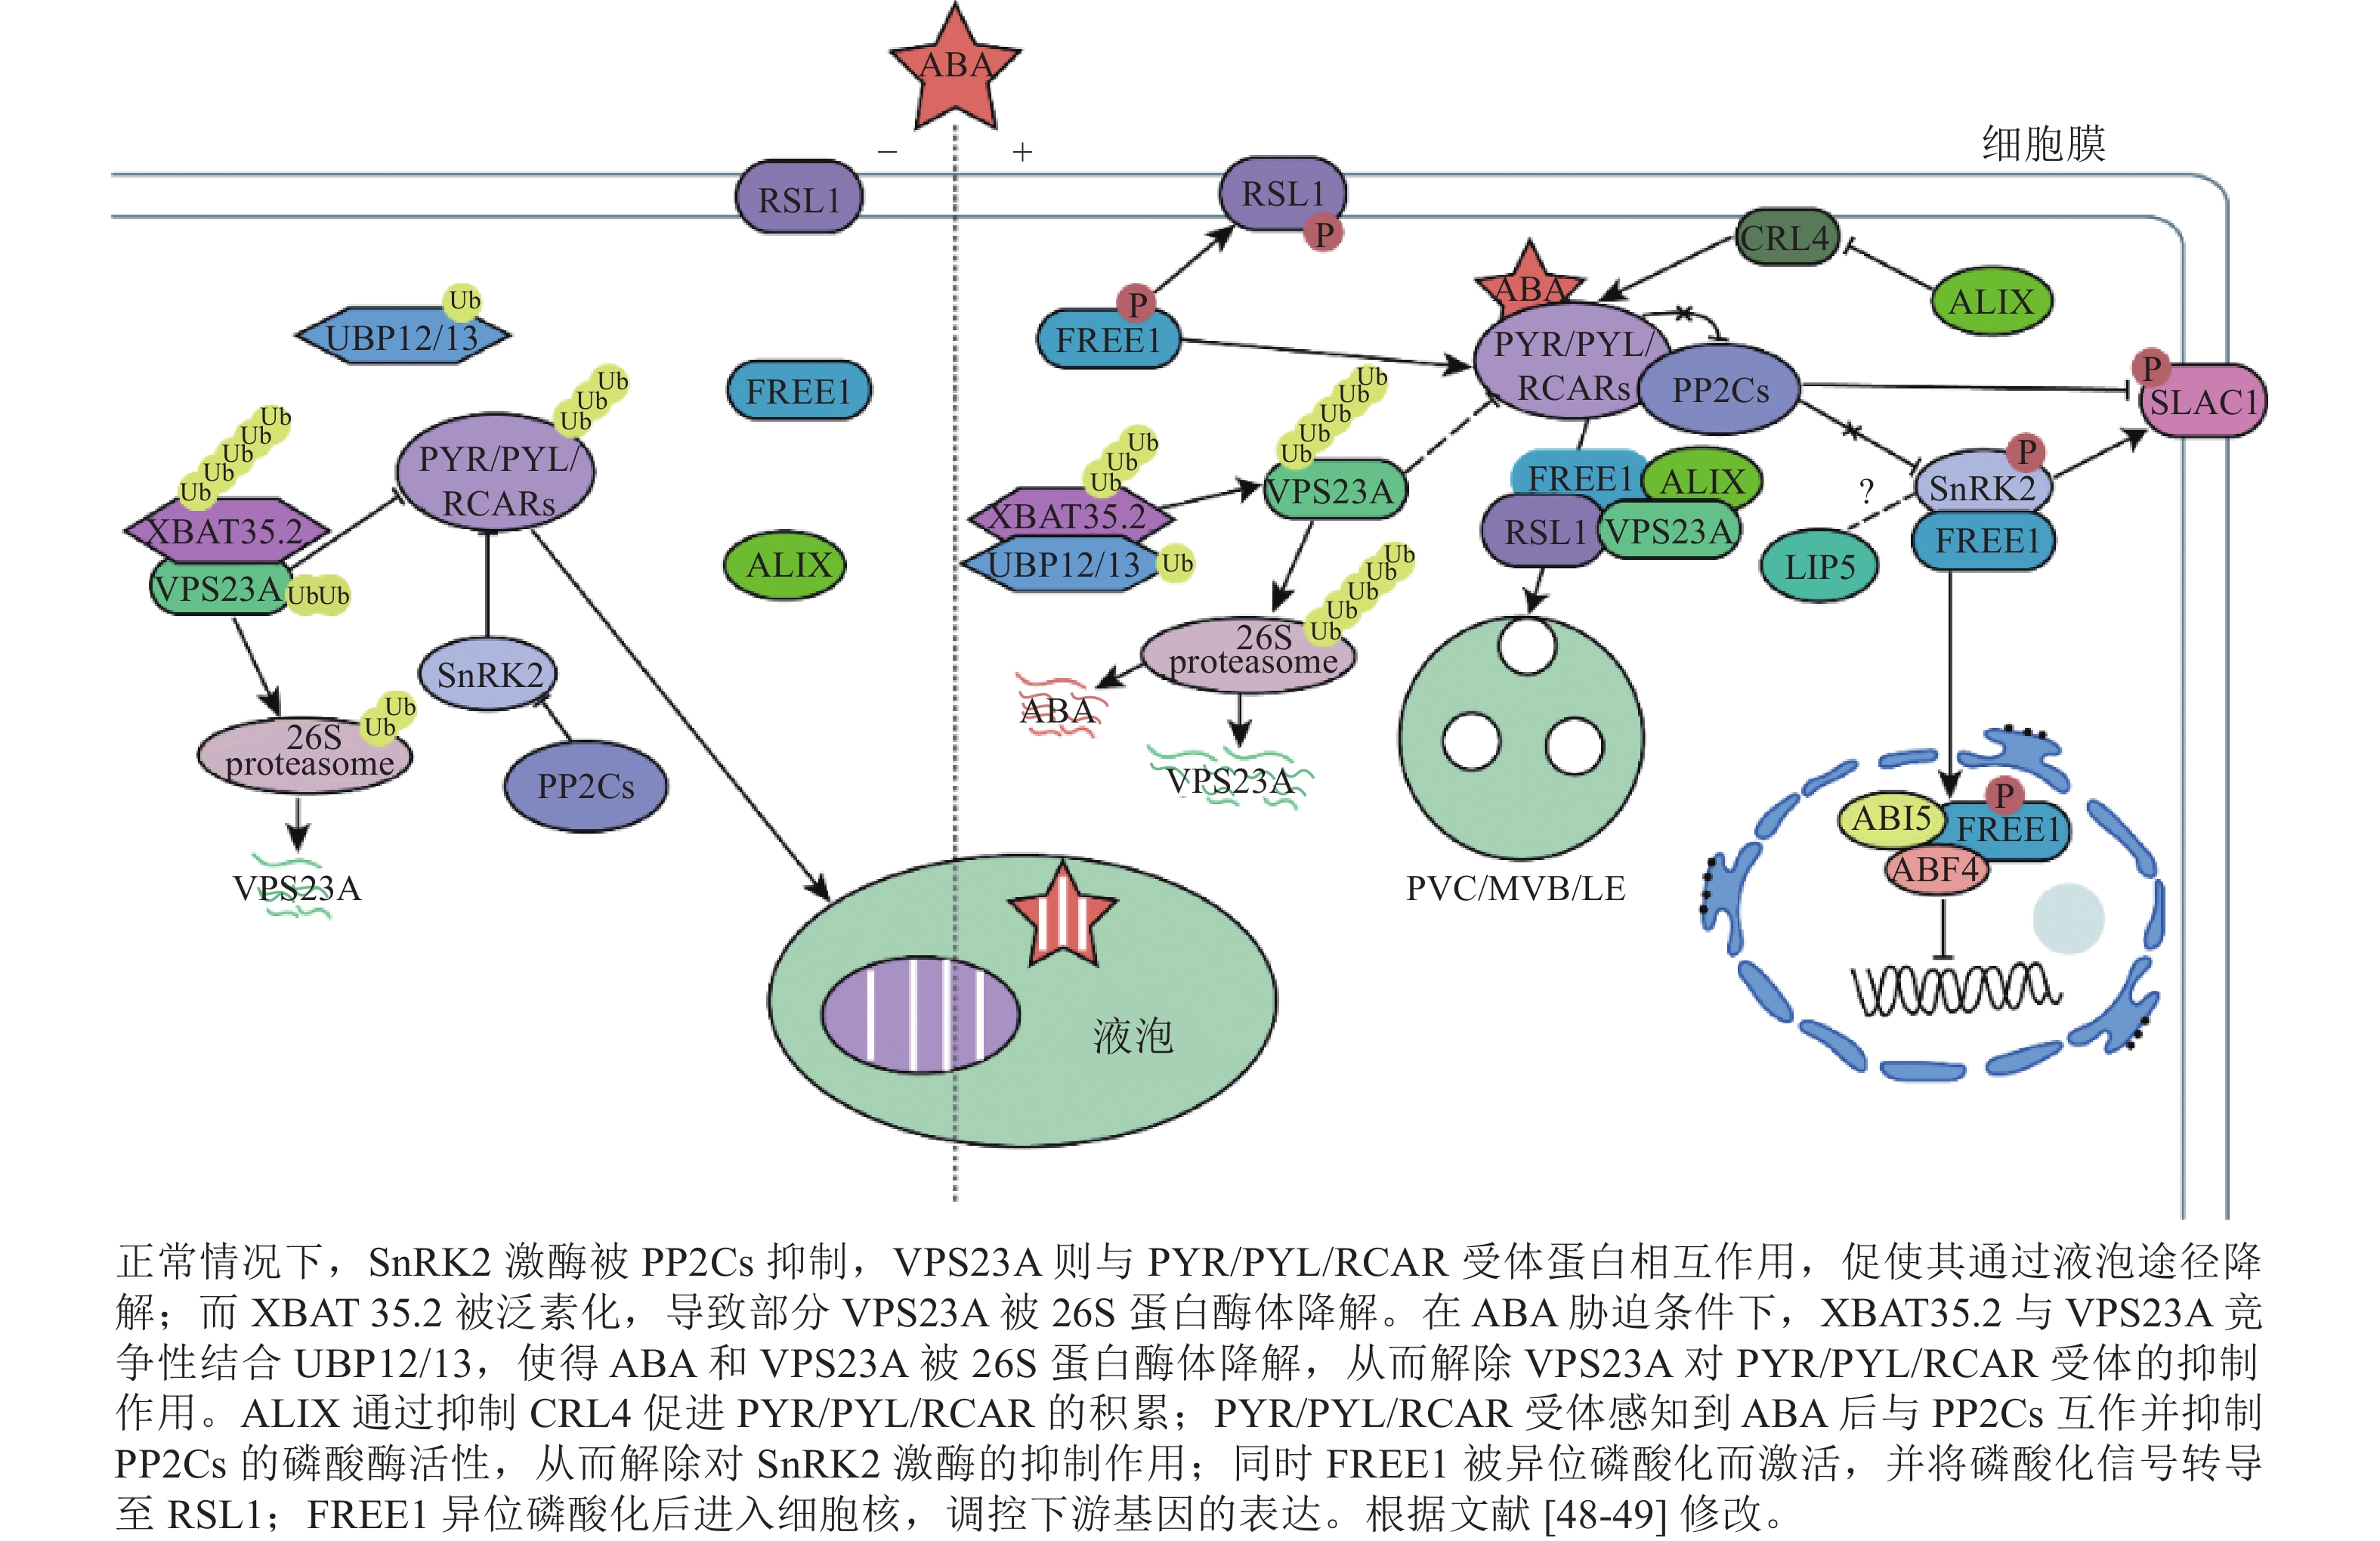
Stress is one of the major reasons causing global crop yield decline. Under stress conditions, the intracellular protein trafficking needs to be adjusted rapidly to ensure the correct delivery of the associated cargo molecules via endomembrane system. The endomembrane system in eukaryotic cells contains diverse membrane-bound organelles, which are accurately and efficiently generated in a well-organized way. These organelles play essential roles in protein transport. The endosomal sorting complex required for transport (ESCRT) complex mediates the biogenesis of prevacuolar compartment/multivesicular body (PVC/MVB), facilitating the vacuolar trafficking of the ubiquitinated proteins. This review highlights the recent research on ESCRT machinery in plant stress responses, including the basic composition and function of ESCRT, and the regulatory role of ESCRT in plant abiotic stress (i.e. drought and salt stress) and innate immunity. To explore how ESCRT specifically recognizes and regulates stress response proteins, it will be helpful to construct a more precise ESCRT-mediated molecular regulatory network of stress responses. [Ch, 2 fig. 1 tab. 70 ref.]
Stress is one of the major reasons causing global crop yield decline. Under stress conditions, the intracellular protein trafficking needs to be adjusted rapidly to ensure the correct delivery of the associated cargo molecules via endomembrane system. The endomembrane system in eukaryotic cells contains diverse membrane-bound organelles, which are accurately and efficiently generated in a well-organized way. These organelles play essential roles in protein transport. The endosomal sorting complex required for transport (ESCRT) complex mediates the biogenesis of prevacuolar compartment/multivesicular body (PVC/MVB), facilitating the vacuolar trafficking of the ubiquitinated proteins. This review highlights the recent research on ESCRT machinery in plant stress responses, including the basic composition and function of ESCRT, and the regulatory role of ESCRT in plant abiotic stress (i.e. drought and salt stress) and innate immunity. To explore how ESCRT specifically recognizes and regulates stress response proteins, it will be helpful to construct a more precise ESCRT-mediated molecular regulatory network of stress responses. [Ch, 2 fig. 1 tab. 70 ref.]


